

- Market Size (2026)
- USD 215.0 Mn
- Forecast (2036)
- USD 567.9 Mn
- CAGR (2026 to 2036)
- 10.2%
How big is the Soil Contaminant Degraders Market in 2026?
USD 215.0 million in 2026 and USD 567.9 million by 2036 at a 10.2% CAGR.
Demand for soil contaminant degraders is projected to expand at 10.2% CAGR between 2026 and 2036. Valuation is estimated at USD 215.0 million in 2026 and USD 567.9 million by 2036. Purchase decisions start with contaminant profiles because microbial survival depends on site chemistry and treatment conditions. The European Commission reported in December 2025 that 60% to 70% of EU soils were unhealthy. The Soil Monitoring Law strengthens pressure to document contamination and verify soil recovery after treatment work. That requirement places degraders within the environmental remediation technologies field used during site recovery projects. Projects needing biological stimulation intersect with soil bioremediation nutrients planning during treatment design and monitoring.
Remediation accounts in the United States are expected to evaluate degraders against brownfield schedules and field verification requirements. Programs in India are anticipated to focus more on high-volume land recovery and simple handling near legacy waste sites. European remediation teams compare survival of applied microbial cultures against moisture conditions and contaminant mixtures before approving a treatment plan. UNEP reported in March 2026 that the Western Balkans contained more than 2,700 potentially contaminated sites. That inventory broadens screening for soil treatment chemicals when biological treatment needs a combined approach. Crop-linked contamination creates another route because distributors need microbial performance that fits agricultural microbials programs. Procurement teams are projected to compare contaminant coverage and field dosing support before approving recurring orders.
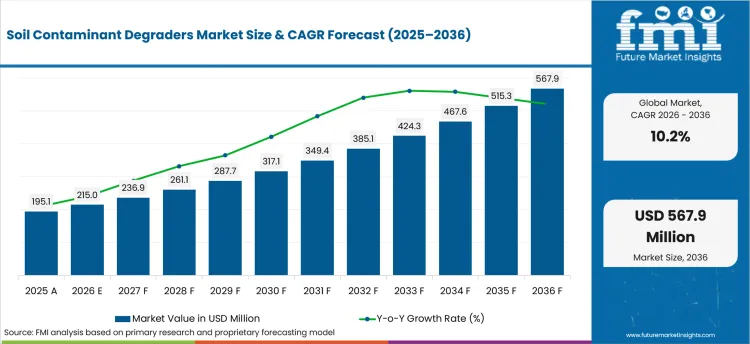
| Metric | Value |
|---|---|
| 2025 Market Size | USD 195.1 million |
| 2026 Market Size | USD 215.0 million |
| 2036 Market Size | USD 567.9 million |
| Forecast CAGR (2026-2036) | 10.2% |
| Product Type Focus | Premix |
| Premix Share (2026) | 40.0% |
| Source Focus | Microbial |
| Microbial Share (2026) | 33.0% |
| Crop Type Focus | Cereals & grains |
| Cereals & grains Share (2026) | 39.5% |
Summary of the Soil Contaminant Degraders Market
| Market Signal | Commercial Impact |
|---|---|
| Demand and Growth Drivers | Site owners are expected to use degraders when treatment matches the contaminant and field verification confirms performance.
|
| Product and Segment View | The market spans prepared formulations and active biological sources that serve farm soil recovery and industrial remediation work.
|
| Geography and Growth Outlook | Country demand is expected to reflect cleanup policy and crop intensity. Local remediation service capacity shapes the remaining difference between markets.
|
| Competitive Landscape | Competition is expected to center on contaminant coverage and practical field delivery instead of a single universal treatment formula.
|
| Analyst Perspective | Field validation is the structural bottleneck in this market. Supplier selection depends on whether biological activity is reproducible under the site's actual soil conditions.
|
How is the soil contaminant degraders market segmented?
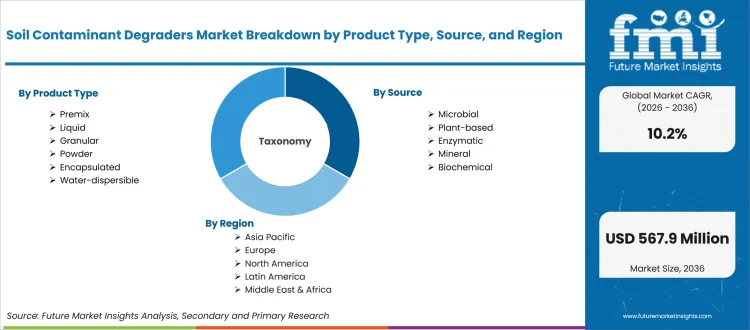
The soil contaminant degraders market is segmented by Product Type, Source, Crop Type, Application, and region.
By Product Type, the market covers Premix, Liquid, Granular, Powder, Encapsulated, and Water-dispersible formats for field delivery. By Source, the market covers Microbial, Plant-based, Enzymatic, Mineral, and Biochemical approaches. Crop Type covers Cereals & grains, Oilseeds & pulses, Fruits & vegetables, Turf & ornamentals, and Plantation crops. Application covers Soil treatment, Foliar, Seed treatment, Crop protection, and Compost & residue treatment. Regional coverage includes North America, Latin America, Europe, East Asia, South Asia, Oceania, and Middle East and Africa.
What supports demand for Premix within the Product Type category?
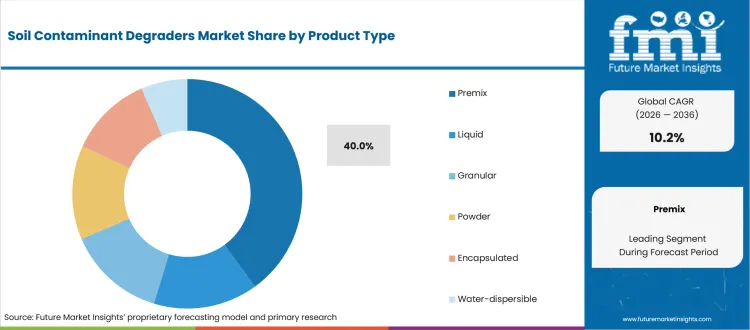
Prepared blends reduce the field preparation steps that introduce dosing error during large soil treatment programs. Carus identified chlorinated solvents and petroleum hydrocarbons as target challenges for the June 2025 Battelle Bioremediation Symposium. That application context favors premix products when site teams need a documented formulation and a repeatable mixing procedure. The same purchasing logic appears in biological co-pack crop nutrition programs where field crews prefer controlled preparation.
- By Product Type, Premix is estimated to hold 40.0% share in 2026 because applicators need stable dosing across repeated treatment zones. Prepared blends are expected to reduce field mixing steps and simplify training during larger remediation projects.
- Remediation contractors are projected to prefer premix formats when formulation control has to remain consistent from pilot work to full application. REGENESIS highlighted SourceStop and related soil or groundwater treatment technologies in its November 2025 newsletter. That portfolio context reinforces the value of defined application guidance during site work and repeat dosing decisions.
How does Microbial shape purchasing within the Source category?
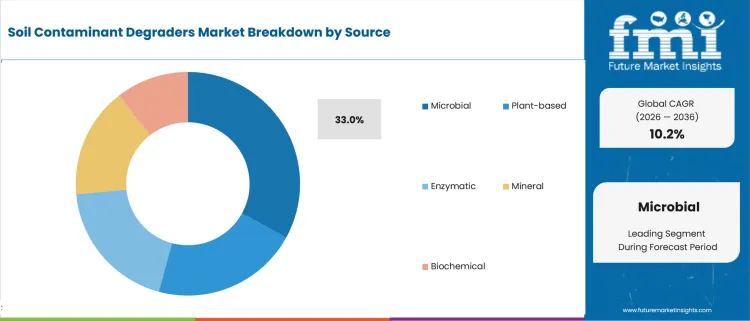
Microbial products are evaluated against the contaminant pathway and the conditions needed to sustain biological activity after application. EFSA reported in May 2026 that its European pesticide residue program analyzed 86,449 samples. The monitoring scale keeps residue persistence visible across food supply chains and agricultural production systems. Degrader suppliers need a clear explanation of strain function and field survival before agronomy teams approve repeated use. This evaluation overlaps with biofertilizer formulations when microbial handling and storage rules share channel requirements.
- In 2026, microbial is projected to account for 33.0% of Source demand due to its direct role in biodegradation pathways. Agronomy teams are expected to examine strain identity and storage stability before repeat field use.
- Environmental consultants are anticipated to select microbial sources when site chemistry supports biodegradation and monitoring confirms treatment progress. GreenSoil Group launched an in-situ remediation project for chlorinated solvent contamination in Sweden during April 2026. The project removes contaminant mass from soil vapor and groundwater before a biological phase stimulates anaerobic microbes to break down chlorinated solvents. The phased approach shows why microbial treatment selection follows site characterization and pretreatment decisions before routine biological degradation begins.
What keeps Cereals & grains relevant within the Crop Type category?
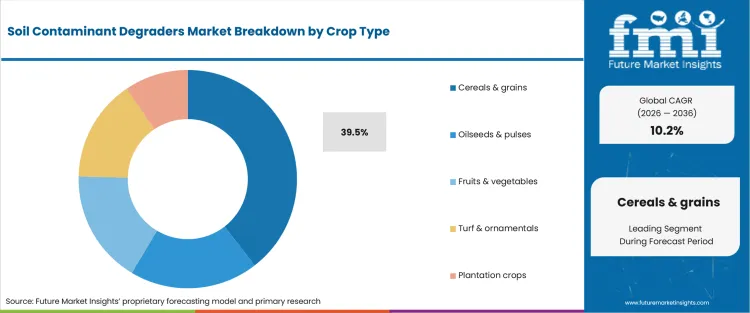
Cereal production places soil inputs under broad-acre application constraints where treatment must fit planting schedules and familiar farm equipment. USDA NASS reported in May 2025 that growers in surveyed states used 107 pesticide active ingredients on winter wheat acres. The number of compounds in use reinforces the need to identify the residue and degradation pathway before product selection. Field advisers need treatment plans that fit crop rotations and permit follow-up sampling without disrupting seasonal work.
- Cereals & grains is forecast to represent 39.5% of crop type demand in 2026 because broad-acre production creates repeated soil management needs. Growers are expected to favor products that fit common spraying or soil-incorporation practices without creating a separate application workflow or delaying routine field operations during recurring production seasons.
- Crop advisers are projected to evaluate degraders against residue identity and rotation plans before recommending a field program. In October 2025, GreenSoil Group presented biopolymer-assisted leaching as a treatment route for PFAS-contaminated soil. The method uses a biopolymer to mobilize PFAS so the compounds are easier to remove from the soil. The example reinforces a wider selection principle because treatment design must match contaminant behavior before a field protocol is set.
What are the drivers, restraints, and opportunities in the soil contaminant degraders market?
Demand is supported by site-specific contaminant matching. Field variability slows approval and integrated biological service models widen repeat-use routes.
- Driver: Cleanup programs are expected to expand demand for degraders that fit contaminant-specific treatment plans and documented site endpoints.
- Restraint: Field approval is anticipated to slow when soil chemistry or moisture conditions reduce biological activity after the initial treatment.
- Opportunity: Integrated treatment providers are projected to scale adoption by combining biological products with site assessment and monitoring support.
Public cleanup funding is expected to create more project entry points for degraders that fit practical remediation plans. The USA EPA announced in April 2026 that selected Brownfields programs represented more than USD 224 million in grant funding. That project pipeline increases the need for site teams to screen biological treatment beside established remediation routes. The same projects often rely on soil contamination screening when treatment progress must be measured between dosing rounds.
Field variability creates the main adoption restraint because microbial activity changes across pH conditions and contaminant mixtures. The UK Environment Agency updated its LCRM options appraisal guidance in June 2025 around three formal steps. The sequence moves projects from feasible options toward detailed evaluation and final selection under a documented review process. Degrader suppliers need evidence that fits the site's risk model before a biological route is approved. Weak field protocols are expected to extend review time and reduce repeat orders during later treatment rounds.
Service partnerships create a realistic route around field complexity when local teams combine product knowledge with site access. GreenSoil Group and GeoRem International announced a remediation partnership for Africa in May 2025 that connected biological remediation capability with regional engineering resources. Similar service models are expected around PFAS concentration and destruction systems when projects need local operation and monitoring support. Degrader suppliers are projected to gain repeat work when monitoring and treatment adjustment operate within one service program.
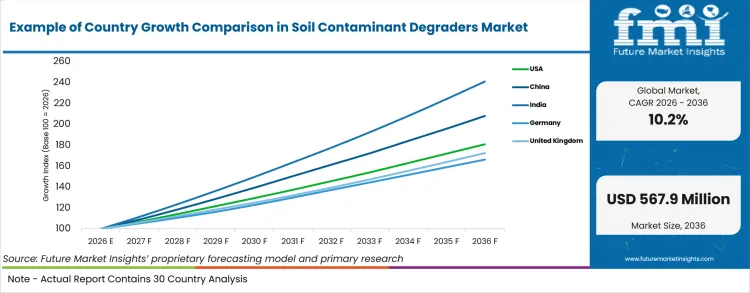
Which country CAGRs are profiled in the soil contaminant degraders market?
| Country | CAGR |
|---|---|
| United States | 6.1% |
| China | 7.6% |
| India | 9.2% |
| Germany | 5.2% |
| United Kingdom | 5.6% |
| Japan | 4.4% |
| South Korea | 5.9% |
Source: FMI's proprietary forecasting model and primary research
How do country-level CAGRs compare in the soil contaminant degraders market?
Country growth is expected to differ according to contaminated-site inventories and the way treatment results are verified. In June 2026, the USA EPA reported that more than 290 Superfund site cleanups had been completed since January 2025. That activity illustrates how a defined cleanup pipeline supports treatment planning and technical vendor screening. China and India are anticipated to emphasize large land-recovery programs and accessible local field support. Germany and the United Kingdom are projected to rely more heavily on structured risk assessment during project approval. Japan and South Korea are expected to place greater weight on government-led restoration requirements during supplier evaluation.
- Brownfield and Superfund work creates a steady technical screening environment for degraders in the United States. Demand is projected to grow at 6.1% CAGR through 2036 given that consultants compare biological routes against contaminant depth and treatment endpoints. The USA EPA announced in December 2025 that 55 Superfund sites in the Southeast were scheduled for five-year reviews during 2026. The review cycle keeps performance monitoring close to supplier selection during each formal project assessment. REGENESIS gives local project teams access to in-situ biological and chemical treatment options for several contaminant classes.
- Provincial soil-risk controls are expected to support treatment demand where industrial land moves toward residential or public use in China. Site owners first need a clear contaminant profile and an approved risk-control path before treatment design starts. Demand is forecast to expand at 7.6% CAGR through 2036 because remediation programs create more defined project workflows. The Hunan Provincial Government reported in June 2026 that risk control and remediation measures had been implemented for 544 designated land plots. Local environmental institutes and engineering contractors shape treatment selection during project design and formal site review.
- Legacy waste cleanup is widening the pool of land-recovery projects that need biological or combined treatment routes in India. Market demand is anticipated to rise at 9.2% CAGR through 2036 because local field support improves access beyond laboratory trials. The Press Information Bureau reported in January 2026 that the national accelerator program prioritized 214 high-impact dumpsites. Municipal bodies and local remediation contractors are expected to screen degraders where organic contamination is suitable for treatment before land reuse. IndoGulf BioAg adds domestic microbial formulation capacity for residue-focused applications that need locally supported biological products.
- PFAS and industrial soil contamination keep treatment verification central to German remediation projects during formal site assessment. Consultants are expected to compare degradation pathways with containment or removal when persistent compounds limit biological performance. The German Environment Agency convened a two-day PFAS soil conference in March 2025 to bring research and policy discussions into one forum. Demand in Germany is anticipated to expand at 5.2% CAGR through 2036 under structured site-review requirements. UBA and state environmental authorities influence the documentation expected around site investigation and treatment closure during remediation work.
- Land redevelopment in the United Kingdom is expected to keep degrader demand tied to risk assessment and verification records. Environment Agency guidance requires remediation choices to follow a documented options process before field work begins. Demand is estimated to expand at 5.6% CAGR through 2036 where biological treatments are screened within formal site-management workflows. The agency's June 2025 Stage 3 guidance sets four steps for remediation and verification across a documented project sequence. Environmental consultants and specialist contractors need suppliers that provide dosing plans and monitoring criteria before field work starts.
- Fukushima restoration activity gives Japan a distinct treatment context where removed soil and long-term land management remain visible. Demand is projected to expand at 4.4% CAGR through 2036 under careful documentation and project-control requirements. Local programs are expected to favor carefully documented treatment routes and controlled material handling during regulated restoration work. The Ministry of the Environment reported in March 2025 that about 14 million cubic metres of removed soil and waste had been transported to the Interim Storage Facility. Ministry-led restoration work keeps technical accountability close to contractor selection and long-term material management decisions.
- Industrial land management and changing environmental rules are expected to influence degrader screening in South Korea. Local contractors need products suitable for application within dense industrial corridors and verification against defined project endpoints. The Ministry of Environment announced 10 major environmental policy changes in January 2025 across its environmental policy program. Demand is forecast to expand at 5.9% CAGR through 2036 while remediation teams combine regulatory review with site-specific treatment design. Regional engineering firms and environmental laboratories are expected to shape supplier access during field trials and formal project review.
Who are the notable companies in the soil contaminant degraders market?
REGENESIS, Carus, Evonik Active Oxygens, Redox Tech, BBA Ecotech, GreenSoil Group, IndoGulf BioAg, and Infinita Biotech are the notable companies shaping this market.
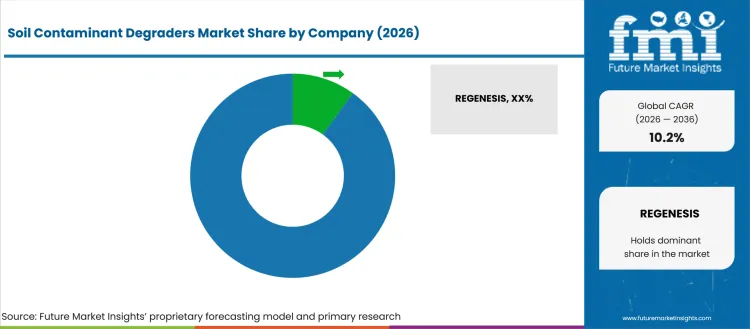
Competition is organized around contaminant fit and field execution because no single degrader works across every soil condition. Providers are expected to separate themselves through bench testing and application design before full field deployment. Monitoring support is projected to influence renewals when a project needs more than one dosing round. Carus announced its participation in Battelle’s 2026 Chlorinated Conference during April 2026 and emphasized soil and groundwater remediation for chlorinated solvents. That activity reflects competition built around technical consultation and project discussion during complex remediation planning. Field teams comparing biosurfactant cleanup systems are expected to apply the same test of contaminant coverage and application support.
- REGENESIS and Carus compete across in-situ treatment programs where consultants need products for several contaminant classes. REGENESIS combines technical design support with biological and adsorption technologies during field implementation and monitoring. Carus competes through treatment and bioremediation products that include application guidance for soil and groundwater projects.
- Evonik Active Oxygens and Redox Tech serve remediation plans that combine chemical reactions with biological processes. Evonik covers oxidation and reduction beside bioremediation technologies for mixed-contaminant remediation plans during site design. Redox Tech supports in-situ projects where reagent delivery and field implementation determine whether treatment reaches the contaminated zone.
- GreenSoil Group and BBA Ecotech compete more directly in biological soil treatment where field execution determines treatment consistency. GreenSoil combines project contracting with in-situ and on-site remediation across soil and groundwater work at industrial sites. BBA Ecotech supplies microorganism-based systems for hydrocarbon-contaminated soil where strain activity and treatment sequencing shape field performance.
- IndoGulf BioAg and Infinita Biotech address agricultural contamination through microbial and enzyme capabilities developed for residue management. IndoGulf develops contaminant-specific microbial blends for pesticide residues in agricultural and industrial systems under defined treatment goals. Infinita Biotech positions soil-remediation enzymes for contaminant breakdown where formulation support and local field conditions influence repeat use.
Competitive Benchmarking: Soil Contaminant Degraders Market
| Company | Biological Degradation Fit | Contaminant Breadth | Field Application Support | Geographic Reach |
|---|---|---|---|---|
| REGENESIS | High | High | High | Global |
| Carus | High | High | High | Global |
| Evonik Active Oxygens | Medium | High | High | Global |
| Redox Tech | High | High | High | United States and international projects |
| BBA Ecotech | High | Medium | Medium | Regional: Europe |
| GreenSoil Group | High | High | High | International |
| IndoGulf BioAg | High | High | Medium | Regional: India |
| Infinita Biotech | High | Medium | Medium | Regional: India |
Source: Future Market Insights competitive analysis, 2026. Ratings reflect relative portfolio relevance and workflow fit. Service capability and geographic reach shape the remaining comparison.
Key Developments in the Soil Contaminant Degraders Market
- In April 2025, Carus Europe partnered with Intrapore to expand access to particle-based in-situ groundwater remediation products across much of Europe. The arrangement connected Carus distribution support with technologies designed for complex aquifer contamination and difficult delivery conditions. Environmental consultants gained a broader set of treatment options for sites where conventional delivery is difficult.
- In November 2025, Evonik Active Oxygens presented its in-situ soil and groundwater remediation portfolio at the DECHEMA meeting in Frankfurt. The presentation covered chemical oxidation and chemical reduction while explaining how metals treatment and bioremediation technologies fit mixed-contaminant projects. The event gave remediation teams a direct route to compare treatment combinations with Evonik specialists before field design.
- In May 2025, GreenSoil Group completed the Westerlo remediation project for xylene and ethylbenzene contamination at a former industrial site. The company treated contaminated soil and groundwater while keeping the excavated soil on-site during the remediation program. The project demonstrated combined on-site and in-situ methods under controlled field operations without relying on off-site soil disposal.
Key Players in the Soil Contaminant Degraders Market
Integrated Remediation Technology Providers
- REGENESIS
- Carus
- Evonik Active Oxygens
- Redox Tech
Biological and Enzymatic Degrader Specialists
- BBA Ecotech
- GreenSoil Group
- IndoGulf BioAg
- Infinita Biotech
Soil Contaminant Degraders Market - Report Scope
| Coverage field | Report scope |
|---|---|
| Market breakdown | By Product Type, Source, Crop Type, Application, and Region |
| Market Definition | Products and treatment formulations used to degrade or transform soil contaminants. Scope covers biological remediation and agricultural residue-management applications. |
| Regions Covered | North America, Latin America, Europe, East Asia, South Asia, Oceania, and Middle East and Africa. |
| Countries Covered | United States, China, India, Germany, United Kingdom, Japan, South Korea, and other regional markets. |
| Key Companies Profiled | REGENESIS, Carus, Evonik Active Oxygens, Redox Tech, BBA Ecotech, GreenSoil Group, IndoGulf BioAg, and Infinita Biotech. |
| Forecast Period | 2026 to 2036. |
| Approach | Bottom-up market sizing with company validation and demand-side checks across remediation and agricultural use cases. |
Source: Future Market Insights - analysis driven by proprietary forecasting models and primary research
Soil Contaminant Degraders Market - Research Methodology
| Method | Approach |
|---|---|
| Primary Research | Interviews with remediation consultants and agricultural service providers. Distributor and technical procurement interviews were used to validate use cases and purchasing criteria. |
| Desk Research | Review of government cleanup programs and official soil or remediation guidance. Company portfolios and verified company announcements were used for competitive validation. |
| Market Sizing and Forecasting | Bottom-up demand estimates reconciled with product use patterns and country-level project activity before forecast modeling. |
| Data Validation | Cross-checks across source categories and primary interviews followed by consistency review of market values, shares, and country growth assumptions. |
Soil Contaminant Degraders Market by Segments
Soil Contaminant Degraders Market segmented by Product Type:
- Premix
- Liquid
- Granular
- Powder
- Encapsulated
- Water-dispersible
Soil Contaminant Degraders Market segmented by Source:
- Microbial
- Plant-based
- Enzymatic
- Mineral
- Biochemical
Soil Contaminant Degraders Market segmented by Crop Type:
- Cereals & grains
- Oilseeds & pulses
- Fruits & vegetables
- Turf & ornamentals
- Plantation crops
Soil Contaminant Degraders Market segmented by Application:
- Soil treatment
- Foliar
- Seed treatment
- Crop protection
- Compost & residue
Soil Contaminant Degraders Market by Region:
- North America
- United States
- Canada
- Europe
- Germany
- United Kingdom
- France
- Italy
- Spain
- Asia Pacific
- India
- China
- Japan
- South Korea
- Australia
- Latin America
- Brazil
- Argentina
- Mexico
- Chile
- Middle East & Africa
- UAE
- Saudi Arabia
- South Africa
Research Sources and Bibliography
- Carus. (2025, April). Carus Europe and Intrapore Forge Partnership to Enhance Groundwater Remediation Solutions Across Europe. Carus.
- Carus. (2025, February). Meet the Carus Remediation Team at the 2025 Battelle Bioremediation Symposium. Carus.
- Carus. (2026, April). Meet the Carus Remediation Team at Battelle’s 2026 Chlorinated Conference. Carus.
- Environment Agency. (2025, June). LCRM: Stage 2 options appraisal. Government of the United Kingdom.
- Environment Agency. (2025, June). LCRM: Stage 3 remediation and verification. Government of the United Kingdom.
- European Commission. (2025, December). First EU law on soil set to enter into force. European Commission.
- European Food Safety Authority. (2026, May). The 2024 European Union report on pesticide residues in food. EFSA Journal.
- Evonik Active Oxygens. (2025, November). DECHEMA | 24-25 November. Evonik Industries.
- USA Department of Agriculture, National Agricultural Statistics Service. (2025, May). 2024 Agricultural Chemical Use Survey: Wheat. USDA NASS.
- German Environment Agency. (2025, March). Conference 'PFAS in soil - forever pollution, forever concern?' on 25-26 March 2025 in Berlin, Germany. German Environment Agency.
- GreenSoil Group. (2025, May). End of Project: Westerlo (Belgium) GreenSoil's First Project featured Biopile and Biosparging to remediate massive Xylene contamination. GreenSoil Group.
- GreenSoil Group. (2025, May). GreenSoil and Georem International announce partnership for future remediation projects in Africa. GreenSoil Group.
- GreenSoil Group. (2025, October). Innovative PFAS Remediation Through Biopolymer-Assisted Leaching. GreenSoil Group.
- GreenSoil Group. (2026, April). Greensoil launches new remediation project in Sweden. GreenSoil Group.
- Hunan Provincial Government. (2026, June). 2025 Report on the State of the Ecology and Environment of Hunan Province Released. Hunan Provincial Government.
- IndoGulf BioAg. (2025, October). Organophosphorus Pesticide Bioremediation: Custom Microbial Consortiums for pre and post-harvest applications. IndoGulf BioAg.
- Ministry of Environment, Republic of Korea. (2025, January). Environmental Policies: Changes Coming in 2025. Ministry of Environment.
- Ministry of the Environment, Japan. (2025, March). Results of Initiatives to Date towards Final Disposal Outside Fukushima Prefecture and Approaches beyond FY2025. Ministry of the Environment.
- Press Information Bureau. (2026, January). Lakshya Zero Dumpsite: India's Drive to Eliminate City Dumpsites. Government of India.
- REGENESIS. (2025, November). November 2025 Newsletter. REGENESIS.
- USA Department of Agriculture, Natural Resources Conservation Service. (2025, October). Annual Soils Refresh. USDA NRCS.
- USA Environmental Protection Agency. (2025, December). EPA Region 4 to Review Cleanups at 55 Southeast Superfund Sites in 2026. USA EPA.
- USA Environmental Protection Agency. (2026, April). Applications Selected for FY 2025 Brownfields Assessment, Revolving Loan Fund, Cleanup Grants, and RLF Supplemental Funding. USA EPA.
- USA Environmental Protection Agency. (2026, June). Trump EPA Announces New Superfund Cleanup Initiative to Prioritize Faster Remediation and Reuse. USA EPA.
- United Nations Environment Programme. (2026, March). Western Balkans Regional Soil Pollution Conference. United Nations Environment Programme.
This bibliography is provided for reader reference and uses primary government sources, standards-body references, official trade bodies, and company sources.
This Report Answers
- What are the estimated market values for soil contaminant degraders in 2026 and 2036 under the FMI forecast?
- What CAGR is projected for the soil contaminant degraders market across the full 2026 to 2036 forecast period?
- How is the market segmented by Product Type and Source alongside Crop Type and Application?
- Which contaminant profiles and field conditions are expected to support adoption of biological degradation products?
- How are country-level growth rates expected to differ across the profiled markets and their remediation systems?
- Which technical and service dimensions are expected to shape competition among remediation providers serving soil treatment projects?
- How does FMI validate market size and forecast assumptions for this soil contaminant degradation market assessment?
- What should procurement teams evaluate before approving a soil contaminant degrader supplier for recurring field applications?
- How do remediation guidance and verification requirements affect product selection during contaminated-site treatment and agricultural residue management?
Frequently Asked Questions
What is driving growth in the Soil Contaminant Degraders Market?
Growth is expected to come from contaminated-site cleanup programs and greater scrutiny of soil residue risks. Adoption depends on whether a degrader matches the contaminant profile and performs under the site's actual moisture and chemistry conditions.
Who are the key players in the Soil Contaminant Degraders Market?
REGENESIS, Carus, Evonik Active Oxygens, Redox Tech, BBA Ecotech, GreenSoil Group, IndoGulf BioAg, and Infinita Biotech are profiled participants. Competition centers on contaminant coverage and field support alongside treatment verification for repeat project work.
What is a significant restraint in the Soil Contaminant Degraders Market?
Biological performance declines when soil chemistry and temperature move outside the treatment window defined during site testing. Project teams need site testing and monitoring evidence before they expand a treatment from pilot work to full application.
Why should executives track the Soil Contaminant Degraders Market?
The market affects cleanup cost and land-reuse timing when biological treatment reduces the need for removal or disposal. Executives should track supplier capability because weak field support delays verification and extends project schedules.
What business problem does the Soil Contaminant Degraders Market address?
The market addresses contaminants that must be degraded or detoxified within soil before safe reuse or continued agricultural production. Products are used to support biological treatment where site conditions permit an active degradation pathway.
What should procurement leaders evaluate before selecting suppliers?
Procurement leaders should review contaminant coverage and dosing guidance alongside storage stability and field application support. They should examine how suppliers support monitoring because treatment adjustments often depend on measured site response.
What limits return on investment for purchasers?
Returns weaken when a degrader is selected without enough site testing or when biological activity falls after initial treatment. Additional dosing and longer monitoring periods often delay closure even when the product is technically suitable.
How do suppliers build long-term account confidence?
Suppliers build confidence by linking contaminant-specific evidence with clear dosing plans and responsive field support. Repeat purchasing is expected to improve when monitoring records show consistent treatment progress and the supplier helps resolve site variability.
Preview the report firsthand - request a free sample
Get SampleGet the brochure for pricing and purchase details.
Get PDFTable of Content
- Key Takeaways
- Market Size and CAGR
- Top Growth Driver
- Fastest Growing Segment
- Leading Region
- Key Companies
- Emerging Opportunities
- Executive Summary
- Global Market Outlook
- Demand-side Trends
- Supply-side Trends
- Technology Roadmap Analysis
- Analysis and Recommendations
- Analyst Perspective (What is happening? Why now? What should investors know?)
- Key Questions Answered
- How large is the market?
- What is the CAGR?
- What are key trends?
- Which region dominates?
- Who are the leaders?
- Market Overview
- Market Coverage / Taxonomy
- Market Definition / Scope / Limitations
- Research Methodology
- Chapter Orientation
- Analytical Lens and Working Hypotheses
- Market Structure, Signals, and Trend Drivers
- Benchmarking and Cross-market Comparability
- Market Sizing, Forecasting, and Opportunity Mapping
- Research Design and Evidence Framework
- Desk Research Programme (Secondary Evidence)
- Expert Input and Fieldwork (Primary Evidence)
- Tooling, Models, and Reference Databases
- Data Engineering and Model Build
- Quality Assurance and Audit Trail
- Market Background
- Market Dynamics (Drivers, Restraints, Opportunity, Trends)
- Scenario Forecast (Optimistic, Likely, Conservative)
- Impact Analysis
- AI Impact
- Sustainability Impact
- Regulatory Impact
- Technology Impact
- Consumer / Buyer Analysis
- Purchase Drivers
- Adoption Barriers
- Buyer Journey
- Opportunity Map Analysis
- Product Life Cycle Analysis
- Supply Chain Analysis
- Investment Feasibility Matrix
- Value Chain Analysis
- PESTLE and Porter's Analysis
- Regulatory Landscape
- Regional Parent Market Outlook
- Production and Consumption Statistics
- Import and Export Statistics
- Global Market Analysis and Forecast, 2021 to 2036
- Historical Market Size Value (USD Million) Analysis, 2021 to 2025
- Current and Future Market Size Value (USD Million) Projections, 2026 to 2036
- Y-o-Y Growth Trend Analysis
- Absolute $ Opportunity Analysis
- Global Market Pricing Analysis, 2021 to 2036
- Global Market Analysis and Forecast, By Product Type, 2021 to 2036
- Introduction / Key Findings
- Historical Market Size Value (USD Million) Analysis By Product Type, 2021 to 2025
- Current and Future Market Size Value (USD Million) Analysis and Forecast By Product Type, 2026 to 2036
- Premix
- Liquid
- Granular
- Powder
- Encapsulated
- Water-dispersible
- Premix
- Y-o-Y Growth Trend Analysis By Product Type, 2021 to 2025
- Absolute $ Opportunity Analysis By Product Type, 2026 to 2036
- Global Market Analysis and Forecast, By Source, 2021 to 2036
- Introduction / Key Findings
- Historical Market Size Value (USD Million) Analysis By Source, 2021 to 2025
- Current and Future Market Size Value (USD Million) Analysis and Forecast By Source, 2026 to 2036
- Microbial
- Plant-based
- Enzymatic
- Mineral
- Biochemical
- Microbial
- Y-o-Y Growth Trend Analysis By Source, 2021 to 2025
- Absolute $ Opportunity Analysis By Source, 2026 to 2036
- Global Market Analysis and Forecast, By Crop Type, 2021 to 2036
- Introduction / Key Findings
- Historical Market Size Value (USD Million) Analysis By Crop Type, 2021 to 2025
- Current and Future Market Size Value (USD Million) Analysis and Forecast By Crop Type, 2026 to 2036
- Cereals & grains
- Oilseeds & pulses
- Fruits & vegetables
- Turf & ornamentals
- Plantation crops
- Cereals & grains
- Y-o-Y Growth Trend Analysis By Crop Type, 2021 to 2025
- Absolute $ Opportunity Analysis By Crop Type, 2026 to 2036
- Global Market Analysis and Forecast, By Application, 2021 to 2036
- Introduction / Key Findings
- Historical Market Size Value (USD Million) Analysis By Application, 2021 to 2025
- Current and Future Market Size Value (USD Million) Analysis and Forecast By Application, 2026 to 2036
- Soil treatment
- Foliar
- Seed treatment
- Crop protection
- Compost & residue
- Soil treatment
- Y-o-Y Growth Trend Analysis By Application, 2021 to 2025
- Absolute $ Opportunity Analysis By Application, 2026 to 2036
- Global Market Analysis and Forecast, By Region, 2021 to 2036
- Introduction
- Historical Market Size Value (USD Million) Analysis By Region, 2021 to 2025
- Current Market Size Value (USD Million) Analysis and Forecast By Region, 2026 to 2036
- North America
- Latin America
- Western Europe
- Eastern Europe
- East Asia
- South Asia and Pacific
- Middle East & Africa
- Market Attractiveness Analysis By Region
- North America Market Analysis and Forecast, By Country, 2021 to 2036
- Historical Market Size Value (USD Million) Trend Analysis By Market Taxonomy, 2021 to 2025
- Market Size Value (USD Million) Forecast By Market Taxonomy, 2026 to 2036
- By Country
- USA
- Canada
- By Product Type
- By Source
- By Crop Type
- By Application
- By Country
- Market Attractiveness Analysis
- By Country
- By Product Type
- By Source
- By Crop Type
- By Application
- Key Takeaways
- Latin America Market Analysis and Forecast, By Country
- Historical Market Size Value (USD Million) Trend Analysis By Market Taxonomy, 2021 to 2025
- Market Size Value (USD Million) Forecast By Market Taxonomy, 2026 to 2036
- By Country
- Brazil
- Mexico
- Chile
- Rest of Latin America
- By Product Type
- By Source
- By Crop Type
- By Application
- By Country
- Market Attractiveness Analysis
- By Country
- By Product Type
- By Source
- By Crop Type
- By Application
- Key Takeaways
- Western Europe Market Analysis and Forecast, By Country
- Historical Market Size Value (USD Million) Trend Analysis By Market Taxonomy, 2021 to 2025
- Market Size Value (USD Million) Forecast By Market Taxonomy, 2026 to 2036
- By Country
- Germany
- UK
- Italy
- Spain
- France
- Nordic
- BENELUX
- Rest of Western Europe
- By Product Type
- By Source
- By Crop Type
- By Application
- By Country
- Market Attractiveness Analysis
- By Country
- By Product Type
- By Source
- By Crop Type
- By Application
- Key Takeaways
- Eastern Europe Market Analysis and Forecast, By Country
- Historical Market Size Value (USD Million) Trend Analysis By Market Taxonomy, 2021 to 2025
- Market Size Value (USD Million) Forecast By Market Taxonomy, 2026 to 2036
- By Country
- Russia
- Poland
- Hungary
- Balkan & Baltic
- Rest of Eastern Europe
- By Product Type
- By Source
- By Crop Type
- By Application
- By Country
- Market Attractiveness Analysis
- By Country
- By Product Type
- By Source
- By Crop Type
- By Application
- Key Takeaways
- East Asia Market Analysis and Forecast, By Country
- Historical Market Size Value (USD Million) Trend Analysis By Market Taxonomy, 2021 to 2025
- Market Size Value (USD Million) Forecast By Market Taxonomy, 2026 to 2036
- By Country
- China
- Japan
- South Korea
- By Product Type
- By Source
- By Crop Type
- By Application
- By Country
- Market Attractiveness Analysis
- By Country
- By Product Type
- By Source
- By Crop Type
- By Application
- Key Takeaways
- South Asia and Pacific Market Analysis and Forecast, By Country
- Historical Market Size Value (USD Million) Trend Analysis By Market Taxonomy, 2021 to 2025
- Market Size Value (USD Million) Forecast By Market Taxonomy, 2026 to 2036
- By Country
- India
- ASEAN
- Australia & New Zealand
- Rest of South Asia and Pacific
- By Product Type
- By Source
- By Crop Type
- By Application
- By Country
- Market Attractiveness Analysis
- By Country
- By Product Type
- By Source
- By Crop Type
- By Application
- Key Takeaways
- Middle East & Africa Market Analysis and Forecast, By Country
- Historical Market Size Value (USD Million) Trend Analysis By Market Taxonomy, 2021 to 2025
- Market Size Value (USD Million) Forecast By Market Taxonomy, 2026 to 2036
- By Country
- Kingdom of Saudi Arabia
- Other GCC Countries
- Türkiye
- South Africa
- Other African Union
- Rest of Middle East & Africa
- By Product Type
- By Source
- By Crop Type
- By Application
- By Country
- Market Attractiveness Analysis
- By Country
- By Product Type
- By Source
- By Crop Type
- By Application
- Key Takeaways
- Key Countries Market Analysis
- USA
- Pricing Analysis
- Market Share Analysis, 2025
- By Product Type
- By Source
- By Crop Type
- By Application
- Canada
- Pricing Analysis
- Market Share Analysis, 2025
- By Product Type
- By Source
- By Crop Type
- By Application
- Mexico
- Pricing Analysis
- Market Share Analysis, 2025
- By Product Type
- By Source
- By Crop Type
- By Application
- Brazil
- Pricing Analysis
- Market Share Analysis, 2025
- By Product Type
- By Source
- By Crop Type
- By Application
- Chile
- Pricing Analysis
- Market Share Analysis, 2025
- By Product Type
- By Source
- By Crop Type
- By Application
- Germany
- Pricing Analysis
- Market Share Analysis, 2025
- By Product Type
- By Source
- By Crop Type
- By Application
- UK
- Pricing Analysis
- Market Share Analysis, 2025
- By Product Type
- By Source
- By Crop Type
- By Application
- Italy
- Pricing Analysis
- Market Share Analysis, 2025
- By Product Type
- By Source
- By Crop Type
- By Application
- Spain
- Pricing Analysis
- Market Share Analysis, 2025
- By Product Type
- By Source
- By Crop Type
- By Application
- France
- Pricing Analysis
- Market Share Analysis, 2025
- By Product Type
- By Source
- By Crop Type
- By Application
- India
- Pricing Analysis
- Market Share Analysis, 2025
- By Product Type
- By Source
- By Crop Type
- By Application
- ASEAN
- Pricing Analysis
- Market Share Analysis, 2025
- By Product Type
- By Source
- By Crop Type
- By Application
- Australia & New Zealand
- Pricing Analysis
- Market Share Analysis, 2025
- By Product Type
- By Source
- By Crop Type
- By Application
- China
- Pricing Analysis
- Market Share Analysis, 2025
- By Product Type
- By Source
- By Crop Type
- By Application
- Japan
- Pricing Analysis
- Market Share Analysis, 2025
- By Product Type
- By Source
- By Crop Type
- By Application
- South Korea
- Pricing Analysis
- Market Share Analysis, 2025
- By Product Type
- By Source
- By Crop Type
- By Application
- Russia
- Pricing Analysis
- Market Share Analysis, 2025
- By Product Type
- By Source
- By Crop Type
- By Application
- Poland
- Pricing Analysis
- Market Share Analysis, 2025
- By Product Type
- By Source
- By Crop Type
- By Application
- Hungary
- Pricing Analysis
- Market Share Analysis, 2025
- By Product Type
- By Source
- By Crop Type
- By Application
- Kingdom of Saudi Arabia
- Pricing Analysis
- Market Share Analysis, 2025
- By Product Type
- By Source
- By Crop Type
- By Application
- Türkiye
- Pricing Analysis
- Market Share Analysis, 2025
- By Product Type
- By Source
- By Crop Type
- By Application
- South Africa
- Pricing Analysis
- Market Share Analysis, 2025
- By Product Type
- By Source
- By Crop Type
- By Application
- USA
- Market Structure Analysis
- Competition Dashboard
- Competition Benchmarking
- Market Share Analysis of Top Players
- By Regional
- By Product Type
- By Source
- By Crop Type
- By Application
- Emerging Startups
- Innovation Benchmarking
- Competition Analysis
- Competition Deep Dive
- REGENESIS
- Overview
- Product Portfolio
- Profitability by Market Segments
- Sales Footprint
- Strategy Overview
- Marketing Strategy
- Product Strategy
- Channel Strategy
- Carus
- Evonik Active Oxygens
- Redox Tech
- BBA Ecotech
- GreenSoil Group
- IndoGulf BioAg
- Infinita Biotech
- REGENESIS
- Case Studies
- Success Stories
- Recent Developments
- Competition Deep Dive
- Assumptions & Acronyms Used


