

- Market Size (2026)
- USD 1460.7 Mn
- Forecast (2036)
- USD 3364.0 Mn
- CAGR (2026 to 2036)
- 8.7%
How big is the Specialty Gas Panel Market?
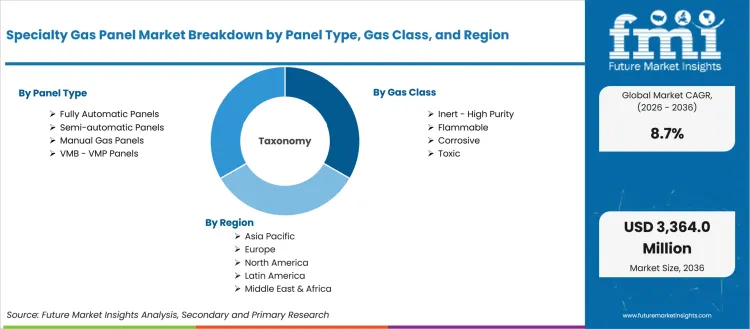
The Specialty Gas Panel Market is projected to grow from USD 1,460.7 million in 2026 to USD 3,364.0 million by 2036, at a CAGR of 8.7%.
The Specialty Gas Panel Market was valued at USD 1,343.79 million in 2025. The market is expected to reach USD 1,460.7 million in 2026 and USD 3,364.0 million by 2036. Demand is projected to expand at a CAGR of 8.7% from 2026 to 2036. Inert / High Purity panels are projected to hold a 34.8% share by gas class in 2026.
In June 2024, Entegris announced proposed CHIPS Act funding of up to USD 75 million for USA semiconductor manufacturing products. This supports domestic materials and gas handling supply resilience. In June 2024, the USA Department of Commerce announced preliminary terms with Entegris to support Colorado Springs manufacturing. This improves USA sourcing depth for fab suppliers.
That matters for gas panels since every new deposition, etch, implant, and cleaning bay needs controlled gas routing before a process tool can run.
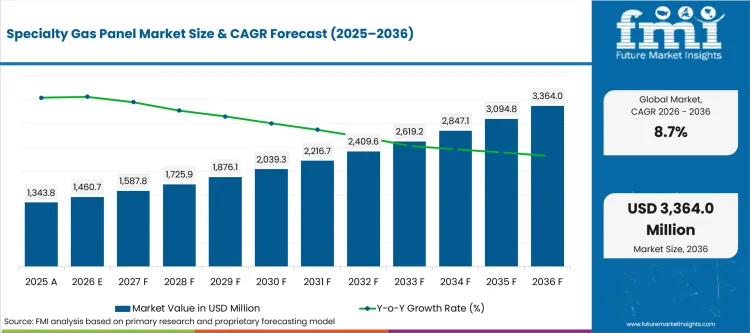
| Metric | Value |
|---|---|
| 2025 Market Size | USD 1,343.79 million |
| 2026 Market Size | USD 1,460.7 million |
| 2036 Market Size | USD 3,364.0 million |
| Forecast CAGR (2026-2036) | 8.7% |
| Leading Panel Type | Fully Automatic Panels |
| Fully Automatic Panels Share (2026) | 42.6% |
| Leading Gas Class | Inert / High Purity |
| Inert / High Purity Share (2026) | 34.8% |
| Fastest-growing Country | India |
| India CAGR by 2036 | 10.4% |
Summary of the Specialty Gas Panel Market
| Market Signal | Commercial Impact |
|---|---|
| Demand and Growth Drivers | Demand for specialty gas panels is increasing as semiconductor manufacturers require high-purity, automated gas delivery systems that improve process reliability, operator safety, and cleanroom efficiency.
|
| Product and Segment View | Fully automatic gas panels, inert/high-purity gas systems, and semiconductor fabrication applications continue to represent the leading commercial opportunities across the market.
|
| Geography and Growth Outlook | Asia and North America continue to drive market expansion through semiconductor capacity additions, fab modernization, and domestic manufacturing investments.
|
| Competitive Landscape | Competition increasingly focuses on gas purity, automation capability, documentation quality, and semiconductor process integration.
|
| Analyst Perspective | Specialty gas panels are evolving from supporting utility equipment into critical process infrastructure for semiconductor manufacturing, where purity, automation, and documentation directly influence production readiness.
- Sudip Saha, Principal Consultant at Future Market Insights |
Why is the Specialty Gas Panel Market growing?
Advanced fabs need more gas lines per tool as deposition and etch recipes use more specialty gases. Automatic panels cut operator exposure during cylinder changeover and improve purge repeatability.
- Advanced fabs need more gas lines per tool as deposition and etch recipes use more specialty gases.
- Automatic panels cut operator exposure during cylinder changeover and improve purge repeatability.
- VMB / VMP Panels reduce duplicated source cabinets when one gas line feeds several process tools.
Fab expansion is the notable demand trigger for specialty gas panels. SEMI reported in March 2025 that front-end fab equipment spending was expected to reach USD 110 billion in 2025 and rise to USD 130 billion in 2026. This means panel suppliers enter projects early through facility gas distribution and later through tool hook-up packages. Buyers do not treat panels as simple hardware in these projects. They ask for leak testing, purge recipes, materials compatibility, and documentation that can pass site acceptance. That shifts demand toward suppliers with clean fabrication and field commissioning skills. The second growth driver is the move from manual gas routing toward automated safety control.
How is the Specialty Gas Panel Market segmented?
The Specialty Gas Panel Market is segmented by panel type, gas class, application, pressure range, sales channel, and region.
- Fully Automatic Panels are projected to account for 42.6% of the panel-type category in 2026 as fabs reduce manual gas handling.
- With an estimated 34.8% share in 2026, Inert / High Purity panels are expected to lead the gas-class category due to broad purge use.
- Semiconductor Fabs are anticipated to represent 68.2% of the application category in 2026 with tool gas routing as the main use.
How does Fully Automatic Panels contribute to the panel type category?
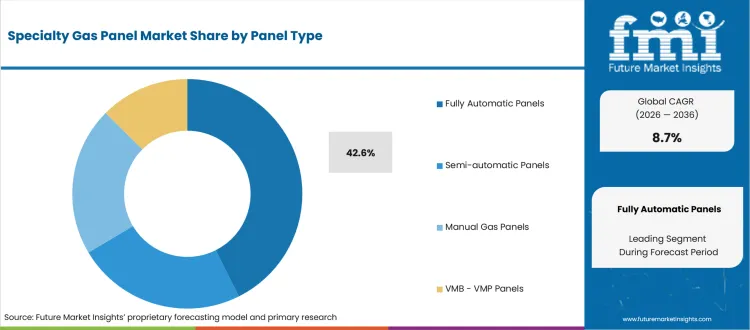
- Fully Automatic Panels are projected to account for a 42.6% share in 2026 as fabs prefer controlled purge cycles and emergency shutdown links over operator-dependent valve sequences.
- Buyers compare automatic panels by programmable logic controller depth and sensor redundancy. The price premium is accepted when the panel reduces tool downtime during gas bottle changes.
What supports demand for Inert / High Purity?
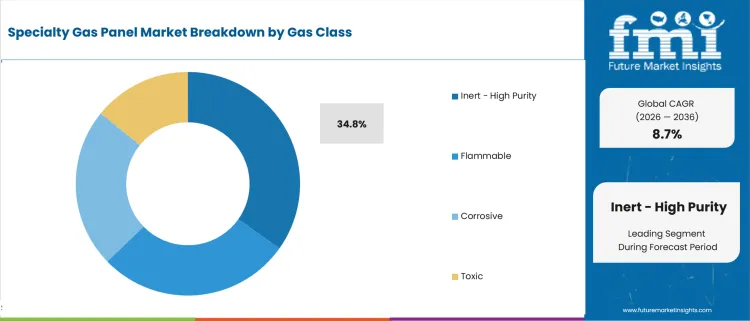
- Inert / High Purity panels are expected to hold a 34.8% share in 2026 since nitrogen, argon, helium, and carrier gases support many fab recipes.
- The main buying issue is contamination control. Electropolished tubing, metal seals, and validated cleaning matter more for high-purity silane gases and carrier gas service.
How do buyers evaluate Semiconductor Fabs within the application category?
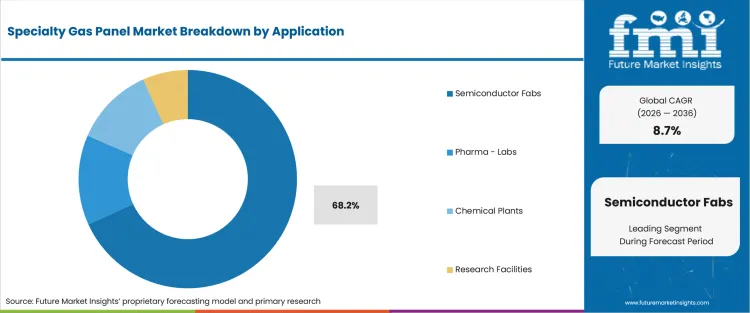
- Semiconductor Fabs are anticipated to represent a 68.2% share in 2026 as gas panels sit between facility supply and process chambers.
- Fab buyers often qualify panel suppliers before tool hook-up. Approved vendor status can matter more than unit price when production timing is tight.
What market factors influence demand for Medium Pressure?
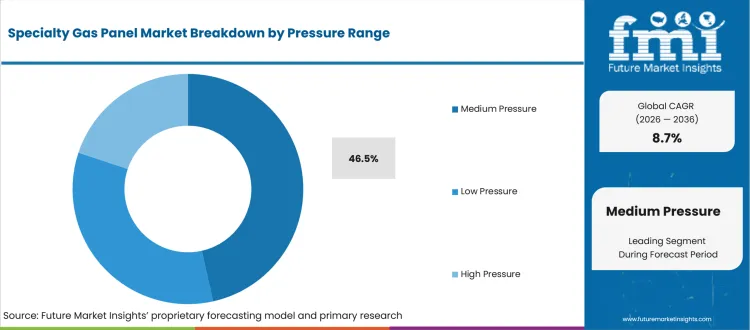
- Medium Pressure systems are forecast to hold a 46.5% share in 2026 since they fit most specialty gas distribution and point-of-use needs.
- High pressure panels stay more limited due to added regulator cost and safety review. Low pressure panels serve labs and selected process gases.
How does Direct OEM affect the sales channel outlook?
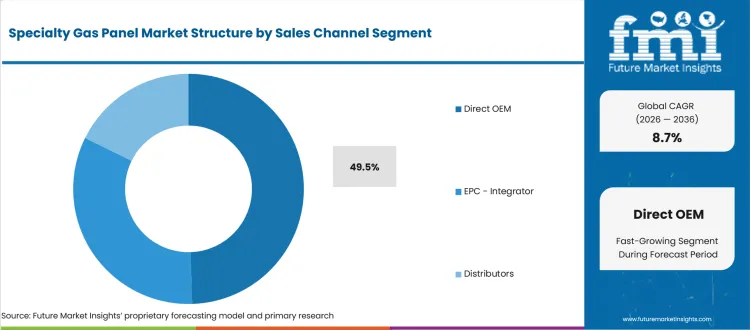
- Direct OEM sales are expected to capture 49.5% share in 2026 as major fabs prefer panel packages tied to tool qualification.
- EPC / Integrator channels gain share during greenfield construction. Distributors remain useful for lab panels and replacement gas sticks.
What drives and restrains the market?
Driver: advanced node fabs require more gas sticks per bay as etch and deposition steps increase; restraint: long qualification cycles slow supplier switching for fabs with approved vendor lists; opportunity: regional fab buildouts create demand for local orbital welding and panel commissioning partners.
The market reflects a balance between the identified demand driver, adoption constraints, and the supplier opportunity outlined below.
- Driver: advanced node fabs require more gas sticks per bay as etch and deposition steps increase.
- Restraint: long qualification cycles slow supplier switching for fabs with approved vendor lists.
- Opportunity: regional fab buildouts create demand for local orbital welding and panel commissioning partners.
Fab Gas Point Density: The market expands when each fab tool needs more specialty gas connections. Advanced node processes use more deposition and etch steps, and each step can add a separate gas pathway. SEMI reported in October 2025 that 300mm fab equipment spending was expected to total USD 374 billion from 2026 to 2028. That scale turns gas panel buying into a repeatable facility package instead of a one-off purchase. Suppliers with standard panel platforms can shorten engineering cycles for new bays. The implication is clear for CEOs.
Purge Safety Compliance: Safety rules shape purchasing in this market since hazardous gases are handled close to operators and process tools. OSHA lists SEMI S2 and gas piping standards among semiconductor safety references. This matters because buyers expect documentation for gas isolation, leak control, and exhaust handling before site acceptance. The market opportunity is notable for panels that pair hardware with proof. Suppliers able to provide leak-test records, purge diagrams, and materials certificates lower approval risk for fabs. This also supports demand for adjacent gas generating systems where facility teams want cleaner utility integration.
Which factors support expansion?
Commercial expansion is reinforced by the value, workflow, and recurring-demand factors below.
- Fab construction cycles are extending panel order visibility since gas panels are bought before process tools enter final hook-up.
- Automatic changeover panels raise average selling prices as buyers pay for sensors, interlocks, and purge validation.
- VMB / VMP Panels support multi-tool distribution and reduce duplicated source cabinets in larger cleanroom layouts.
Which country markets are included in the CAGR comparison?
The selected CAGR comparison covers India (10.4%), China (9.2%), South Korea (9.0%), United States (8.9%), and Germany (8.4%) through 2036.
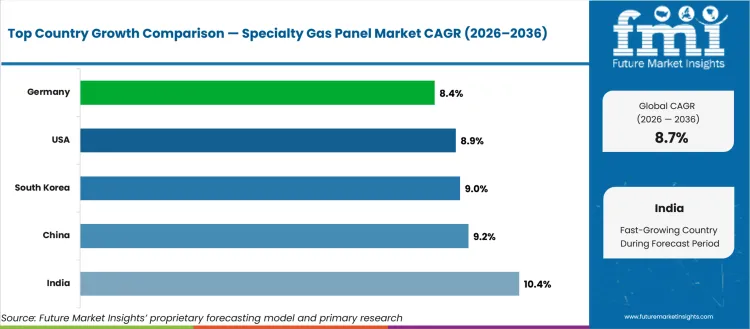
| Country | CAGR |
|---|---|
| India | 10.4% |
| China | 9.2% |
| South Korea | 9.0% |
| United States | 8.9% |
| Germany | 8.4% |
Source: Future Market Insights analysis.
How do country-level CAGRs compare?
- India (CAGR: 10.4%): India approved a Dholera fab with INR 91,000 crore investment and 50,000 WSPM capacity.
- China (CAGR: 9.2%): SEMI expects China fab equipment spending at USD 36 billion in 2026.
- South Korea (CAGR: 9.0%): SEMI forecast Korean fab investment at USD 27 billion in 2026.
- United States (CAGR: 8.9%): CHIPS for America includes USD 39 billion for facility and equipment incentives.
- Germany (CAGR: 8.4%): Infineon is investing over EUR 5 billion at its Dresden site.
The global Specialty Gas Panel Market is forecast to record a CAGR of 8.7% from 2026 to 2036. The study covers 30+ countries across the report regions.
How is the Specialty Gas Panel Market developing in India?
India is projected to record a CAGR of 10.4% through 2036. The country outlook identifies this demand signal: India approved a Dholera fab with INR 91,000 crore investment and 50,000 WSPM capacity.
Country Market Snapshot
| Country | India |
|---|---|
| Forecast CAGR | 10.4% |
| Demand anchor | India approved a Dholera fab with INR 91,000 crore investment and 50,000 WSPM capacity. |
| Policy context | The India Semiconductor Mission has a INR 76,000 crore outlay. |
| Buyer route | Early demand flows through EPC firms, OSAT projects, and fab utility planning. |
| Supply structure | Cleantech Services lists VMB / VMP systems for gas distribution. |
| Application mix | Fab, ATMP, compound semiconductor, and research sites drive initial orders. |
| Restraint | Local high-purity fabrication skills are still developing at semiconductor scale. |
| Company context | Companies active in or serving this market include Entegris, Ichor Systems, Swagelok India, Fujikin, and CKD India. |
Market Outlook
India is projected to record a CAGR of 10.4% through 2036 as approved projects move into facility execution. India’s Press Information Bureau reported in February 2024 that the Dholera semiconductor fab includes INR 91,000 crore investment and 50,000 wafer starts per month capacity. That creates demand for specialty gas panels during utility design, tool hook-up, and process qualification. Early orders are likely to come through EPC and integrator routes.
Key Growth Drivers
- Approved fab and ATMP projects create new demand for specialty gas distribution systems.
- Gujarat and Assam semiconductor sites are building a new buyer ecosystem for gas infrastructure.
- Local VMB suppliers can gain share in lower-risk lines and lab applications.
- India approved a Dholera fab with INR 91,000 crore investment and 50,000 WSPM capacity.
Key Restraints
- High-purity welding and validation skills are limited compared with mature fab countries.
- Project delays can push panel orders into later construction phases.
- Local high-purity fabrication skills are still developing at semiconductor scale.
Country Market FAQs
What should C-suite teams prioritize in India?
C-suite teams should prioritize qualification requirements, procurement routes, local service coverage, and implementation economics before committing capital or supplier volume.
How should suppliers approach the India market?
Suppliers should align technical evidence, local channel support, and account-specific commercial terms with the buying process used by major customers in India.
What can weaken the business case in India?
Local high-purity fabrication skills are still developing at semiconductor scale. Executives should test this exposure during supplier, investment, and rollout reviews.
How is the Specialty Gas Panel Market developing in China?
China is projected to record a CAGR of 9.2% through 2036. The country outlook identifies this demand signal: SEMI expects China fab equipment spending at USD 36 billion in 2026.
Country Market Snapshot
| Country | China |
|---|---|
| Forecast CAGR | 9.2% |
| Demand anchor | SEMI expects China fab equipment spending at USD 36 billion in 2026. |
| Application mix | Mature-node fabs, memory lines, and specialty device plants support gas panel demand. |
| Policy context | Local sourcing goals raise interest in domestic gas distribution suppliers. |
| Supply signal | Hankoom and Vigour list VMB or specialty gas distribution products for semiconductor use. |
| Buyer route | Domestic fabs often combine EPC sourcing with local supplier qualification. |
| Restraint | Export controls can affect advanced tool timing and associated panel packages. |
| Company context | Companies active in or serving this market include Entegris, Ichor Systems, Fujikin, CKD, and Toyoko Kagaku. |
Market Outlook
China is forecast to grow at a CAGR of 9.2% through 2036 with a large regional demand pool among the selected countries. SEMI reported in March 2025 that China’s semiconductor equipment spending was projected at USD 38 billion in 2025 and USD 36 billion in 2026. That scale supports demand for manual, semi-automatic, automatic, and VMB / VMP panels. Orders are spread across mature-node capacity and strategic domestic projects. Chinese buyers are increasingly balancing price, domestic availability, and technical qualification.
Key Growth Drivers
- Mature-node capacity additions keep gas panel volumes high despite tool export limits.
- Domestic supplier qualification supports local VMB and semi-automatic panel orders.
- High fab construction activity creates EPC-led procurement routes for gas distribution packages.
- SEMI expects China fab equipment spending at USD 36 billion in 2026.
Key Restraints
- Advanced-node restrictions can delay some high-end tool and panel packages.
- Local price pressure can reduce margins for standard manual and semi-automatic panels.
- Export controls can affect advanced tool timing and associated panel packages.
Country Market FAQs
What should C-suite teams prioritize in China?
C-suite teams should prioritize qualification requirements, procurement routes, local service coverage, and implementation economics before committing capital or supplier volume.
How should suppliers approach the China market?
Suppliers should align technical evidence, local channel support, and account-specific commercial terms with the buying process used by major customers in China.
What can weaken the business case in China?
Export controls can affect advanced tool timing and associated panel packages. Executives should test this exposure during supplier, investment, and rollout reviews.
How is the Specialty Gas Panel Market developing in South Korea?
South Korea is projected to record a CAGR of 9.0% through 2036. The country outlook identifies this demand signal: SEMI forecast Korean fab investment at USD 27 billion in 2026.
Country Market Snapshot
| Country | South Korea |
|---|---|
| Forecast CAGR | 9.0% |
| Demand anchor | SEMI forecast Korean fab investment at USD 27 billion in 2026. |
| Application mix | DRAM, NAND, HBM, and foundry projects support high-flow panel needs. |
| Supply signal | Samhwa Engineering lists gas supply systems and VMB / VMP products. |
| Buyer route | Memory producers use strict qualification tied to uptime and cleanroom safety. |
| Channel signal | Local contractors matter for fast site work around Cheongju and Yongin. |
| Restraint | Demand is concentrated around a few large chipmakers and project cycles. |
| Company context | Companies active in or serving this market include Entegris, Ichor Systems, Fujikin, CKD, and GST. |
Market Outlook
South Korea is expected to record a CAGR of 9.0% through 2036 with memory investment as the main demand anchor. SEMI reported that Korean semiconductor investment was forecast to reach USD 21.5 billion in 2025 and USD 27 billion in 2026. That scale supports automatic panels, high-flow VMB systems, and safety interlocked distribution lines. AI memory demand creates more tool additions and more gas routing points. Korean buyers are demanding and fast-moving.
Key Growth Drivers
- HBM and advanced DRAM upgrades increase demand for high-flow process gas routing.
- Large memory fabs need automatic shutoff and purge systems for uptime protection.
- Local VMB suppliers support fast customization for dense cleanroom layouts.
- SEMI forecast Korean fab investment at USD 27 billion in 2026.
Key Restraints
- Customer concentration can create order volatility when memory capex cycles pause.
- Qualification barriers are high for suppliers without Korean field service coverage.
- Demand is concentrated around a few large chipmakers and project cycles.
Country Market FAQs
What should C-suite teams prioritize in South Korea?
C-suite teams should prioritize qualification requirements, procurement routes, local service coverage, and implementation economics before committing capital or supplier volume.
How should suppliers approach the South Korea market?
Suppliers should align technical evidence, local channel support, and account-specific commercial terms with the buying process used by major customers in South Korea.
What can weaken the business case in South Korea?
Demand is concentrated around a few large chipmakers and project cycles. Executives should test this exposure during supplier, investment, and rollout reviews.
How is the Specialty Gas Panel Market developing in the United States?
The United States is projected to record a CAGR of 8.9% through 2036. The country outlook identifies this demand signal: CHIPS for America includes USD 39 billion for facility and equipment incentives.
Country Market Snapshot
| Country | United States |
|---|---|
| Forecast CAGR | 8.9% |
| Demand anchor | CHIPS for America includes USD 39 billion for facility and equipment incentives. |
| Policy context | NIST states the program includes USD 11 billion for semiconductor R&D. |
| Buyer route | Large fabs buy through tool OEMs, EPC firms, and qualified high-purity contractors. |
| Supply signal | Entegris, Ichor Systems, Swagelok, and Applied Energy Systems have relevant USA operations. |
| Application mix | Logic, memory, and materials fabs need toxic, flammable, and inert gas panels. |
| Restraint | Skilled orbital welding labor can constrain site hook-up schedules in large projects. |
| Company context | Companies active in or serving this market include Entegris, Ichor Systems, Swagelok, Applied Energy Systems, and CVD Equipment Corporation. |
Market Outlook
The United States is projected to record a CAGR of 8.9% through 2036 as domestic fab projects create recurring gas panel packages. NIST states that CHIPS for America includes USD 50 billion across semiconductor manufacturing and R&D. That funding supports panel demand indirectly through fab construction and tool installation. Buyers in Arizona, Ohio, Texas, and New York often require documentation that matches corporate EHS rules. USA demand is less price-led than many smaller markets.
Key Growth Drivers
- Domestic fab incentives are moving cleanroom projects toward equipment hook-up and gas distribution work.
- Strong tool OEM presence supports direct panel qualification before fab installation starts.
- EHS requirements favor automatic panels with purge validation and emergency shutoff outputs.
- CHIPS for America includes USD 39 billion for facility and equipment incentives.
Key Restraints
- Labor shortages in high-purity welding can delay panel installation and field acceptance.
- Export control uncertainty can affect tool schedules and panel release timing for advanced fabs.
- Skilled orbital welding labor can constrain site hook-up schedules in large projects.
Country Market FAQs
What should C-suite teams prioritize in the United States?
C-suite teams should prioritize qualification requirements, procurement routes, local service coverage, and implementation economics before committing capital or supplier volume.
How should suppliers approach the United States market?
Suppliers should align technical evidence, local channel support, and account-specific commercial terms with the buying process used by major customers in the United States.
What can weaken the business case in the United States?
Skilled orbital welding labor can constrain site hook-up schedules in large projects. Executives should test this exposure during supplier, investment, and rollout reviews.
How is the Specialty Gas Panel Market developing in Germany?
Germany is projected to record a CAGR of 8.4% through 2036. The country outlook identifies this demand signal: Infineon is investing over EUR 5 billion at its Dresden site.
Country Market Snapshot
| Country | Germany |
|---|---|
| Forecast CAGR | 8.4% |
| Demand anchor | Infineon is investing over EUR 5 billion at its Dresden site. |
| Policy context | The European Commission approved EUR 920 million in German aid for Infineon in 2025. |
| Cluster signal | Dresden has strong power semiconductor and foundry ecosystem activity. |
| Buyer route | EPC firms and tool hook-up contractors influence panel supplier selection. |
| Supply structure | Exentec and European high-purity fabricators support local gas distribution needs. |
| Restraint | EU documentation and safety review can extend supplier qualification cycles. |
| Company context | Companies active in or serving this market include Dockweiler, Bürkert, Swagelok, Air Liquide, and Linde. |
Market Outlook
Germany is forecast to grow at a CAGR of 8.4% through 2036 as Dresden and other industrial clusters continue semiconductor capacity additions. Infineon stated in May 2025 that its Dresden expansion involves over EUR 5 billion of investment and up to 1,000 new jobs. That creates direct and indirect need for high-purity gas routing across process areas. Panel demand is tied to power semiconductor and mixed-signal capacity rather than only established-edge logic. German buyers expect engineering rigor and local service continuity.
Key Growth Drivers
- Dresden fab investment supports recurring gas distribution and tool hook-up packages.
- Power semiconductor manufacturing needs reliable gas control across 300mm process steps.
- Local engineering standards favor suppliers with detailed technical documentation.
- Infineon is investing over EUR 5 billion at its Dresden site.
Key Restraints
- Supplier approval can be slow when documentation is not aligned with local safety checks.
- High labor costs increase installation sensitivity and reward pre-engineered panel designs.
- EU documentation and safety review can extend supplier qualification cycles.
Country Market FAQs
What should C-suite teams prioritize in Germany?
C-suite teams should prioritize qualification requirements, procurement routes, local service coverage, and implementation economics before committing capital or supplier volume.
How should suppliers approach the Germany market?
Suppliers should align technical evidence, local channel support, and account-specific commercial terms with the buying process used by major customers in Germany.
What can weaken the business case in Germany?
EU documentation and safety review can extend supplier qualification cycles. Executives should test this exposure during supplier, investment, and rollout reviews.
Which companies are discussed in the Specialty Gas Panel Market?
The preview discusses Entegris, Ichor Systems, CKD Corporation, Fujikin, and Swagelok among the companies active in this market.
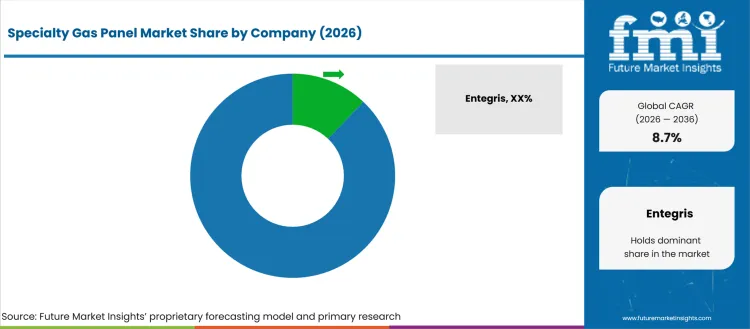
Competition is moderately fragmented since global component firms and specialist panel fabricators serve different buying needs. Established suppliers support on documentation, clean fabrication, and service references for high-risk gas panels. Specialist firms win in VMB / VMP projects when custom layouts and shorter lead times matter.
Entry barriers are high for toxic gas panels due to leak testing, purge design, and site acceptance records. Supplier advantage starts with proof of purity and safety. Entegris lists gas delivery cabinet systems designed for toxic semiconductor applications, and its TX-4 system supports phosphine, arsine, and germane from sub-atmospheric sources.
How is competition structured?
Competition reflects differences in specialization, portfolio scope, geographic reach, evidence, and customer access.
The market includes gas delivery subsystem suppliers, high-purity component firms, and specialist panel fabricators.
- Gas Delivery System Leaders: Entegris, Ichor Systems, CKD Corporation, and Fujikin compete with semiconductor-specific product depth. Their strengths sit in hazardous gas control, integrated gas supply systems, precision valves, and documentation that supports fab qualification.
- High-Purity Panel Specialists: Applied Energy Systems, Swagelok, Toyoko Kagaku, Exentec, and Stainless Design Concepts compete in panel assembly, VMB / VMP packages, clean fabrication, and field service.
- Regional and Custom Fabricators: Critical Systems, High Purity Systems, Cleantech Services, Hankoom, Samhwa Engineering, and Vigour compete through local responsiveness and custom configuration.
How do selected companies compare?
The selected companies differ in portfolio focus, geographic reach, evidence depth, and channel strength.
| Company | Competitive position |
|---|---|
| Entegris | Entegris is assessed for fab qualification, process capability, field service, and regional semiconductor customer support. |
| Ichor Systems | Ichor Systems is assessed for fab qualification, process capability, field service, and regional semiconductor customer support. |
| CKD | CKD is assessed for fab qualification, process capability, field service, and regional semiconductor customer support. |
| Fujikin | Fujikin is assessed for fab qualification, process capability, field service, and regional semiconductor customer support. |
| Swagelok | Swagelok is assessed for fab qualification, process capability, field service, and regional semiconductor customer support. |
What are the key developments in the Specialty Gas Panel Market?
- In June 2024, Entegris announced proposed CHIPS Act funding of up to USD 75.0 million for USA semiconductor manufacturing. The project supports domestic capacity for critical fab materials and subsystems.
- In July 2025, Entegris opened its Korea Technology Center in Ansan. The facility expanded local technical support and process-development capability for Korean semiconductor customers.
- In February 2024, India approved the Tata Electronics semiconductor fab in Dholera with planned capacity of 50,000 wafer starts per month. The project creates demand for specialty-gas distribution panels and valve manifold boxes.
Selected Companies in the Specialty Gas Panel Market
Companies referenced in this preview
- Entegris.
- Ichor Systems.
- CKD.
- Fujikin.
- Swagelok.
- Applied Energy Systems.
- Toyoko Kagaku.
- Dockweiler.
Market Scope & Definition
| Metric | Value |
|---|---|
| Market definition | The Specialty Gas Panel Market covers gas control panels, gas sticks, valve manifold boxes, valve manifold panels, and automatic gas distribution assemblies used to route specialty gases safely. |
| Functions covered | Manual Gas Panels, Semi-automatic Panels, Fully Automatic Panels, VMB / VMP Panels |
| Applications covered | Semiconductor Fabs, Pharma / Labs, Chemical Plants, Research Facilities |
| End-use industries | Semiconductor Fabs, Pharma / Labs, Chemical Plants, Research Facilities |
| Inclusions | Market scope includes manual panels, semi-automatic panels, fully automatic panels, VMB / VMP Panels, toxic gas panels, flammable gas panels, corrosive gas panels, inert / high purity panels, low pressure systems, medium pressure systems, high pressure systems, direct OEM sales, EPC / Integrator sales, distributor sales, and the selected country coverage from 2026 to 2036. |
| Exclusions | Market scope excludes bulk gas plants, cylinder manufacturing, onsite gas generation skids, process chambers, gas abatement units, vacuum pumps, standalone mass flow controllers, gas analyzers, and general industrial pipework sold without specialty gas panel assemblies. |
Research Methodology
| Metric | Value |
|---|---|
| Primary Research | FMI analysts reviewed buying inputs from semiconductor facility engineers, high-purity piping contractors, lab gas managers, EPC firms, and tool OEM sourcing teams. Interviews focused on panel type selection, documentation needs, safety acceptance, and service response. |
| Desk Research | used fab investment indicators, standards references, company product literature, and official semiconductor policy documents. The study reviewed high purity process systems and adjacent gas infrastructure categories to separate panel revenue from broader facility spending. |
| Market Sizing and Forecasting | The model combined facility count, gas point density, average panel pricing, panel automation mix, and regional fab investment. The forecast used the locked 2025, 2026, 2036, and CAGR values as the market anchors. |
| Data Validation | Forecasts were checked against semiconductor equipment spending, specialty gas usage patterns, company product portfolios, and country-level fab investment signals. Panel-level estimates were cross-checked with adjacent gas delivery systems and high-purity process categories. |
What does the report cover?
The report covers panel type, gas class, application, pressure range, sales channel, and region across the 2026-2036 forecast period in 30+ countries.
| Metric | Value |
|---|---|
| Periods | Base year 2025; estimated year 2026; forecast period 2026-2036 |
| Segment axes | panel type, gas class, application, pressure range, sales channel, and region |
| Regions | North America, Europe, East Asia, South Asia and Pacific, Middle East and Africa, and Latin America |
| Countries | United States, United Kingdom, Germany, France, Japan, China, South Korea, India and 30+ countries |
| Companies | Entegris, Ichor Systems, CKD, Fujikin, Swagelok, Applied Energy Systems, Toyoko Kagaku, Dockweiler, and others |
| Approach | Hybrid bottom-up and top-down methodology using fab investment signals, panel automation mix, application use rates, and country-level qualification behavior. |
Market Segmentation Analysis
Segmented by Panel Type
- Manual Gas Panels.
- Semi-automatic Panels.
- Fully Automatic Panels.
- VMB / VMP Panels.
Segmented by Gas Class
- Toxic.
- Flammable.
- Corrosive.
- Inert / High Purity.
Segmented by Application
- Semiconductor Fabs.
- Pharma / Labs.
- Chemical Plants.
- Research Facilities.
Segmented by Pressure Range
- Low Pressure.
- Medium Pressure.
- High Pressure.
Segmented by Sales Channel
- Direct OEM.
- EPC / Integrator.
- Distributors.
By Region
- North America.
- United States.
- Western Europe.
- Germany.
- France.
- United Kingdom.
- East Asia.
- China.
- Japan.
- South Korea.
- South Asia and Pacific.
- India.
Research Sources and Bibliography
- 1. SEMI. (2026, April 1). SEMI projects double-digit growth in global 300mm fab equipment spending for 2026 and 2027. SEMI.
- 2. SEMI. (2025, October 8). SEMI reports global 300mm fab equipment spending expected to total $374 billion over next three years. SEMI.
- 3. SEMI. (2025, March 25). Global fab equipment investment expected to reach $110 billion in 2025. SEMI.
- 4. National Institute of Standards and Technology. (2026, June). CHIPS for America. NIST.
- 5. UK Department for Science, Innovation and Technology. (2023, May 19). National semiconductor strategy. GOV.UK.
- 6. European Investment Bank. (2024). Project Liberty semiconductor fab. EIB.
- 7. Japan External Trade Organization. (2025). Semiconductors and microelectronics attractive markets. JETRO.
- 8. Press Information Bureau of India. (2024, February 29). Cabinet approves three more semiconductor units. Government of India.
- 9. SEMI. (2026). SEMI standards safety. SEMI.
- 10. Occupational Safety and Health Administration. (2024). Semiconductors: Standards. OSHA.
- 11. Entegris. (2024, June 26). Entegris and Biden Administration announce up to $75 million in proposed direct funding under CHIPS Act. Entegris Investor Relations.
- 12. Entegris. (2025, July 18). Entegris opens new Korea Technology Center. Entegris.
- 13. CKD Corporation. (2026). Integrated gas supply system. CKD Corporation.
- 14. Applied Energy Systems. (2026). Applied Energy Systems company profile. SEMI Member Directory.
- 15. Toyoko Kagaku. (2026). Valve manifold box/panel. Toyoko Kagaku.
- 16. Swagelok. (2026). Gas distribution systems and gas panels. Swagelok.
The bibliography is provided for reader reference and uses primary non-commercial government, regulatory, official trade body, and official company publications.
This Report Answers
- What is the projected value of the Specialty Gas Panel Market in 2026?
- What value is forecast for the Specialty Gas Panel Market by 2036?
- What CAGR is forecast for the Specialty Gas Panel Market from 2026 to 2036?
- What 2026 share is projected for Fully Automatic Panels within the panel type category?
- What 2026 share is projected for Inert / High Purity within the gas class category?
- Which demand factors support the Specialty Gas Panel Market outlook?
- Which restraints and opportunities affect adoption in the Specialty Gas Panel Market?
- How are country CAGR outlooks, including India at 10.4%, compared?
- Which companies and product developments are covered in the competitive analysis?
- What is included in the market scope, and how is the forecast validated?
Frequently Asked Questions
Why should executives track the Specialty Gas Panel Market?
Executives should track this market because it can affect capital allocation, supplier strategy, operating risk, and competitive positioning across commercial planning cycles.
What business problem does the Specialty Gas Panel Market address?
It helps executive teams judge where customer pain, supplier capability, compliance exposure, and implementation economics justify investment, procurement, or portfolio action.
What should procurement leaders evaluate before selecting suppliers?
Procurement leaders should assess evidence quality, integration fit, service coverage, compliance readiness, total cost of ownership, and supplier execution capability.
What can limit return on investment for buyers?
Return on investment can be limited by low utilization, integration delays, training gaps, unclear ownership, pricing pressure, or weak fit with existing workflows.
How can suppliers build executive confidence?
Suppliers can build confidence by proving implementation speed, risk reduction, support depth, reference use cases, and measurable outcomes for budget owners.
Preview the report firsthand - request a free sample
Get SampleGet the brochure for pricing and purchase details.
Get PDFTable of Content
- Key Takeaways
- Market Size and CAGR
- Top Growth Driver
- Fastest Growing Segment
- Leading Region
- Key Companies
- Emerging Opportunities
- Executive Summary
- Global Market Outlook
- Demand-side Trends
- Supply-side Trends
- Technology Roadmap Analysis
- Analysis and Recommendations
- Analyst Perspective (What is happening? Why now? What should investors know?)
- Key Questions Answered
- How large is the market?
- What is the CAGR?
- What are key trends?
- Which region dominates?
- Who are the leaders?
- Market Overview
- Market Coverage / Taxonomy
- Market Definition / Scope / Limitations
- Research Methodology
- Chapter Orientation
- Analytical Lens and Working Hypotheses
- Market Structure, Signals, and Trend Drivers
- Benchmarking and Cross-market Comparability
- Market Sizing, Forecasting, and Opportunity Mapping
- Research Design and Evidence Framework
- Desk Research Programme (Secondary Evidence)
- Expert Input and Fieldwork (Primary Evidence)
- Tooling, Models, and Reference Databases
- Data Engineering and Model Build
- Quality Assurance and Audit Trail
- Market Background
- Market Dynamics (Drivers, Restraints, Opportunity, Trends)
- Scenario Forecast (Optimistic, Likely, Conservative)
- Impact Analysis
- AI Impact
- Sustainability Impact
- Regulatory Impact
- Technology Impact
- Consumer / Buyer Analysis
- Purchase Drivers
- Adoption Barriers
- Buyer Journey
- Opportunity Map Analysis
- Product Life Cycle Analysis
- Supply Chain Analysis
- Investment Feasibility Matrix
- Value Chain Analysis
- PESTLE and Porter's Analysis
- Regulatory Landscape
- Regional Parent Market Outlook
- Production and Consumption Statistics
- Import and Export Statistics
- Global Market Analysis and Forecast, 2021 to 2036
- Historical Market Size Value (USD Billion) & Volume (Unit) Analysis, 2021 to 2025
- Current and Future Market Size Value (USD Billion) & Volume (Unit) Projections, 2026 to 2036
- Y-o-Y Growth Trend Analysis
- Absolute $ Opportunity Analysis
- Global Market Pricing Analysis, 2021 to 2036
- Global Market Analysis and Forecast, By Panel Type, 2021 to 2036
- Introduction / Key Findings
- Historical Market Size Value (USD Billion) & Volume (Unit) Analysis By Panel Type, 2021 to 2025
- Current and Future Market Size Value (USD Billion) & Volume (Unit) Analysis and Forecast By Panel Type, 2026 to 2036
- Fully Automatic Panels
- Semi-automatic Panels
- Manual Gas Panels
- VMB - VMP Panels
- Fully Automatic Panels
- Y-o-Y Growth Trend Analysis By Panel Type, 2021 to 2025
- Absolute $ Opportunity Analysis By Panel Type, 2026 to 2036
- Global Market Analysis and Forecast, By Gas Class, 2021 to 2036
- Introduction / Key Findings
- Historical Market Size Value (USD Billion) & Volume (Unit) Analysis By Gas Class, 2021 to 2025
- Current and Future Market Size Value (USD Billion) & Volume (Unit) Analysis and Forecast By Gas Class, 2026 to 2036
- Inert / High Purity
- Flammable
- Corrosive
- Toxic
- Inert / High Purity
- Y-o-Y Growth Trend Analysis By Gas Class, 2021 to 2025
- Absolute $ Opportunity Analysis By Gas Class, 2026 to 2036
- Global Market Analysis and Forecast, By Application, 2021 to 2036
- Introduction / Key Findings
- Historical Market Size Value (USD Billion) & Volume (Unit) Analysis By Application, 2021 to 2025
- Current and Future Market Size Value (USD Billion) & Volume (Unit) Analysis and Forecast By Application, 2026 to 2036
- Semiconductor Fabs
- Pharma / Labs
- Chemical Plants
- Research Facilities
- Semiconductor Fabs
- Y-o-Y Growth Trend Analysis By Application, 2021 to 2025
- Absolute $ Opportunity Analysis By Application, 2026 to 2036
- Global Market Analysis and Forecast, By Pressure Range, 2021 to 2036
- Introduction / Key Findings
- Historical Market Size Value (USD Billion) & Volume (Unit) Analysis By Pressure Range, 2021 to 2025
- Current and Future Market Size Value (USD Billion) & Volume (Unit) Analysis and Forecast By Pressure Range, 2026 to 2036
- Medium Pressure
- Low Pressure
- High Pressure
- Medium Pressure
- Y-o-Y Growth Trend Analysis By Pressure Range, 2021 to 2025
- Absolute $ Opportunity Analysis By Pressure Range, 2026 to 2036
- Global Market Analysis and Forecast, By Sales Channel, 2021 to 2036
- Introduction / Key Findings
- Historical Market Size Value (USD Billion) & Volume (Unit) Analysis By Sales Channel, 2021 to 2025
- Current and Future Market Size Value (USD Billion) & Volume (Unit) Analysis and Forecast By Sales Channel, 2026 to 2036
- Direct OEM
- EPC / Integrator
- Distributors
- Direct OEM
- Y-o-Y Growth Trend Analysis By Sales Channel, 2021 to 2025
- Absolute $ Opportunity Analysis By Sales Channel, 2026 to 2036
- Global Market Analysis and Forecast, By Region, 2021 to 2036
- Introduction
- Historical Market Size Value (USD Billion) & Volume (Unit) Analysis By Region, 2021 to 2025
- Current Market Size Value (USD Billion) & Volume (Unit) Analysis and Forecast By Region, 2026 to 2036
- North America
- Latin America
- Western Europe
- Eastern Europe
- East Asia
- South Asia and Pacific
- Middle East & Africa
- Market Attractiveness Analysis By Region
- North America Market Analysis and Forecast, By Country, 2021 to 2036
- Historical Market Size Value (USD Billion) & Volume (Unit) Trend Analysis By Market Taxonomy, 2021 to 2025
- Market Size Value (USD Billion) & Volume (Unit) Forecast By Market Taxonomy, 2026 to 2036
- By Country
- USA
- Canada
- Mexico
- By Panel Type
- By Gas Class
- By Application
- By Pressure Range
- By Sales Channel
- By Country
- Market Attractiveness Analysis
- By Country
- By Panel Type
- By Gas Class
- By Application
- By Pressure Range
- By Sales Channel
- Key Takeaways
- Latin America Market Analysis and Forecast, By Country
- Historical Market Size Value (USD Billion) & Volume (Unit) Trend Analysis By Market Taxonomy, 2021 to 2025
- Market Size Value (USD Billion) & Volume (Unit) Forecast By Market Taxonomy, 2026 to 2036
- By Country
- Brazil
- Chile
- Rest of Latin America
- By Panel Type
- By Gas Class
- By Application
- By Pressure Range
- By Sales Channel
- By Country
- Market Attractiveness Analysis
- By Country
- By Panel Type
- By Gas Class
- By Application
- By Pressure Range
- By Sales Channel
- Key Takeaways
- Western Europe Market Analysis and Forecast, By Country
- Historical Market Size Value (USD Billion) & Volume (Unit) Trend Analysis By Market Taxonomy, 2021 to 2025
- Market Size Value (USD Billion) & Volume (Unit) Forecast By Market Taxonomy, 2026 to 2036
- By Country
- Germany
- UK
- Italy
- Spain
- France
- Nordic
- BENELUX
- Rest of Western Europe
- By Panel Type
- By Gas Class
- By Application
- By Pressure Range
- By Sales Channel
- By Country
- Market Attractiveness Analysis
- By Country
- By Panel Type
- By Gas Class
- By Application
- By Pressure Range
- By Sales Channel
- Key Takeaways
- Eastern Europe Market Analysis and Forecast, By Country
- Historical Market Size Value (USD Billion) & Volume (Unit) Trend Analysis By Market Taxonomy, 2021 to 2025
- Market Size Value (USD Billion) & Volume (Unit) Forecast By Market Taxonomy, 2026 to 2036
- By Country
- Russia
- Poland
- Hungary
- Balkan & Baltic
- Rest of Eastern Europe
- By Panel Type
- By Gas Class
- By Application
- By Pressure Range
- By Sales Channel
- By Country
- Market Attractiveness Analysis
- By Country
- By Panel Type
- By Gas Class
- By Application
- By Pressure Range
- By Sales Channel
- Key Takeaways
- East Asia Market Analysis and Forecast, By Country
- Historical Market Size Value (USD Billion) & Volume (Unit) Trend Analysis By Market Taxonomy, 2021 to 2025
- Market Size Value (USD Billion) & Volume (Unit) Forecast By Market Taxonomy, 2026 to 2036
- By Country
- China
- Japan
- South Korea
- By Panel Type
- By Gas Class
- By Application
- By Pressure Range
- By Sales Channel
- By Country
- Market Attractiveness Analysis
- By Country
- By Panel Type
- By Gas Class
- By Application
- By Pressure Range
- By Sales Channel
- Key Takeaways
- South Asia and Pacific Market Analysis and Forecast, By Country
- Historical Market Size Value (USD Billion) & Volume (Unit) Trend Analysis By Market Taxonomy, 2021 to 2025
- Market Size Value (USD Billion) & Volume (Unit) Forecast By Market Taxonomy, 2026 to 2036
- By Country
- India
- ASEAN
- Australia & New Zealand
- Rest of South Asia and Pacific
- By Panel Type
- By Gas Class
- By Application
- By Pressure Range
- By Sales Channel
- By Country
- Market Attractiveness Analysis
- By Country
- By Panel Type
- By Gas Class
- By Application
- By Pressure Range
- By Sales Channel
- Key Takeaways
- Middle East & Africa Market Analysis and Forecast, By Country
- Historical Market Size Value (USD Billion) & Volume (Unit) Trend Analysis By Market Taxonomy, 2021 to 2025
- Market Size Value (USD Billion) & Volume (Unit) Forecast By Market Taxonomy, 2026 to 2036
- By Country
- Kingdom of Saudi Arabia
- Other GCC Countries
- Türkiye
- South Africa
- Other African Union
- Rest of Middle East & Africa
- By Panel Type
- By Gas Class
- By Application
- By Pressure Range
- By Sales Channel
- By Country
- Market Attractiveness Analysis
- By Country
- By Panel Type
- By Gas Class
- By Application
- By Pressure Range
- By Sales Channel
- Key Takeaways
- Key Countries Market Analysis
- USA
- Pricing Analysis
- Market Share Analysis, 2025
- By Panel Type
- By Gas Class
- By Application
- By Pressure Range
- By Sales Channel
- Canada
- Pricing Analysis
- Market Share Analysis, 2025
- By Panel Type
- By Gas Class
- By Application
- By Pressure Range
- By Sales Channel
- Mexico
- Pricing Analysis
- Market Share Analysis, 2025
- By Panel Type
- By Gas Class
- By Application
- By Pressure Range
- By Sales Channel
- Brazil
- Pricing Analysis
- Market Share Analysis, 2025
- By Panel Type
- By Gas Class
- By Application
- By Pressure Range
- By Sales Channel
- Chile
- Pricing Analysis
- Market Share Analysis, 2025
- By Panel Type
- By Gas Class
- By Application
- By Pressure Range
- By Sales Channel
- Germany
- Pricing Analysis
- Market Share Analysis, 2025
- By Panel Type
- By Gas Class
- By Application
- By Pressure Range
- By Sales Channel
- UK
- Pricing Analysis
- Market Share Analysis, 2025
- By Panel Type
- By Gas Class
- By Application
- By Pressure Range
- By Sales Channel
- Italy
- Pricing Analysis
- Market Share Analysis, 2025
- By Panel Type
- By Gas Class
- By Application
- By Pressure Range
- By Sales Channel
- Spain
- Pricing Analysis
- Market Share Analysis, 2025
- By Panel Type
- By Gas Class
- By Application
- By Pressure Range
- By Sales Channel
- France
- Pricing Analysis
- Market Share Analysis, 2025
- By Panel Type
- By Gas Class
- By Application
- By Pressure Range
- By Sales Channel
- India
- Pricing Analysis
- Market Share Analysis, 2025
- By Panel Type
- By Gas Class
- By Application
- By Pressure Range
- By Sales Channel
- ASEAN
- Pricing Analysis
- Market Share Analysis, 2025
- By Panel Type
- By Gas Class
- By Application
- By Pressure Range
- By Sales Channel
- Australia & New Zealand
- Pricing Analysis
- Market Share Analysis, 2025
- By Panel Type
- By Gas Class
- By Application
- By Pressure Range
- By Sales Channel
- China
- Pricing Analysis
- Market Share Analysis, 2025
- By Panel Type
- By Gas Class
- By Application
- By Pressure Range
- By Sales Channel
- Japan
- Pricing Analysis
- Market Share Analysis, 2025
- By Panel Type
- By Gas Class
- By Application
- By Pressure Range
- By Sales Channel
- South Korea
- Pricing Analysis
- Market Share Analysis, 2025
- By Panel Type
- By Gas Class
- By Application
- By Pressure Range
- By Sales Channel
- Russia
- Pricing Analysis
- Market Share Analysis, 2025
- By Panel Type
- By Gas Class
- By Application
- By Pressure Range
- By Sales Channel
- Poland
- Pricing Analysis
- Market Share Analysis, 2025
- By Panel Type
- By Gas Class
- By Application
- By Pressure Range
- By Sales Channel
- Hungary
- Pricing Analysis
- Market Share Analysis, 2025
- By Panel Type
- By Gas Class
- By Application
- By Pressure Range
- By Sales Channel
- Kingdom of Saudi Arabia
- Pricing Analysis
- Market Share Analysis, 2025
- By Panel Type
- By Gas Class
- By Application
- By Pressure Range
- By Sales Channel
- Türkiye
- Pricing Analysis
- Market Share Analysis, 2025
- By Panel Type
- By Gas Class
- By Application
- By Pressure Range
- By Sales Channel
- South Africa
- Pricing Analysis
- Market Share Analysis, 2025
- By Panel Type
- By Gas Class
- By Application
- By Pressure Range
- By Sales Channel
- USA
- Market Structure Analysis
- Competition Dashboard
- Competition Benchmarking
- Market Share Analysis of Top Players
- By Regional
- By Panel Type
- By Gas Class
- By Application
- By Pressure Range
- By Sales Channel
- Emerging Startups
- Innovation Benchmarking
- Competition Analysis
- Competition Deep Dive
- Entegris
- Overview
- Product Portfolio
- Profitability by Market Segments (Product/Region/Sales Channel)
- Sales Footprint
- Strategy Overview
- Marketing Strategy
- Product Strategy
- Channel Strategy
- Ichor Systems
- CKD
- Fujikin
- Swagelok
- Applied Energy Systems
- Toyoko Kagaku
- Dockweiler
- Entegris
- Case Studies
- Success Stories
- Recent Developments
- Competition Deep Dive
- Assumptions & Acronyms Used


