Volatile Organic Compound Gas Sensor Market Size and Share Forecast Outlook 2025 to 2035

The volatile organic compound gas sensor market is estimated to be valued at USD 186.5 million in 2025 and is projected to reach USD 373.8 million by 2035, registering a compound annual growth rate (CAGR) of 7.2% over the forecast period. During the early adoption phase from 2020 to 2024, demand was primarily driven by pilot deployments in industrial facilities, environmental monitoring stations, and laboratory research to detect volatile organic compounds for safety and compliance purposes. Entering the scaling phase in 2025, adoption expands across manufacturing plants, commercial buildings, and air quality monitoring networks. Manufacturers increase production, strengthen distribution channels, and offer integrated sensor solutions, supporting broader market penetration and recurring demand.

From 2030 to 2035, the market enters the consolidation phase, reaching USD 373.8 million by 2035 while maintaining a CAGR of 7.2%. Leading suppliers consolidate positions through long-term contracts, strategic partnerships, and global distribution agreements. Smaller players either specialize in niche applications or exit the market. Adoption stabilizes as most industrial and environmental users integrate VOC gas sensors into standard safety and monitoring protocols. Companies focus on reliability, accuracy, and lifecycle support. By 2035, the market will demonstrate predictable growth, mature competition, and standardized deployment practices, forming a well-structured industry landscape.
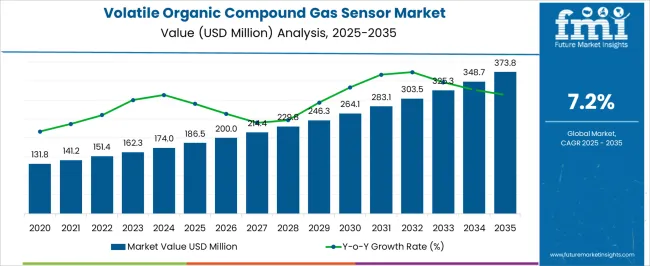
Quick Stats for Volatile Organic Compound Gas Sensor Market

  • Volatile Organic Compound Gas Sensor Market Value (2025): USD 186.5 million
  • Volatile Organic Compound Gas Sensor Market Forecast Value (2035): USD 373.8 million
  • Volatile Organic Compound Gas Sensor Market Forecast CAGR: 7.2%
  • Leading Segment in Volatile Organic Compound Gas Sensor Market in 2025: Photoionization Detectors (PID) (41.6%)
  • Key Growth Regions in Volatile Organic Compound Gas Sensor Market: North America, Asia-Pacific, Europe
  • Top Key Players in Volatile Organic Compound Gas Sensor Market: Honeywell International Inc., Siemens AG, ABB Ltd., Bosch Sensortec GmbH, Figaro Engineering Inc

Volatile Organic Compound Gas Sensor Market Market Value Analysis

Volatile Organic Compound Gas Sensor Market Key Takeaways

Metric Value
Volatile Organic Compound Gas Sensor Market Estimated Value in (2025 E) USD 186.5 million
Volatile Organic Compound Gas Sensor Market Forecast Value in (2035 F) USD 373.8 million
Forecast CAGR (2025 to 2035) 7.2%

The VOC gas sensor market is driven by diverse end-use segments, each contributing to overall growth. Industrial Manufacturing leads with approximately 30% of the market, including chemical, pharmaceutical, and petrochemical plants where continuous monitoring of VOCs ensures safety and regulatory compliance. Environmental Monitoring & Air Quality Networks account for 20%, deploying sensors in urban and industrial regions to track pollution levels and detect hazardous emissions. Commercial Buildings contribute 15%, integrating sensors into HVAC and building management systems for air quality control. Laboratories and Research Facilities represent 12%, using VOC sensors for experiments and process monitoring.

Oil & Gas Facilities hold 8%, where sensors monitor leaks and emissions across refineries and pipelines. Automotive & Transportation contributes 5%, incorporating VOC detection in cabin air quality systems and emission testing. Consumer Electronics account for 4%, including portable air quality monitors and indoor safety devices. Smaller segments, such as Healthcare & Hospitals and Food Processing Units, represent the remaining 6%, applying VOC sensors for safety and process control. Revenue distribution aligns with sector adoption, increasing from USD 131.8 million in 2020 to USD 186.5 million in 2025 and projected to reach USD 373.8 million by 2035, reflecting a CAGR of 7.2%. Industrial manufacturing and environmental monitoring remain key growth drivers, while commercial and niche applications steadily expand the market footprint.

Why is the Volatile Organic Compound Gas Sensor Market Growing?

The volatile organic compound gas sensor market is expanding steadily due to growing regulatory emphasis on air quality monitoring, industrial safety, and environmental compliance. Rising concerns over occupational health hazards and the harmful effects of prolonged VOC exposure are driving adoption across industries.

Technological advancements such as enhanced sensitivity, wireless connectivity, and miniaturized sensor designs are broadening application scope in both fixed and portable formats. The integration of smart monitoring systems and IoT-enabled platforms is enabling real-time tracking and predictive maintenance, further supporting market growth.

Stricter emission control norms in sectors such as oil and gas, chemicals, and manufacturing are reinforcing the demand for accurate VOC detection solutions. The market outlook remains positive as industries prioritize sustainable operations, worker safety, and adherence to evolving environmental regulations.

Segmental Analysis

The volatile organic compound gas sensor market is segmented by technology, type, end use industry, and geographic regions. By technology, volatile organic compound gas sensor market is divided into Photoionization Detectors (PID), Metal Oxide Semiconductor (MOS), Electrochemical sensors, Infrared-based detection, and Others. In terms of type, volatile organic compound gas sensor market is classified into Single gas detection sensor and Multiple gas detection sensor. Based on end use industry, volatile organic compound gas sensor market is segmented into Oil & gas, Agriculture, Automotive, Chemical industry, Manufacturing, Food & beverages, Metals & mining, and Others. Regionally, the volatile organic compound gas sensor industry is classified into North America, Latin America, Western Europe, Eastern Europe, Balkan & Baltic Countries, Russia & Belarus, Central Asia, East Asia, South Asia & Pacific, and the Middle East & Africa.
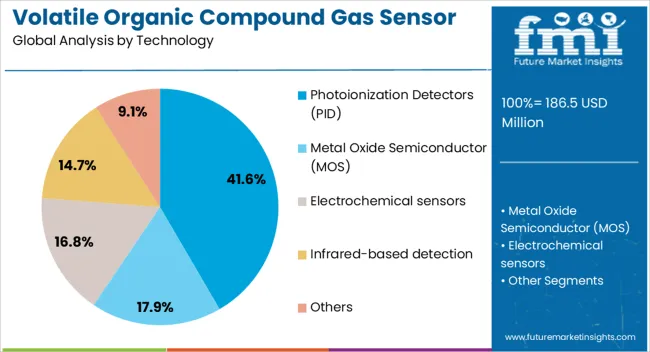
Insights into the Photoionization Detectors Technology Segment

Volatile Organic Compound Gas Sensor Market Analysis By Technology

The photoionization detectors segment is projected to hold 41.60% of the total market revenue by 2025 within the technology category, making it the leading segment. Its dominance is attributed to the high sensitivity of PID technology in detecting low concentrations of VOCs across a wide range of compounds.

The ability to deliver rapid and accurate measurements without extensive sample preparation has strengthened its adoption in both industrial safety and environmental monitoring. Additionally, the versatility of PIDs in handling diverse VOC profiles and their integration into portable and fixed systems have supported widespread use.

Continuous improvements in lamp life, calibration stability, and durability have further consolidated the position of this technology as the preferred choice for VOC detection.
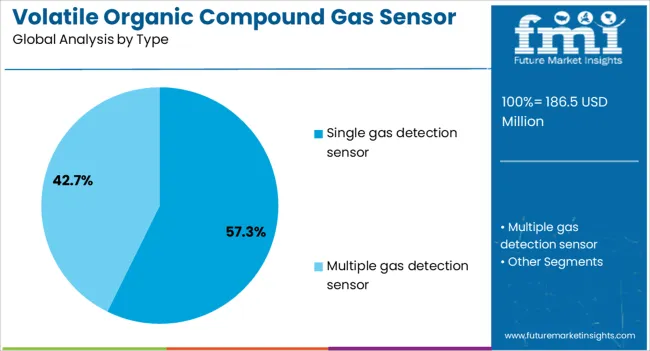
Insights into the Single Gas Detection Sensor Type Segment

Volatile Organic Compound Gas Sensor Market Analysis By Type

The single gas detection sensor segment is expected to contribute 57.30% of total market revenue by 2025 in the type category, establishing itself as the most prominent segment. This is due to its targeted detection capability, cost-effectiveness, and reliability in mission-critical environments.

Single gas sensors are valued for their simplicity, ease of maintenance, and suitability for applications where monitoring of a specific hazardous gas is required. Their deployment in personal safety devices and confined space monitoring has grown considerably, particularly in industries with stringent safety protocols.

As industries focus on minimizing false alarms and enhancing operational safety, single gas detection sensors continue to maintain a strong market presence.
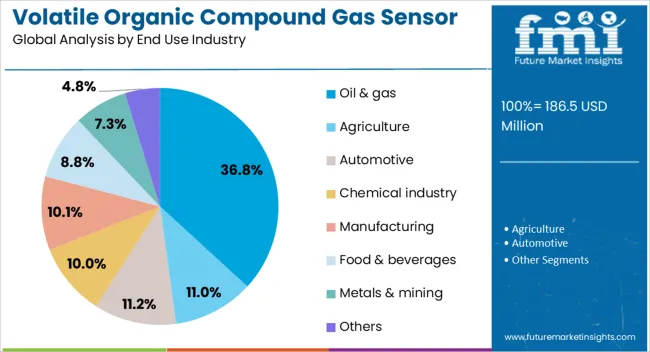
Insights into the Oil and Gas End Use Industry Segment

Volatile Organic Compound Gas Sensor Market Analysis By End Use Industry

The oil and gas segment is projected to account for 36.80% of the total market revenue by 2025 under the end use industry category, making it the largest segment. This growth is driven by the high risk of VOC emissions during exploration, drilling, refining, and transportation activities.

Stringent regulatory frameworks governing emission control and workplace safety have compelled operators to implement robust gas detection systems. The need for continuous monitoring in hazardous zones and the prevention of fire or explosion incidents have further reinforced adoption.

Additionally, the integration of VOC sensors into automated monitoring networks has improved response times and operational efficiency, solidifying oil and gas as the dominant end use industry in the market.

What are the Drivers, Restraints, and Key Trends of the Volatile Organic Compound Gas Sensor Market?

The volatile organic compound (VOC) gas sensor market is expanding due to increasing air quality monitoring, industrial safety requirements, and regulatory enforcement of emission standards. North America and Europe lead with high-precision, multi-sensor systems for industrial, environmental, and indoor applications. Asia-Pacific shows rapid growth driven by urbanization, industrialization, and smart building initiatives. Manufacturers differentiate through sensitivity, response time, and IoT-enabled integration. Regional variations in pollution levels, safety regulations, and adoption of smart monitoring solutions strongly influence market growth, deployment, and competitive positioning globally.

Air Quality Monitoring and Regulatory Compliance Drive Adoption

Adoption of VOC gas sensors is driven by the growing need for air quality monitoring and regulatory compliance. North America and Europe implement sensors in industrial plants, urban air monitoring networks, and indoor environments to detect harmful organic emissions and maintain health standards. Asia-Pacific markets adopt cost-effective sensors in densely populated urban areas, manufacturing hubs, and commercial buildings. Differences in air pollution intensity, environmental regulations, and compliance requirements affect sensor type, deployment density, and calibration frequency. Leading suppliers offer high-precision, low-detection-limit sensors with continuous monitoring and reporting capabilities, while regional manufacturers focus on affordable, practical solutions. Monitoring and compliance contrasts shape adoption, safety assurance, and market competitiveness globally.

Sensor Sensitivity and Response Time Enhance Market Growth

Sensor performance, including sensitivity and response time, significantly influences VOC gas sensor adoption. North America and Europe prioritize sensors capable of detecting trace-level VOCs in complex environments with minimal latency for industrial safety and smart building automation. Asia-Pacific markets adopt robust sensors with moderate sensitivity for large-scale monitoring in urban or semi-industrial settings. Differences in detection thresholds, response speed, and environmental adaptability affect operational efficiency, alert accuracy, and reliability. Leading suppliers offer sensors with advanced nanomaterials, fast signal processing, and multi-compound detection, while regional players focus on reliable, cost-effective devices. Sensitivity and response-time contrasts shape adoption, accuracy, and competitiveness in the global VOC gas sensor market.

Integration with IoT and Smart Systems Influences Adoption

Integration with IoT, cloud monitoring, and smart building systems drives VOC sensor adoption. North America and Europe emphasize sensors connected to automated ventilation, predictive maintenance, and real-time data analytics for enhanced operational safety and energy efficiency. Asia-Pacific markets prioritize scalable IoT-compatible sensors for industrial and urban applications while balancing affordability. Differences in digital infrastructure, connectivity protocols, and software support affect deployment, monitoring capabilities, and decision-making. Leading suppliers provide IoT-enabled, cloud-integrated sensors with real-time alerts, while regional manufacturers offer simpler, network-ready systems. Integration contrasts shape adoption, operational intelligence, and market competitiveness globally.

Industrial and Environmental Application Demand Shapes Market Growth

VOC gas sensors see growing demand in industrial and environmental applications, including chemical plants, manufacturing facilities, and air quality monitoring networks. North America and Europe focus on multi-sensor systems integrated with safety automation and environmental reporting tools. Asia-Pacific markets emphasize rugged, cost-effective sensors for high-volume industrial plants and urban monitoring programs. Differences in operational conditions, pollutant types, and data reporting requirements affect sensor specifications, durability, and calibration needs. Leading suppliers provide highly reliable, environment-adapted sensors with long service life, while regional players deliver practical, affordable solutions. Application demand contrasts shape adoption, reliability, and competitiveness globally.
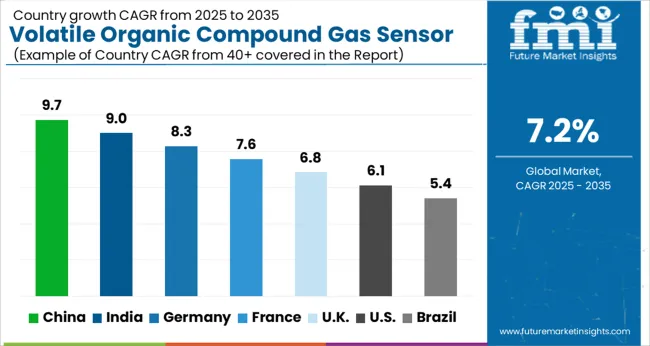
Analysis of Volatile Organic Compound Gas Sensor Market By Key Countries

Volatile Organic Compound Gas Sensor Market Cagr Analysis By Country

Country CAGR
China 9.7%
India 9.0%
Germany 8.3%
France 7.6%
UK 6.8%
USA 6.1%
Brazil 5.4%

The global volatile organic compound (VOC) gas sensor market is projected to grow at a 7.2% CAGR through 2035, driven by demand in environmental monitoring, industrial safety, and air quality management. Among BRICS nations, China led with 9.7% growth as large-scale production and deployment in industrial and municipal applications were carried out, while India at 9.0% growth expanded installations across commercial and regulatory monitoring projects. In the OECD region, Germany at 8.3% maintained steady adoption under strict compliance frameworks, while the United Kingdom at 6.8% implemented VOC sensors across commercial and public infrastructure. The USA, growing at 6.1%, advanced utilization across industrial, environmental, and safety applications in line with federal and state regulations. This report includes insights on 40+ countries; the top five markets are shown here for reference.

Volatile Organic Compound Gas Sensor Market Growth in China

The volatile organic compound gas sensor market in China is projected to grow at a CAGR of 9.7%, driven by increasing air quality monitoring initiatives and industrial safety requirements. Adoption is being encouraged by sensors that provide accurate detection, real time monitoring, and high sensitivity to hazardous gases. Manufacturers are being urged to supply durable, high performance, and technologically advanced sensors. Distribution is being strengthened through environmental agencies, industrial suppliers, and safety equipment providers. Research in miniaturization, wireless connectivity, and long term stability is being conducted. Rising environmental regulations, industrial expansion, and growing awareness of air pollution are considered key factors supporting the volatile organic compound gas sensor market in China.

  • Industrial expansion increased adoption
  • Durable and high performance sensors were supplied by manufacturers
  • R&D focused on miniaturization and wireless connectivity

Volatile Organic Compound Gas Sensor Market Development in India

The volatile organic compound gas sensor market in India is expected to grow at a CAGR of 9.0%, driven by rising demand for workplace safety and air quality monitoring in industrial environments. Adoption is being strengthened by sensors that enable real time detection, improve safety compliance, and reduce environmental risks. Manufacturers are being encouraged to provide cost effective, reliable, and accurate solutions suitable for diverse industrial applications. Distribution through industrial suppliers, safety equipment providers, and environmental monitoring companies is being expanded. Training programs and awareness campaigns are being conducted to promote proper usage and sensor maintenance. Increasing industrialization, stricter safety regulations, and growing environmental awareness are recognized as primary drivers of the volatile organic compound gas sensor market in India.
  • Workplace safety initiatives increased adoption
  • Cost effective and reliable sensors were supplied by manufacturers
  • Training programs ensured proper usage and maintenance

Volatile Organic Compound Gas Sensor Market Trends in Germany

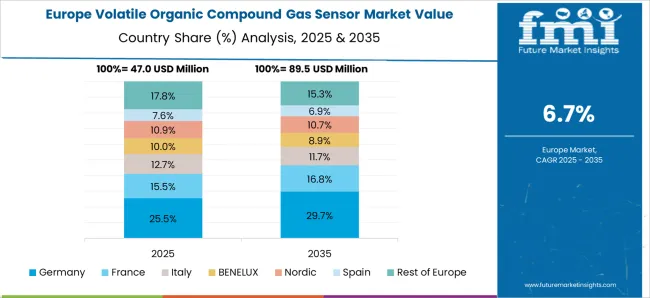
Volatile Organic Compound Gas Sensor Market Europe Country Market Share Analysis, 2025 & 2035

Germany is witnessing steady growth in the volatile organic compound gas sensor market at a CAGR of 8.3%, supported by industrial automation and environmental monitoring initiatives. Adoption is being encouraged by sensors that offer high sensitivity, accuracy, and integration with monitoring systems. Manufacturers are being urged to supply technologically advanced, long lasting, and reliable sensors. Distribution through industrial contractors, environmental monitoring agencies, and authorized suppliers is being maintained. Research in wireless communication, sensor calibration, and miniaturization is being pursued. Increasing industrial safety requirements, environmental regulations, and smart factory adoption are considered key factors driving the volatile organic compound gas sensor market in Germany.

  • Industrial automation increased adoption
  • Technologically advanced and long lasting sensors were supplied
  • R&D focused on wireless communication and calibration

Volatile Organic Compound Gas Sensor Market Insights in the United Kingdom

The volatile organic compound gas sensor market in the United Kingdom is projected to grow at a CAGR of 6.8%, due to increasing industrial monitoring needs and air quality compliance requirements. Adoption is being emphasized for sensors that provide reliable detection, real time data reporting, and high sensitivity to hazardous compounds. Manufacturers are being encouraged to supply accurate, durable, and efficient sensor solutions. Distribution through industrial suppliers, environmental monitoring companies, and safety equipment distributors is being strengthened. Demonstrations and awareness programs are being conducted to improve adoption in factories and public facilities. Rising government regulations, environmental standards, and industrial safety initiatives are recognized as major factors supporting the volatile organic compound gas sensor market in the United Kingdom.
  • Air quality monitoring boosted adoption
  • Accurate and efficient sensors were supplied by manufacturers
  • Demonstrations encouraged adoption in industrial facilities

Volatile Organic Compound Gas Sensor Market Overview in the United States

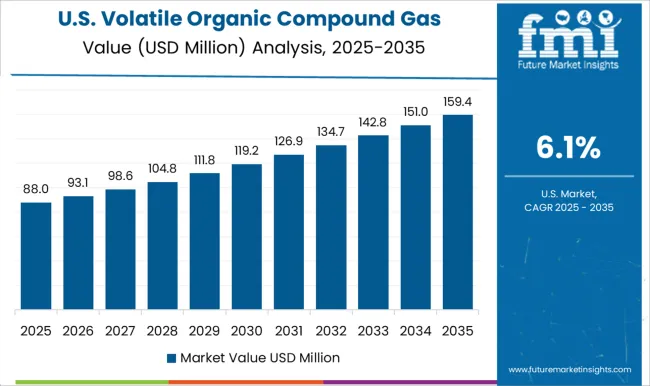
Volatile Organic Compound Gas Sensor Market Country Value Analysis

The volatile organic compound gas sensor market in the United States is projected to grow at a CAGR of 6.1%, supported by increasing industrial safety measures and air quality monitoring initiatives. Adoption is being encouraged by sensors that provide real time monitoring, precise detection, and integration with automation systems. Manufacturers are being urged to deliver durable, high performance, and technologically advanced sensors. Distribution through industrial suppliers, environmental agencies, and safety solution providers is being maintained. Research in improved sensitivity, miniaturization, and wireless connectivity is being conducted. Growing regulatory requirements, rising industrialization, and heightened environmental awareness are considered key drivers of the volatile organic compound gas sensor market in the United States.
  • Industrial safety initiatives increased adoption
  • High performance and durable sensors were supplied by manufacturers
  • R&D focused on sensitivity and wireless integration

Competitive Landscape of Volatile Organic Compound Gas Sensor Market

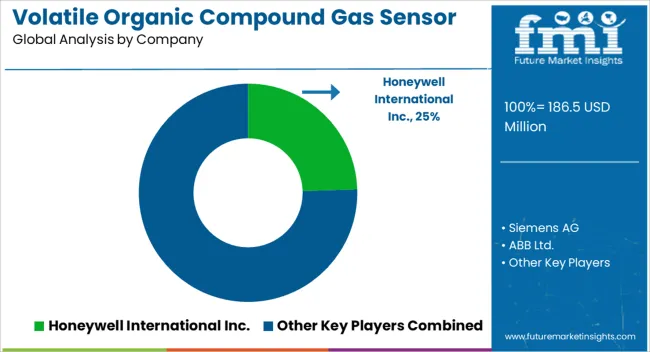
Volatile Organic Compound Gas Sensor Market Analysis By Company

The volatile organic compound (VOC) gas sensor market is shaped by a combination of global sensor manufacturers, specialized gas detection solution providers, and regional electronics companies. Leading players such as Honeywell International, Figaro Engineering Inc., Amphenol Advanced Sensors, and Bosch Sensortec maintain strong positions by offering diversified portfolios of electrochemical, metal oxide semiconductor (MOS), and photoionization-based VOC sensors for applications in industrial safety, environmental monitoring, automotive, and smart building systems. Competitive differentiation is driven by sensor sensitivity, response time, durability, calibration stability, and compatibility with IoT and wireless monitoring platforms. Regional manufacturers, particularly in Asia-Pacific and Europe, compete by providing cost-effective, compact, and energy-efficient sensors tailored to local market requirements.

Strategic partnerships with industrial automation companies, HVAC system integrators, and environmental monitoring service providers help expand market reach and technical support capabilities. Innovation in miniaturization, multi-gas detection, and AI-enabled analytics enhances competitive positioning. Companies prioritizing product reliability, regulatory compliance, and robust after-sales support are well-positioned to capture significant shares as demand for VOC detection grows across industrial, residential, and commercial sectors.

Key Players in the Volatile Organic Compound Gas Sensor Market

  • Honeywell International Inc.
  • Siemens AG
  • ABB Ltd.
  • Bosch Sensortec GmbH
  • Figaro Engineering Inc

Scope of the Report

Item Value
Quantitative Units USD 186.5 Million
Technology Photoionization Detectors (PID), Metal Oxide Semiconductor (MOS), Electrochemical sensors, Infrared-based detection, and Others
Type Single gas detection sensor and Multiple gas detection sensor
End Use Industry Oil & gas, Agriculture, Automotive, Chemical industry, Manufacturing, Food & beverages, Metals & mining, and Others
Regions Covered North America, Europe, Asia-Pacific, Latin America, Middle East & Africa
Country Covered United States, Canada, Germany, France, United Kingdom, China, Japan, India, Brazil, South Africa
Key Companies Profiled Honeywell International Inc., Siemens AG, ABB Ltd., Bosch Sensortec GmbH, and Figaro Engineering Inc
Additional Attributes Dollar sales vary by sensor type, including metal oxide, photoionization, electrochemical, and infrared sensors; by application, such as air quality monitoring, industrial safety, automotive, and smart buildings; by end-use industry, spanning environmental monitoring, manufacturing, healthcare, and consumer electronics; by region, led by North America, Europe, and Asia-Pacific. Growth is driven by rising air quality concerns, industrial safety regulations, and smart building adoption.

Volatile Organic Compound Gas Sensor Market by Segments

Technology:

  • Photoionization Detectors (PID)
  • Metal Oxide Semiconductor (MOS)
  • Electrochemical sensors
  • Infrared-based detection
  • Others

Type:

  • Single gas detection sensor
  • Multiple gas detection sensor

End Use Industry:

  • Oil & gas
  • Agriculture
  • Automotive
  • Chemical industry
  • Manufacturing
  • Food & beverages
  • Metals & mining
  • Others

Region:

  • North America
    • USA
    • Canada
    • Mexico
  • Latin America
    • Brazil
    • Chile
    • Rest of Latin America
  • Western Europe
    • Germany
    • UK
    • Italy
    • Spain
    • France
    • Nordic
    • BENELUX
    • Rest of Western Europe
  • Eastern Europe
    • Russia
    • Poland
    • Hungary
    • Balkan & Baltic
    • Rest of Eastern Europe
  • East Asia
    • China
    • Japan
    • South Korea
  • South Asia and Pacific
    • India
    • ASEAN
    • Australia & New Zealand
    • Rest of South Asia and Pacific
  • Middle East & Africa
    • Kingdom of Saudi Arabia
    • Other GCC Countries
    • Turkiye
    • South Africa
    • Other African Union
    • Rest of Middle East & Africa

Table of Content

  1. Executive Summary
    • Global Market Outlook
    • Demand-side Trends
    • Supply-side Trends
    • Technology Roadmap Analysis
    • Analysis and Recommendations
  2. Market Overview
    • Market Coverage / Taxonomy
    • Market Definition / Scope / Limitations
  3. Market Background
    • Market Dynamics
      • Drivers
      • Restraints
      • Opportunity
      • Trends
    • Scenario Forecast
      • Demand in Optimistic Scenario
      • Demand in Likely Scenario
      • Demand in Conservative Scenario
    • Opportunity Map Analysis
    • Product Life Cycle Analysis
    • Supply Chain Analysis
    • Investment Feasibility Matrix
    • Value Chain Analysis
    • PESTLE and Porter’s Analysis
    • Regulatory Landscape
    • Regional Parent Market Outlook
    • Production and Consumption Statistics
    • Import and Export Statistics
  4. Global Volatile Organic Compound Gas Sensor Market Analysis 2020-2024 and Forecast, 2025-2035
    • Historical Market Size Value (USD Mn) Analysis, 2020-2024
    • Current and Future Market Size Value (USD Mn) Projections, 2025-2035
      • Y-o-Y Growth Trend Analysis
      • Absolute $ Opportunity Analysis
  5. Global Volatile Organic Compound Gas Sensor Market Pricing Analysis 2020-2024 and Forecast 2025-2035
  6. Global Volatile Organic Compound Gas Sensor Market Analysis 2020-2024 and Forecast 2025-2035, By Technology
    • Introduction / Key Findings
    • Historical Market Size Value (USD Mn) Analysis By Technology , 2020-2024
    • Current and Future Market Size Value (USD Mn) Analysis and Forecast By Technology , 2025-2035
      • Photoionization Detectors (PID)
      • Metal Oxide Semiconductor (MOS)
      • Electrochemical sensors
      • Infrared-based detection
      • Others
    • Y-o-Y Growth Trend Analysis By Technology , 2020-2024
    • Absolute $ Opportunity Analysis By Technology , 2025-2035
  7. Global Volatile Organic Compound Gas Sensor Market Analysis 2020-2024 and Forecast 2025-2035, By Type
    • Introduction / Key Findings
    • Historical Market Size Value (USD Mn) Analysis By Type, 2020-2024
    • Current and Future Market Size Value (USD Mn) Analysis and Forecast By Type, 2025-2035
      • Single gas detection sensor
      • Multiple gas detection sensor
    • Y-o-Y Growth Trend Analysis By Type, 2020-2024
    • Absolute $ Opportunity Analysis By Type, 2025-2035
  8. Global Volatile Organic Compound Gas Sensor Market Analysis 2020-2024 and Forecast 2025-2035, By End Use Industry
    • Introduction / Key Findings
    • Historical Market Size Value (USD Mn) Analysis By End Use Industry, 2020-2024
    • Current and Future Market Size Value (USD Mn) Analysis and Forecast By End Use Industry, 2025-2035
      • Oil & gas
      • Agriculture
      • Automotive
      • Chemical industry
      • Manufacturing
      • Food & beverages
      • Metals & mining
      • Others
    • Y-o-Y Growth Trend Analysis By End Use Industry, 2020-2024
    • Absolute $ Opportunity Analysis By End Use Industry, 2025-2035
  9. Global Volatile Organic Compound Gas Sensor Market Analysis 2020-2024 and Forecast 2025-2035, By Region
    • Introduction
    • Historical Market Size Value (USD Mn) Analysis By Region, 2020-2024
    • Current Market Size Value (USD Mn) Analysis and Forecast By Region, 2025-2035
      • North America
      • Latin America
      • Western Europe
      • Eastern Europe
      • East Asia
      • South Asia and Pacific
      • Middle East & Africa
    • Market Attractiveness Analysis By Region
  10. North America Volatile Organic Compound Gas Sensor Market Analysis 2020-2024 and Forecast 2025-2035, By Country
    • Historical Market Size Value (USD Mn) Trend Analysis By Market Taxonomy, 2020-2024
    • Market Size Value (USD Mn) Forecast By Market Taxonomy, 2025-2035
      • By Country
        • USA
        • Canada
        • Mexico
      • By Technology
      • By Type
      • By End Use Industry
    • Market Attractiveness Analysis
      • By Country
      • By Technology
      • By Type
      • By End Use Industry
    • Key Takeaways
  11. Latin America Volatile Organic Compound Gas Sensor Market Analysis 2020-2024 and Forecast 2025-2035, By Country
    • Historical Market Size Value (USD Mn) Trend Analysis By Market Taxonomy, 2020-2024
    • Market Size Value (USD Mn) Forecast By Market Taxonomy, 2025-2035
      • By Country
        • Brazil
        • Chile
        • Rest of Latin America
      • By Technology
      • By Type
      • By End Use Industry
    • Market Attractiveness Analysis
      • By Country
      • By Technology
      • By Type
      • By End Use Industry
    • Key Takeaways
  12. Western Europe Volatile Organic Compound Gas Sensor Market Analysis 2020-2024 and Forecast 2025-2035, By Country
    • Historical Market Size Value (USD Mn) Trend Analysis By Market Taxonomy, 2020-2024
    • Market Size Value (USD Mn) Forecast By Market Taxonomy, 2025-2035
      • By Country
        • Germany
        • UK
        • Italy
        • Spain
        • France
        • Nordic
        • BENELUX
        • Rest of Western Europe
      • By Technology
      • By Type
      • By End Use Industry
    • Market Attractiveness Analysis
      • By Country
      • By Technology
      • By Type
      • By End Use Industry
    • Key Takeaways
  13. Eastern Europe Volatile Organic Compound Gas Sensor Market Analysis 2020-2024 and Forecast 2025-2035, By Country
    • Historical Market Size Value (USD Mn) Trend Analysis By Market Taxonomy, 2020-2024
    • Market Size Value (USD Mn) Forecast By Market Taxonomy, 2025-2035
      • By Country
        • Russia
        • Poland
        • Hungary
        • Balkan & Baltic
        • Rest of Eastern Europe
      • By Technology
      • By Type
      • By End Use Industry
    • Market Attractiveness Analysis
      • By Country
      • By Technology
      • By Type
      • By End Use Industry
    • Key Takeaways
  14. East Asia Volatile Organic Compound Gas Sensor Market Analysis 2020-2024 and Forecast 2025-2035, By Country
    • Historical Market Size Value (USD Mn) Trend Analysis By Market Taxonomy, 2020-2024
    • Market Size Value (USD Mn) Forecast By Market Taxonomy, 2025-2035
      • By Country
        • China
        • Japan
        • South Korea
      • By Technology
      • By Type
      • By End Use Industry
    • Market Attractiveness Analysis
      • By Country
      • By Technology
      • By Type
      • By End Use Industry
    • Key Takeaways
  15. South Asia and Pacific Volatile Organic Compound Gas Sensor Market Analysis 2020-2024 and Forecast 2025-2035, By Country
    • Historical Market Size Value (USD Mn) Trend Analysis By Market Taxonomy, 2020-2024
    • Market Size Value (USD Mn) Forecast By Market Taxonomy, 2025-2035
      • By Country
        • India
        • ASEAN
        • Australia & New Zealand
        • Rest of South Asia and Pacific
      • By Technology
      • By Type
      • By End Use Industry
    • Market Attractiveness Analysis
      • By Country
      • By Technology
      • By Type
      • By End Use Industry
    • Key Takeaways
  16. Middle East & Africa Volatile Organic Compound Gas Sensor Market Analysis 2020-2024 and Forecast 2025-2035, By Country
    • Historical Market Size Value (USD Mn) Trend Analysis By Market Taxonomy, 2020-2024
    • Market Size Value (USD Mn) Forecast By Market Taxonomy, 2025-2035
      • By Country
        • Kingdom of Saudi Arabia
        • Other GCC Countries
        • Turkiye
        • South Africa
        • Other African Union
        • Rest of Middle East & Africa
      • By Technology
      • By Type
      • By End Use Industry
    • Market Attractiveness Analysis
      • By Country
      • By Technology
      • By Type
      • By End Use Industry
    • Key Takeaways
  17. Key Countries Volatile Organic Compound Gas Sensor Market Analysis
    • USA
      • Pricing Analysis
      • Market Share Analysis, 2024
        • By Technology
        • By Type
        • By End Use Industry
    • Canada
      • Pricing Analysis
      • Market Share Analysis, 2024
        • By Technology
        • By Type
        • By End Use Industry
    • Mexico
      • Pricing Analysis
      • Market Share Analysis, 2024
        • By Technology
        • By Type
        • By End Use Industry
    • Brazil
      • Pricing Analysis
      • Market Share Analysis, 2024
        • By Technology
        • By Type
        • By End Use Industry
    • Chile
      • Pricing Analysis
      • Market Share Analysis, 2024
        • By Technology
        • By Type
        • By End Use Industry
    • Germany
      • Pricing Analysis
      • Market Share Analysis, 2024
        • By Technology
        • By Type
        • By End Use Industry
    • UK
      • Pricing Analysis
      • Market Share Analysis, 2024
        • By Technology
        • By Type
        • By End Use Industry
    • Italy
      • Pricing Analysis
      • Market Share Analysis, 2024
        • By Technology
        • By Type
        • By End Use Industry
    • Spain
      • Pricing Analysis
      • Market Share Analysis, 2024
        • By Technology
        • By Type
        • By End Use Industry
    • France
      • Pricing Analysis
      • Market Share Analysis, 2024
        • By Technology
        • By Type
        • By End Use Industry
    • India
      • Pricing Analysis
      • Market Share Analysis, 2024
        • By Technology
        • By Type
        • By End Use Industry
    • ASEAN
      • Pricing Analysis
      • Market Share Analysis, 2024
        • By Technology
        • By Type
        • By End Use Industry
    • Australia & New Zealand
      • Pricing Analysis
      • Market Share Analysis, 2024
        • By Technology
        • By Type
        • By End Use Industry
    • China
      • Pricing Analysis
      • Market Share Analysis, 2024
        • By Technology
        • By Type
        • By End Use Industry
    • Japan
      • Pricing Analysis
      • Market Share Analysis, 2024
        • By Technology
        • By Type
        • By End Use Industry
    • South Korea
      • Pricing Analysis
      • Market Share Analysis, 2024
        • By Technology
        • By Type
        • By End Use Industry
    • Russia
      • Pricing Analysis
      • Market Share Analysis, 2024
        • By Technology
        • By Type
        • By End Use Industry
    • Poland
      • Pricing Analysis
      • Market Share Analysis, 2024
        • By Technology
        • By Type
        • By End Use Industry
    • Hungary
      • Pricing Analysis
      • Market Share Analysis, 2024
        • By Technology
        • By Type
        • By End Use Industry
    • Kingdom of Saudi Arabia
      • Pricing Analysis
      • Market Share Analysis, 2024
        • By Technology
        • By Type
        • By End Use Industry
    • Turkiye
      • Pricing Analysis
      • Market Share Analysis, 2024
        • By Technology
        • By Type
        • By End Use Industry
    • South Africa
      • Pricing Analysis
      • Market Share Analysis, 2024
        • By Technology
        • By Type
        • By End Use Industry
  18. Market Structure Analysis
    • Competition Dashboard
    • Competition Benchmarking
    • Market Share Analysis of Top Players
      • By Regional
      • By Technology
      • By Type
      • By End Use Industry
  19. Competition Analysis
    • Competition Deep Dive
      • Honeywell International Inc.
        • Overview
        • Product Portfolio
        • Profitability by Market Segments (Product/Age /Sales Channel/Region)
        • Sales Footprint
        • Strategy Overview
          • Marketing Strategy
          • Product Strategy
          • Channel Strategy
      • Siemens AG
      • ABB Ltd.
      • Bosch Sensortec GmbH
      • Figaro Engineering Inc
  20. Assumptions & Acronyms Used
  21. Research Methodology

List of Tables

  • Table 1: Global Volatile Organic Compound Gas Sensor Market Value (USD Mn) Forecast by Region, 2020-2035
  • Table 2: Global Volatile Organic Compound Gas Sensor Market Value (USD Mn) Forecast by Technology , 2020-2035
  • Table 3: Global Volatile Organic Compound Gas Sensor Market Value (USD Mn) Forecast by Type, 2020-2035
  • Table 4: Global Volatile Organic Compound Gas Sensor Market Value (USD Mn) Forecast by End Use Industry, 2020-2035
  • Table 5: North America Volatile Organic Compound Gas Sensor Market Value (USD Mn) Forecast by Country, 2020-2035
  • Table 6: North America Volatile Organic Compound Gas Sensor Market Value (USD Mn) Forecast by Technology , 2020-2035
  • Table 7: North America Volatile Organic Compound Gas Sensor Market Value (USD Mn) Forecast by Type, 2020-2035
  • Table 8: North America Volatile Organic Compound Gas Sensor Market Value (USD Mn) Forecast by End Use Industry, 2020-2035
  • Table 9: Latin America Volatile Organic Compound Gas Sensor Market Value (USD Mn) Forecast by Country, 2020-2035
  • Table 10: Latin America Volatile Organic Compound Gas Sensor Market Value (USD Mn) Forecast by Technology , 2020-2035
  • Table 11: Latin America Volatile Organic Compound Gas Sensor Market Value (USD Mn) Forecast by Type, 2020-2035
  • Table 12: Latin America Volatile Organic Compound Gas Sensor Market Value (USD Mn) Forecast by End Use Industry, 2020-2035
  • Table 13: Western Europe Volatile Organic Compound Gas Sensor Market Value (USD Mn) Forecast by Country, 2020-2035
  • Table 14: Western Europe Volatile Organic Compound Gas Sensor Market Value (USD Mn) Forecast by Technology , 2020-2035
  • Table 15: Western Europe Volatile Organic Compound Gas Sensor Market Value (USD Mn) Forecast by Type, 2020-2035
  • Table 16: Western Europe Volatile Organic Compound Gas Sensor Market Value (USD Mn) Forecast by End Use Industry, 2020-2035
  • Table 17: Eastern Europe Volatile Organic Compound Gas Sensor Market Value (USD Mn) Forecast by Country, 2020-2035
  • Table 18: Eastern Europe Volatile Organic Compound Gas Sensor Market Value (USD Mn) Forecast by Technology , 2020-2035
  • Table 19: Eastern Europe Volatile Organic Compound Gas Sensor Market Value (USD Mn) Forecast by Type, 2020-2035
  • Table 20: Eastern Europe Volatile Organic Compound Gas Sensor Market Value (USD Mn) Forecast by End Use Industry, 2020-2035
  • Table 21: East Asia Volatile Organic Compound Gas Sensor Market Value (USD Mn) Forecast by Country, 2020-2035
  • Table 22: East Asia Volatile Organic Compound Gas Sensor Market Value (USD Mn) Forecast by Technology , 2020-2035
  • Table 23: East Asia Volatile Organic Compound Gas Sensor Market Value (USD Mn) Forecast by Type, 2020-2035
  • Table 24: East Asia Volatile Organic Compound Gas Sensor Market Value (USD Mn) Forecast by End Use Industry, 2020-2035
  • Table 25: South Asia and Pacific Volatile Organic Compound Gas Sensor Market Value (USD Mn) Forecast by Country, 2020-2035
  • Table 26: South Asia and Pacific Volatile Organic Compound Gas Sensor Market Value (USD Mn) Forecast by Technology , 2020-2035
  • Table 27: South Asia and Pacific Volatile Organic Compound Gas Sensor Market Value (USD Mn) Forecast by Type, 2020-2035
  • Table 28: South Asia and Pacific Volatile Organic Compound Gas Sensor Market Value (USD Mn) Forecast by End Use Industry, 2020-2035
  • Table 29: Middle East & Africa Volatile Organic Compound Gas Sensor Market Value (USD Mn) Forecast by Country, 2020-2035
  • Table 30: Middle East & Africa Volatile Organic Compound Gas Sensor Market Value (USD Mn) Forecast by Technology , 2020-2035
  • Table 31: Middle East & Africa Volatile Organic Compound Gas Sensor Market Value (USD Mn) Forecast by Type, 2020-2035
  • Table 32: Middle East & Africa Volatile Organic Compound Gas Sensor Market Value (USD Mn) Forecast by End Use Industry, 2020-2035

List of Figures

  • Figure 1: Global Volatile Organic Compound Gas Sensor Market Pricing Analysis
  • Figure 2: Global Volatile Organic Compound Gas Sensor Market Value (USD Mn) Forecast 2020–2035
  • Figure 3: Global Volatile Organic Compound Gas Sensor Market Value Share and BPS Analysis by Technology , 2025 and 2035
  • Figure 4: Global Volatile Organic Compound Gas Sensor Market Y-o-Y Growth Comparison by Technology , 2025–2035
  • Figure 5: Global Volatile Organic Compound Gas Sensor Market Attractiveness Analysis by Technology
  • Figure 6: Global Volatile Organic Compound Gas Sensor Market Value Share and BPS Analysis by Type, 2025 and 2035
  • Figure 7: Global Volatile Organic Compound Gas Sensor Market Y-o-Y Growth Comparison by Type, 2025–2035
  • Figure 8: Global Volatile Organic Compound Gas Sensor Market Attractiveness Analysis by Type
  • Figure 9: Global Volatile Organic Compound Gas Sensor Market Value Share and BPS Analysis by End Use Industry, 2025 and 2035
  • Figure 10: Global Volatile Organic Compound Gas Sensor Market Y-o-Y Growth Comparison by End Use Industry, 2025–2035
  • Figure 11: Global Volatile Organic Compound Gas Sensor Market Attractiveness Analysis by End Use Industry
  • Figure 12: Global Volatile Organic Compound Gas Sensor Market Value (USD Mn) Share and BPS Analysis by Region, 2025 and 2035
  • Figure 13: Global Volatile Organic Compound Gas Sensor Market Y-o-Y Growth Comparison by Region, 2025–2035
  • Figure 14: Global Volatile Organic Compound Gas Sensor Market Attractiveness Analysis by Region
  • Figure 15: North America Volatile Organic Compound Gas Sensor Market Incremental Dollar Opportunity, 2025–2035
  • Figure 16: Latin America Volatile Organic Compound Gas Sensor Market Incremental Dollar Opportunity, 2025–2035
  • Figure 17: Western Europe Volatile Organic Compound Gas Sensor Market Incremental Dollar Opportunity, 2025–2035
  • Figure 18: Eastern Europe Volatile Organic Compound Gas Sensor Market Incremental Dollar Opportunity, 2025–2035
  • Figure 19: East Asia Volatile Organic Compound Gas Sensor Market Incremental Dollar Opportunity, 2025–2035
  • Figure 20: South Asia and Pacific Volatile Organic Compound Gas Sensor Market Incremental Dollar Opportunity, 2025–2035
  • Figure 21: Middle East & Africa Volatile Organic Compound Gas Sensor Market Incremental Dollar Opportunity, 2025–2035
  • Figure 22: North America Volatile Organic Compound Gas Sensor Market Value Share and BPS Analysis by Country, 2025 and 2035
  • Figure 23: North America Volatile Organic Compound Gas Sensor Market Value Share and BPS Analysis by Technology , 2025 and 2035
  • Figure 24: North America Volatile Organic Compound Gas Sensor Market Y-o-Y Growth Comparison by Technology , 2025–2035
  • Figure 25: North America Volatile Organic Compound Gas Sensor Market Attractiveness Analysis by Technology
  • Figure 26: North America Volatile Organic Compound Gas Sensor Market Value Share and BPS Analysis by Type, 2025 and 2035
  • Figure 27: North America Volatile Organic Compound Gas Sensor Market Y-o-Y Growth Comparison by Type, 2025–2035
  • Figure 28: North America Volatile Organic Compound Gas Sensor Market Attractiveness Analysis by Type
  • Figure 29: North America Volatile Organic Compound Gas Sensor Market Value Share and BPS Analysis by End Use Industry, 2025 and 2035
  • Figure 30: North America Volatile Organic Compound Gas Sensor Market Y-o-Y Growth Comparison by End Use Industry, 2025–2035
  • Figure 31: North America Volatile Organic Compound Gas Sensor Market Attractiveness Analysis by End Use Industry
  • Figure 32: Latin America Volatile Organic Compound Gas Sensor Market Value Share and BPS Analysis by Country, 2025 and 2035
  • Figure 33: Latin America Volatile Organic Compound Gas Sensor Market Value Share and BPS Analysis by Technology , 2025 and 2035
  • Figure 34: Latin America Volatile Organic Compound Gas Sensor Market Y-o-Y Growth Comparison by Technology , 2025–2035
  • Figure 35: Latin America Volatile Organic Compound Gas Sensor Market Attractiveness Analysis by Technology
  • Figure 36: Latin America Volatile Organic Compound Gas Sensor Market Value Share and BPS Analysis by Type, 2025 and 2035
  • Figure 37: Latin America Volatile Organic Compound Gas Sensor Market Y-o-Y Growth Comparison by Type, 2025–2035
  • Figure 38: Latin America Volatile Organic Compound Gas Sensor Market Attractiveness Analysis by Type
  • Figure 39: Latin America Volatile Organic Compound Gas Sensor Market Value Share and BPS Analysis by End Use Industry, 2025 and 2035
  • Figure 40: Latin America Volatile Organic Compound Gas Sensor Market Y-o-Y Growth Comparison by End Use Industry, 2025–2035
  • Figure 41: Latin America Volatile Organic Compound Gas Sensor Market Attractiveness Analysis by End Use Industry
  • Figure 42: Western Europe Volatile Organic Compound Gas Sensor Market Value Share and BPS Analysis by Country, 2025 and 2035
  • Figure 43: Western Europe Volatile Organic Compound Gas Sensor Market Value Share and BPS Analysis by Technology , 2025 and 2035
  • Figure 44: Western Europe Volatile Organic Compound Gas Sensor Market Y-o-Y Growth Comparison by Technology , 2025–2035
  • Figure 45: Western Europe Volatile Organic Compound Gas Sensor Market Attractiveness Analysis by Technology
  • Figure 46: Western Europe Volatile Organic Compound Gas Sensor Market Value Share and BPS Analysis by Type, 2025 and 2035
  • Figure 47: Western Europe Volatile Organic Compound Gas Sensor Market Y-o-Y Growth Comparison by Type, 2025–2035
  • Figure 48: Western Europe Volatile Organic Compound Gas Sensor Market Attractiveness Analysis by Type
  • Figure 49: Western Europe Volatile Organic Compound Gas Sensor Market Value Share and BPS Analysis by End Use Industry, 2025 and 2035
  • Figure 50: Western Europe Volatile Organic Compound Gas Sensor Market Y-o-Y Growth Comparison by End Use Industry, 2025–2035
  • Figure 51: Western Europe Volatile Organic Compound Gas Sensor Market Attractiveness Analysis by End Use Industry
  • Figure 52: Eastern Europe Volatile Organic Compound Gas Sensor Market Value Share and BPS Analysis by Country, 2025 and 2035
  • Figure 53: Eastern Europe Volatile Organic Compound Gas Sensor Market Value Share and BPS Analysis by Technology , 2025 and 2035
  • Figure 54: Eastern Europe Volatile Organic Compound Gas Sensor Market Y-o-Y Growth Comparison by Technology , 2025–2035
  • Figure 55: Eastern Europe Volatile Organic Compound Gas Sensor Market Attractiveness Analysis by Technology
  • Figure 56: Eastern Europe Volatile Organic Compound Gas Sensor Market Value Share and BPS Analysis by Type, 2025 and 2035
  • Figure 57: Eastern Europe Volatile Organic Compound Gas Sensor Market Y-o-Y Growth Comparison by Type, 2025–2035
  • Figure 58: Eastern Europe Volatile Organic Compound Gas Sensor Market Attractiveness Analysis by Type
  • Figure 59: Eastern Europe Volatile Organic Compound Gas Sensor Market Value Share and BPS Analysis by End Use Industry, 2025 and 2035
  • Figure 60: Eastern Europe Volatile Organic Compound Gas Sensor Market Y-o-Y Growth Comparison by End Use Industry, 2025–2035
  • Figure 61: Eastern Europe Volatile Organic Compound Gas Sensor Market Attractiveness Analysis by End Use Industry
  • Figure 62: East Asia Volatile Organic Compound Gas Sensor Market Value Share and BPS Analysis by Country, 2025 and 2035
  • Figure 63: East Asia Volatile Organic Compound Gas Sensor Market Value Share and BPS Analysis by Technology , 2025 and 2035
  • Figure 64: East Asia Volatile Organic Compound Gas Sensor Market Y-o-Y Growth Comparison by Technology , 2025–2035
  • Figure 65: East Asia Volatile Organic Compound Gas Sensor Market Attractiveness Analysis by Technology
  • Figure 66: East Asia Volatile Organic Compound Gas Sensor Market Value Share and BPS Analysis by Type, 2025 and 2035
  • Figure 67: East Asia Volatile Organic Compound Gas Sensor Market Y-o-Y Growth Comparison by Type, 2025–2035
  • Figure 68: East Asia Volatile Organic Compound Gas Sensor Market Attractiveness Analysis by Type
  • Figure 69: East Asia Volatile Organic Compound Gas Sensor Market Value Share and BPS Analysis by End Use Industry, 2025 and 2035
  • Figure 70: East Asia Volatile Organic Compound Gas Sensor Market Y-o-Y Growth Comparison by End Use Industry, 2025–2035
  • Figure 71: East Asia Volatile Organic Compound Gas Sensor Market Attractiveness Analysis by End Use Industry
  • Figure 72: South Asia and Pacific Volatile Organic Compound Gas Sensor Market Value Share and BPS Analysis by Country, 2025 and 2035
  • Figure 73: South Asia and Pacific Volatile Organic Compound Gas Sensor Market Value Share and BPS Analysis by Technology , 2025 and 2035
  • Figure 74: South Asia and Pacific Volatile Organic Compound Gas Sensor Market Y-o-Y Growth Comparison by Technology , 2025–2035
  • Figure 75: South Asia and Pacific Volatile Organic Compound Gas Sensor Market Attractiveness Analysis by Technology
  • Figure 76: South Asia and Pacific Volatile Organic Compound Gas Sensor Market Value Share and BPS Analysis by Type, 2025 and 2035
  • Figure 77: South Asia and Pacific Volatile Organic Compound Gas Sensor Market Y-o-Y Growth Comparison by Type, 2025–2035
  • Figure 78: South Asia and Pacific Volatile Organic Compound Gas Sensor Market Attractiveness Analysis by Type
  • Figure 79: South Asia and Pacific Volatile Organic Compound Gas Sensor Market Value Share and BPS Analysis by End Use Industry, 2025 and 2035
  • Figure 80: South Asia and Pacific Volatile Organic Compound Gas Sensor Market Y-o-Y Growth Comparison by End Use Industry, 2025–2035
  • Figure 81: South Asia and Pacific Volatile Organic Compound Gas Sensor Market Attractiveness Analysis by End Use Industry
  • Figure 82: Middle East & Africa Volatile Organic Compound Gas Sensor Market Value Share and BPS Analysis by Country, 2025 and 2035
  • Figure 83: Middle East & Africa Volatile Organic Compound Gas Sensor Market Value Share and BPS Analysis by Technology , 2025 and 2035
  • Figure 84: Middle East & Africa Volatile Organic Compound Gas Sensor Market Y-o-Y Growth Comparison by Technology , 2025–2035
  • Figure 85: Middle East & Africa Volatile Organic Compound Gas Sensor Market Attractiveness Analysis by Technology
  • Figure 86: Middle East & Africa Volatile Organic Compound Gas Sensor Market Value Share and BPS Analysis by Type, 2025 and 2035
  • Figure 87: Middle East & Africa Volatile Organic Compound Gas Sensor Market Y-o-Y Growth Comparison by Type, 2025–2035
  • Figure 88: Middle East & Africa Volatile Organic Compound Gas Sensor Market Attractiveness Analysis by Type
  • Figure 89: Middle East & Africa Volatile Organic Compound Gas Sensor Market Value Share and BPS Analysis by End Use Industry, 2025 and 2035
  • Figure 90: Middle East & Africa Volatile Organic Compound Gas Sensor Market Y-o-Y Growth Comparison by End Use Industry, 2025–2035
  • Figure 91: Middle East & Africa Volatile Organic Compound Gas Sensor Market Attractiveness Analysis by End Use Industry
  • Figure 92: Global Volatile Organic Compound Gas Sensor Market – Tier Structure Analysis
  • Figure 93: Global Volatile Organic Compound Gas Sensor Market – Company Share Analysis

Frequently Asked Questions

How big is the volatile organic compound gas sensor market in 2025?

The global volatile organic compound gas sensor market is estimated to be valued at USD 186.5 million in 2025.

What will be the size of volatile organic compound gas sensor market in 2035?

The market size for the volatile organic compound gas sensor market is projected to reach USD 373.8 million by 2035.

How much will be the volatile organic compound gas sensor market growth between 2025 and 2035?

The volatile organic compound gas sensor market is expected to grow at a 7.2% CAGR between 2025 and 2035.

What are the key product types in the volatile organic compound gas sensor market?

The key product types in volatile organic compound gas sensor market are photoionization detectors (pid), metal oxide semiconductor (mos), electrochemical sensors, infrared-based detection and others.

Which type segment to contribute significant share in the volatile organic compound gas sensor market in 2025?

In terms of type, single gas detection sensor segment to command 57.3% share in the volatile organic compound gas sensor market in 2025.

Explore Similar Insights

Future Market Insights

Volatile Organic Compound Gas Sensor Market

Chat With

MaRIA

Hi There, I am MaRIA, Your Market Research Intelligence Assistant. How may I help you?