

- Market Size (2026)
- USD 520.0 Mn
- Forecast (2036)
- USD 1102.0 Mn
- CAGR (2026 to 2036)
- 7.8%
How big is the Stress Recovery Additives Market in 2026?
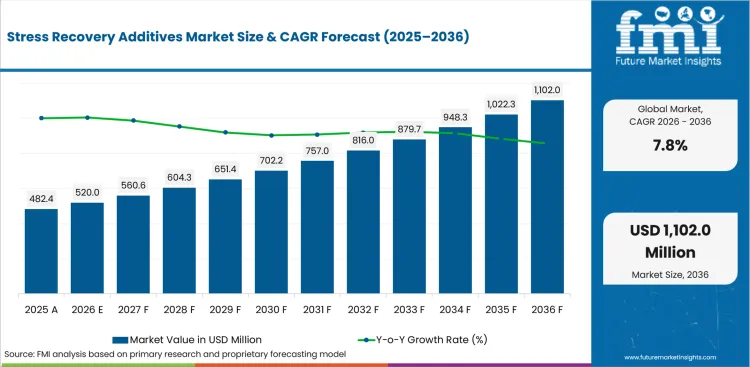
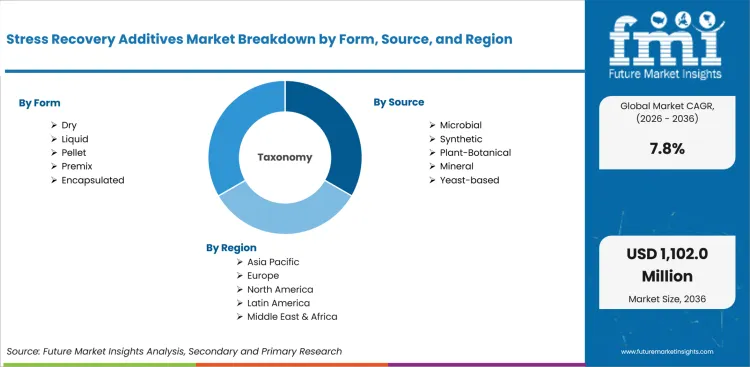
USD 520.0 million in 2026 and USD 1,102.0 million by 2036 at a 7.8% CAGR.
The stress recovery additives industry value stood at USD 482.4 million in 2025. The market size is expected to scale from USD 520.0 million in 2026 to USD 1,102.0 million by 2036 at a predicted 7.8% CAGR. The stress recovery additives are integrating into routine feed inputs into animal performance support. Feed mills and livestock integrators use such additives to protect diet response during disease recovery and ration changes. OECD-FAO projects world meat production to rise by 13% to 406 Mt cwe by 2034, maintaining feed efficiency and recovery support inside nutrition planning.
Poultry producers promote a large use base for stress recovery additives. Broiler and layer diets pass due to frequent reformulation cycles, so additive performance must support gut stability and feed conversion during stressful periods. Global poultry consumption is projected to reach 173 Mt rtc by 2034, influencing wider attention to gut health products and nutrient utilization inputs.
Suppliers are reviewed depending on formulation support and practical feed mill handling. Buyers connect stress recovery products with animal feed planning as additive value is judged after feed moves into real production. Commercial approval improves once suppliers explain species response and performance evidence without adding extra work for nutrition teams.
Summary of the Stress Recovery Additives Market
| Market Signal | Commercial Impact |
|---|---|
| Demand and Growth Drivers | Demand for stress recovery additives is increasing as livestock producers use nutrition tools to protect animal output after heat and ration stress.
|
| Product and Segment View | Segment demand is led by direct feed mill sourcing and poultry programs requiring validated additive performance.
|
| Geography and Growth Outlook | Regional demand is concentrated in countries with dense livestock systems and commercial diet adoption.
|
| Competitive Landscape | Competition focuses on ingredient depth and species-specific evidence.
|
| Analyst Perspective | Stress recovery additives are developing into a performance assurance market linked to feed efficiency and animal resilience.
|
How is the stress recovery additives market segmented?
The stress recovery additives industry is segmented by form, source, livestock, function, sales channel and region.
The stress recovery additives market is segmented by form, source, livestock, function, sales channel and region. By form, coverage includes dry, liquid, pellet, premix and encapsulated. By source, coverage includes synthetic, microbial, plant or botanical, mineral and yeast-based. By livestock, coverage includes poultry, swine, ruminants, aquaculture and equine and pets. By function, coverage includes gut health, growth performance, immunity, nutrient utilization and stress management. By sales channel, coverage includes direct to feed mills and integrators, premix manufacturers, nutrition consultants and veterinarians, distributors and dealers and online and specialty retail. Regional coverage includes North America, Latin America, Europe, East Asia, South Asia and Pacific and the Middle East and Africa.
Why does dry lead within the form category?
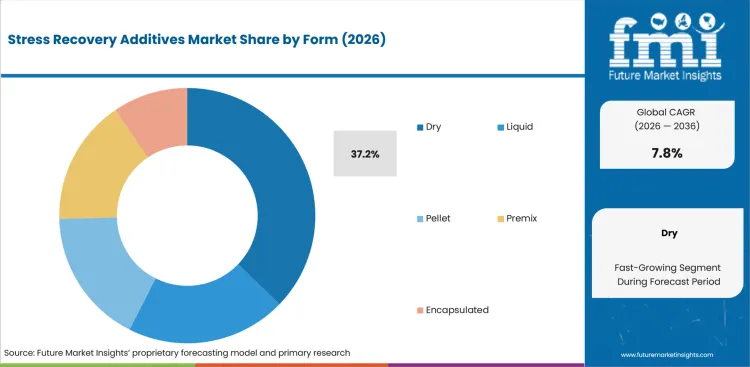
Dry additives lead depending on storage stability and easy use in commercial feed systems. Feed mills prefer inputs moving through mixers and premix lines without extra process changes. Alltech reported world feed production increased by 1.2% to 1.396 billion metric tons in 2024, providing dry formats a large handling base across feed plants.
- Dry is expected to account for 37.2% share in 2026, backed by demand for additives being able to be blended and stored inside existing feed mill systems. Buyers prefer dry formats once dosage control and batch traceability support commercial use.
- Liquid and encapsulated formats remain useful in programs needing dispersion control or protected release. Dry formats gain attention once suppliers prove mixing behavior and line compatibility before commercial scale-up.
What supports demand for microbial in source choices?
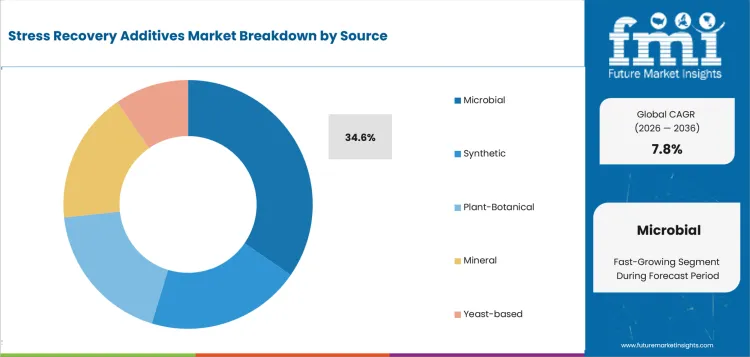
Microbial additives gain attention as nutrition teams connect gut balance with recovery from stress exposure. Buyers review strain identity and safety files before approving commercial diets. EFSA recorded 47 microorganisms notified between April and September 2025, including 28 notified as feed additives, reflecting why microbial source documentation remains central to buyer review.
- Microbial is anticipated to hold 34.6% share in 2026, led by feed programs requiring gut stability and traceable source information. Buyers assess production consistency and evidence quality before moving into repeat orders.
- Synthetic and mineral sources remain useful in cost-sensitive nutrition programs. Microbial options gain preference once suppliers connect product use with ration tolerance and species-specific recovery outcomes.
How do buyers evaluate poultry within livestock?
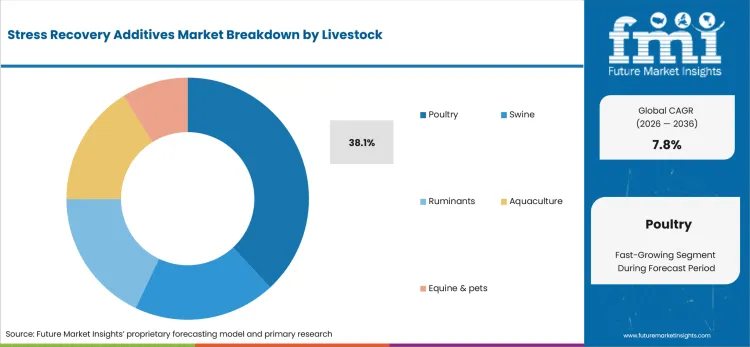
Poultry creates the main demand pool for stress recovery additives. Broiler and breeder diets move through frequent reformulation cycles, so additive performance must support flock uniformity and gut resilience. OECD-FAO projects poultry meat to provide 45% of protein consumed from all meat sources by 2034, strengthening poultry nutrition planning.
- Poultry is expected to represent 38.1% share in 2026, driven by short production cycles and frequent feed program review. Buyers need additives supporting recovery during transport and early growth stages.
- Swine and ruminant programs evaluate additives led by immunity support and nutrient use. Poultry demand leads buyer attention as feed conversion changes can affect margin across large flock programs.
How do buyers assess gut health within function?
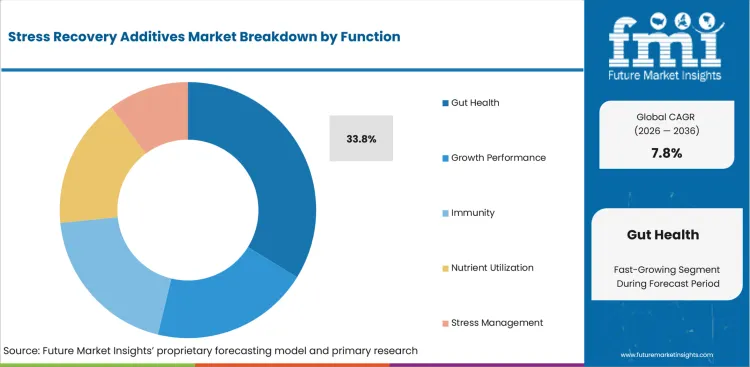
Gut health demand reflects buyer need for better animal resilience after heat exposure and pathogen pressure. Nutrition teams review gut-health claims due to farm records and feed conversion data. Cargill’s 2025 mycotoxin report found 27% of samples exceeded broiler performance thresholds, proving why gut and feed-risk management remain connected.
- Gut health is projected to account for 33.8% share in 2026, influenced by buyers seeking intestinal balance and recovery support across intensive livestock systems. Gut-focused additives help feed teams reduce avoidable performance variation after stress events.
- Immunity and nutrient utilization remain important function lines for stress recovery additives. Gut health leads function choices as intestinal stability affects feed intake and recovery speed across multiple species.
How is direct to feed mills and integrators positioned within sales channel?
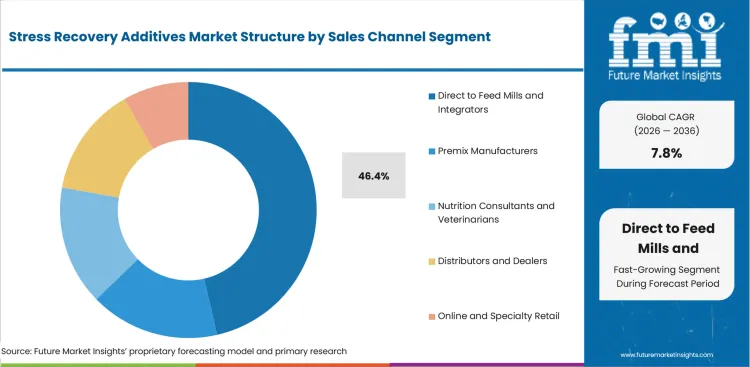
Direct sourcing is central to stress recovery additive buying as technical review and commercial use are closely connected. Feed mills expect suppliers to support trials and delivery reliability before recurring purchase. Alltech’s 2026 feed survey covered 38,837 feed mills across 142 countries, reflecting why supplier access to mill-level decision makers shapes adoption.
- Direct to feed mills and integrators is expected to capture 46.4% share in 2026, driven by technical service needs and account-level formulation support. Suppliers gain commercial strength through documentation and reliable supply during scale-up.
- Distributors and dealers support regional access and trial-stage purchasing. Direct sourcing gains attention once commercial volumes require supplier batch consistency and rapid technical response.
What are the drivers, restraints, and opportunities in the Stress Recovery Additives Market?
Near-term purchases are shaped by animal stress exposure and application discipline outlined below.
- Driver: Feed mills increase stress recovery additive use as animal diets face raw-material variation and higher performance expectations.
- Restraint: Adoption can slow once trial data and farm success measures do not align across buyer teams.
- Opportunity: Species-specific premixes and technical support packages create a practical entry path into mills needing measurable recovery outcomes.
Demand improves as buyers treat stress recovery additives as operating tools rather than simple feed inputs. Additives must protect animal output or simplify quality decisions for nutrition teams. USDA NASS reported combined United States poultry production and sales value at USD 81.7 billion in 2025, up 16% from 2024, reinforcing interest in protecting high-value animal production.
Implementation pressure remains a practical restraint for new suppliers. Feed additive claims must match safety files and farm-trial expectations before buyers expand commercial use. Cargill reported 389,926 mycotoxin analyses across 41 countries in its 2025 report, with 34% of samples exceeding performance-based risk thresholds, reflecting why feed risk evidence can slow additive approval cycles.
Opportunity is stronger across accounts needing recovery tools for transport stress and early-life performance. Suppliers improve account access by pairing product claims with application guidance and repeatable supply. Alltech estimated global feed production reached 1.44 billion metric tons in 2025, up 2.9%, providing additive suppliers a larger base for technical feed programs.
Which country CAGRs are profiled in the Stress Recovery Additives Market?
.webp "Top Country Growth Comparison Stress Recovery Additives Market Cagr (2026 2036)")
| Country | CAGR |
|---|---|
| India | 7.0% |
| China | 5.8% |
| United States | 4.7% |
| South Korea | 4.5% |
| United Kingdom | 4.3% |
| Germany | 4.0% |
| Japan | 3.4% |
Source: Future Market Insights analysis, 2026.
How do country-level CAGRs compare in the Stress Recovery Additives Market?
Country demand in stress recovery additives is expected to be led by commercial feed use and buyer readiness for technical additive programs. India, China and the United States connect additive demand with large animal protein systems and feed mill scale. South Korea, United Kingdom, Germany and Japan connect adoption with animal health review and tighter feed quality expectations. Senior buyers should compare each country by feed program complexity and proof of animal response.
- India is anticipated to scale at 7.0% CAGR from 2026 to 2036, promoted by poultry and meat output needing better feed efficiency. Basic Animal Husbandry Statistics 2025 reported India’s milk production at 247.87 million tonnes in 2024-25. It also reported for egg production reaching 149.11 billion in quantity, giving nutrition suppliers a large livestock base for additive use.
- China is projected to expand at 5.8% CAGR by 2036, helped by animal protein output and feed manufacturing depth. China’s Ministry of Agriculture and Rural Affairs reported combined output of mutton and poultry at 100.72 million tonnes in 2025, up 4.2% year on year that supports nutrition programs being focused on performance protection.
- United States is estimated to increase at 4.7% CAGR by 2036, reinforced by poultry and cattle systems requiring repeatable additive use. USDA NASS reported total broiler output at 9.40 billion birds in 2025. It also reported for live weight production reaching 62.2 billion pounds, attracting feed mill attention to stress recovery tools.
- South Korea is projected to record 4.5% CAGR through 2036, influenced by concentrated poultry and swine programs needing stable feed response. USDA FAS projected Korea chicken production at 925,000 metric tons in 2026, up 0.5% from 2025, providing additive suppliers a measurable poultry base for gut and stress recovery programs.
- United Kingdom is forecast to grow at 4.3% CAGR by 2036, shaped by livestock producers managing feed cost and forage pressure. AHDB forecast total cereals used for animal feed at 13.3 million tonnes in 2025/26. It additionally also reported that wheat use for animal feed increased by 0.3 Mt to 7.1 Mt, promoting buyer attention to diet efficiency.
- Germany is expected to expand at 4.0% CAGR by 2036, aided by established poultry and meat processing systems requiring feed quality discipline. Destatis reported German meat production at 6.9 million tonnes in 2025 and poultry slaughterhouses having processed 697.3 million chickens and ducks, supporting a stable additive review base.
- Japan is projected at 3.4% CAGR through 2036, influenced by livestock consolidation and rising pressure on farm efficiency. USDA FAS reported beef cattle farmers in Japan declined by 7% as of February 1, 2025. The cattle population declined by 3%, increasing interest in inputs impacting productivity under herd management pressure.
Who are the notable companies in the Stress Recovery Additives Market?
Cargill, ADM, dsm-firmenich Animal Nutrition & Health, Kemin Industries, Alltech, Novonesis, Adisseo and Trouw Nutrition are the notable companies shaping stress recovery additive supply and technical service pathways.
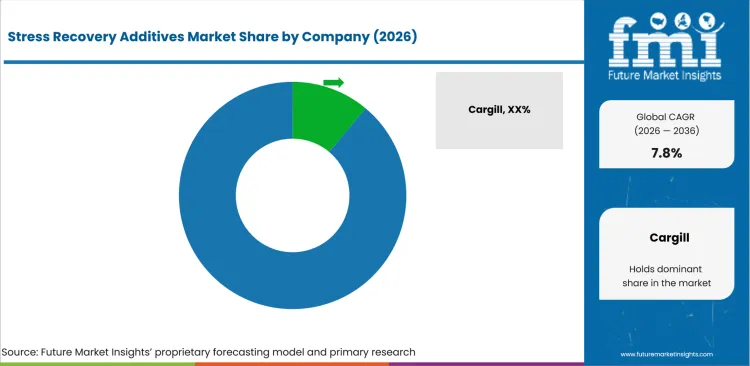
Competition in stress recovery additives is grouped by how buyers want feed additive evidence to work. Cargill and ADM are stronger in accounts needing feed system access and formulation support. dsm-firmenich Animal Nutrition & Health and Novonesis are important for microbial and biosolution programs. Kemin Industries along with Alltech and Adisseo support specialty gut health and stress response needs. Trouw Nutrition supports integrated animal nutrition buyers needing species support and commercial diet service.
- Cargill has an advantage led by mycotoxin management and feed system access. Buyers can connect supplier support with gut health evidence and commercial farm programs.
- ADM supports buyer review based on ingredient breadth and animal nutrition capability. Commercial accounts use ADM’s portfolio once additive selection moves closer to feed mill planning.
- dsm-firmenich Animal Nutrition & Health and Novonesis strengthen competition due to enzyme and biosolution depth. Buyers compare such suppliers depending on enzyme capability and species program support.
- Kemin Industries and Alltech support buyers needing specialty animal nutrition evidence. Feed programs use such suppliers once gut health and recovery claims need technical backing.
- Adisseo and Trouw Nutrition compete driven by additive knowledge and feed program service. Buyers use such suppliers across accounts needing performance support and reliable regional access.
Competitive Benchmarking: Stress Recovery Additives Market
| Company | Gut Health and Recovery Depth | Feed Mill Workflow Alignment | Technical Service Support | Geographic Reach |
|---|---|---|---|---|
| Cargill | High | Strong | Strong | Global |
| ADM | Strong | Strong | Medium | Global |
| dsm-firmenich Animal Nutrition & Health | High | Strong | Strong | Global |
| Kemin Industries | Strong | Medium | Strong | Global |
| Alltech | Strong | Medium | Strong | Global |
| Novonesis | High | Medium | Strong | Global |
| Adisseo | Strong | Strong | Strong | Global |
| Trouw Nutrition | Strong | Strong | Strong | Global |
Source: Future Market Insights competitive analysis, 2026.
Key Developments in the Stress Recovery Additives Market
- In June 2025, Novonesis completed the acquisition of dsm-firmenich’s share of the Feed Enzyme Alliance. The transaction gave Novonesis control over sales and distribution activities linked to animal feed and gut health enzymes.
- In March 2025, Cargill Animal Nutrition & Health presented new mycotoxin and poultry gut-health research for the World Mycotoxin Forum 2025. The update supports feed buyers needing contamination insight and gut-health evidence before commercial adoption.
- In November 2025, Cargill completed a micronutrition facility expansion in Engerwitzdorf, Austria. The site can produce up to 30,000 metric tons per year and fortify up to 200 million metric tons of feed.
Key Players in the Stress Recovery Additives Market
Integrated Feed and Ingredient Suppliers
- Cargill
- ADM
- Trouw Nutrition
Specialty Additive Suppliers
- Kemin Industries
- Alltech
- Adisseo
Biotechnology and Enzyme Specialists
- Novonesis
- dsm-firmenich Animal Nutrition & Health
Stress Recovery Additives Market - Report Scope
| Coverage field | Report scope |
|---|---|
| Market breakdown | Stress Recovery Additives Market Breakdown By Form, Source, Livestock, Function, Sales Channel, and Region |
| Quantitative Units | USD 520.0 million in 2026 to USD 1,102.0 million by 2036, at a CAGR of 7.8% |
| Market Definition | Feed additive inputs used inside commercial diets to support gut stability, immunity, nutrient use and animal recovery after heat, disease, transport or ration stress |
| Regions Covered | North America, Latin America, Europe, East Asia, South Asia and Pacific, Middle East and Africa |
| Countries Covered | United States, China, India, Germany, United Kingdom, Japan, South Korea and 30+ countries |
| Key Companies Profiled | Cargill, ADM, dsm-firmenich Animal Nutrition & Health, Kemin Industries, Alltech, Novonesis, Adisseo, Trouw Nutrition |
| Forecast Period | 2026 to 2036 |
| Approach | Hybrid bottom-up and top-down methodology using additive form, source base, livestock use, function intensity, sales channel structure and country-level animal production indicators |
Source: Future Market Insights analysis, 2026.
Stress Recovery Additives Market - Research Methodology
| Method | Approach |
|---|---|
| Primary Research | FMI analysts gathered input from manufacturers, service providers, technology developers, distributors, end users, procurement teams, and subject-matter experts. Interviews examined purchasing decisions, product or service evaluation, adoption barriers, approval requirements, pricing considerations, and expectations for technical or commercial support. Respondents were also asked what evidence is required before a trial, pilot, or initial order develops into regular purchasing. |
| Desk Research | Desk research covered government statistics, regulatory publications, trade data, industry associations, technical literature, standards, company filings, product information, and official corporate announcements. Sources were reviewed for relevance, publication date, geographic coverage, and consistency with the defined market scope. Claims relating to performance, applications, approvals, capacity, investment, and commercial activity were retained only when supported by credible public evidence. |
| Market Sizing and Forecasting | The market model combined the baseline value with historical performance, segment structure, pricing and volume indicators, adoption levels, company participation, and country-level demand conditions. Forecast assumptions considered economic activity, investment trends, regulatory developments, technology adoption, purchasing cycles, supply availability, and barriers to wider market use. Segment and regional estimates were reconciled before the final market total was calculated. |
| Data Validation | Estimates were checked against multiple independent indicators, including public data, company activity, trade patterns, industry developments, and findings from primary interviews. Validation also tested whether products, services, applications, and company revenues fell within the defined market boundaries. Adjacent categories, unsupported claims, overlapping revenues, and activities without direct market relevance were excluded to reduce double counting and maintain consistency across segments and countries. |
Stress Recovery Additives Market by Segments
Stress Recovery Additives Market segmented by Form:
- Dry
- Liquid
- Pellet
- Premix
- Encapsulated
Stress Recovery Additives Market segmented by Source:
- Synthetic
- Microbial
- Plant/Botanical
- Mineral
- Yeast-based
Stress Recovery Additives Market segmented by Livestock:
- Poultry
- Swine
- Ruminants
- Aquaculture
- Equine & pets
Stress Recovery Additives Market segmented by Function:
- Gut Health
- Growth Performance
- Immunity
- Nutrient Utilization
- Stress Management
Stress Recovery Additives Market segmented by Sales Channel:
- Direct to Feed Mills and Integrators
- Premix Manufacturers
- Nutrition Consultants and Veterinarians
- Distributors and Dealers
- Online and Specialty Retail
Stress Recovery Additives Market by Region:
- North America
- United States
- Canada
- Mexico
- Latin America
- Brazil
- Chile
- Rest of Latin America
- Western Europe
- Germany
- United Kingdom
- Italy
- Spain
- France
- Nordic
- BENELUX
- Rest of Western Europe
- Eastern Europe
- Russia
- Poland
- Hungary
- Balkan & Baltic
- Rest of Eastern Europe
- East Asia
- China
- Japan
- South Korea
- South Asia and Pacific
- India
- ASEAN
- Australia & New Zealand
- Rest of South Asia and Pacific
- Middle East & Africa
- Kingdom of Saudi Arabia
- Other GCC Countries
- Turkiye
- South Africa
- Other African Union
- Rest of Middle East & Africa
Research Sources and Bibliography
- Allende, A., et al. (2026). Update of the list of qualified presumption of safety recommended biological agents intentionally added to food or feed as notified to EFSA. EFSA Journal.
- Alltech. (2025, April 29). 2025 Alltech Agri-Food Outlook shares global feed production survey data. Alltech.
- Alltech. (2026, April 21). 2026 Alltech Agri-Food Outlook shares global feed production survey data. Alltech.
- Agriculture and Horticulture Development Board. (2026, January 29). Animal feed production outlook. Agriculture and Horticulture Development Board.
- Cargill. (2025, March 24). Cargill Animal Nutrition & Health presents new insights on mycotoxins and poultry gut health. Cargill.
- Cargill. (2025, November 4). Cargill Animal Nutrition & Health increases micronutrition production capacity to meet growing customer demand. Cargill.
- Cargill. (2026, March 11). Cargill Micronutrition & Health Solutions publishes 2025 Global Mycotoxin Report highlighting persistent performance risks in animal production. Cargill.
- Department of Animal Husbandry and Dairying. (2025, November 26). Release of Basic Animal Husbandry Statistics 2025 on the Occasion of National Milk Day 2025. Press Information Bureau.
- European Food Safety Authority. (2024, December 4). Online event: Update on FEEDAP guidance on the assessment of the efficacy of feed additives: what’s new. European Food Safety Authority.
- Ministry of Agriculture and Rural Affairs of the People’s Republic of China. (2026, January 22). China’s grain output hits new high in 2025. Ministry of Agriculture and Rural Affairs of the People’s Republic of China.
- Novonesis. (2025, June 2). Deal to acquire dsm-firmenich’s share of the Feed Enzyme Alliance is completed, supporting Novonesis’ growth strategy. Novonesis.
- Organisation for Economic Co-operation and Development & Food and Agriculture Organization of the United Nations. (2025, July 15). OECD-FAO Agricultural Outlook 2025-2034. Organisation for Economic Co-operation and Development.
- Statistics Korea. (2026, May 15). 2025 Livestock Production Cost Survey. Statistics Korea.
- Statistisches Bundesamt. (2026, February 17). Global animal farming, meat production and consumption. Federal Statistical Office of Germany.
- USA Department of Agriculture, Foreign Agricultural Service. (2025, September 22). Poultry and Products Annual: Korea. USA Department of Agriculture.
- USA Department of Agriculture, Foreign Agricultural Service. (2026, January 30). Livestock and Products Annual: Japan. USA Department of Agriculture.
- USA Department of Agriculture, National Agricultural Statistics Service. (2026, April 30). Poultry - Production and Value 2025 Summary. USA Department of Agriculture.
This bibliography is provided for reader reference and is not exhaustive. The full report contains the complete reference list and detailed citations.
This Report Answers
- What is the expected global value of the stress recovery additives market in 2026 and 2036?
- What CAGR is forecast for stress recovery additives during the 2026 to 2036 period?
- Which form category is used to assess dry additive demand in 2026?
- Why do feed mills and livestock integrators buy stress recovery additive products?
- How do microbial sources and gut health functions shape additive selection?
- Which countries are compared in the stress recovery additives market forecast?
- Which companies compete across stress recovery additive supply pathways?
- What additive formats and applications are included within the stress recovery additives definition?
- How does FMI size and forecast stress recovery additive demand across segments and countries?
- What supplier-selection and implementation factors should executives assess?
Frequently Asked Questions
What is driving growth in the stress recovery additives market?
Growth is driven by livestock producers needing additives supporting immunity and feed response during stressful production cycles. Wider focus on animal resilience is expected to support additive adoption across poultry, swine, ruminant, and aquaculture programs.
Why should executives track the stress recovery additives market?
Executives are expected to track this market since additive approval affects animal output and supplier service requirements. Monitoring supplier evidence helps decision-makers manage recovery outcomes and technical support expectations.
What business problem does the stress recovery additives market address?
It helps feed mills and livestock producers reduce avoidable performance loss after stress and ration changes. The market supports buyers needing stronger control over recovery consistency and feed-program reliability.
What should sourcing leaders evaluate before selecting suppliers?
Sourcing leaders are anticipated to compare batch consistency and feed mill handling support before supplier approval. It is also required to review species-specific evidence and technical service capacity across commercial programs.
What can limit return on investment for buyers?
Return on investment can be delayed once additives lack species-specific evidence or require repeated trials after formulation changes. Buyers can reduce this risk through phased validation.
How can suppliers build executive confidence?
Suppliers build confidence are expected to responsive technical support and reliable delivery during commercial scale-up. Clear documentation and practical feed-use guidance can improve buyer trust during supplier review.
Preview the report firsthand - request a free sample
Get SampleGet the brochure for pricing and purchase details.
Get PDFTable of Content
- Key Takeaways
- Market Size and CAGR
- Top Growth Driver
- Fastest Growing Segment
- Leading Region
- Key Companies
- Emerging Opportunities
- Executive Summary
- Global Market Outlook
- Demand-side Trends
- Supply-side Trends
- Technology Roadmap Analysis
- Analysis and Recommendations
- Analyst Perspective (What is happening? Why now? What should investors know?)
- Key Questions Answered
- How large is the market?
- What is the CAGR?
- What are key trends?
- Which region dominates?
- Who are the leaders?
- Market Overview
- Market Coverage / Taxonomy
- Market Definition / Scope / Limitations
- Research Methodology
- Chapter Orientation
- Analytical Lens and Working Hypotheses
- Market Structure, Signals, and Trend Drivers
- Benchmarking and Cross-market Comparability
- Market Sizing, Forecasting, and Opportunity Mapping
- Research Design and Evidence Framework
- Desk Research Programme (Secondary Evidence)
- Expert Input and Fieldwork (Primary Evidence)
- Tooling, Models, and Reference Databases
- Data Engineering and Model Build
- Quality Assurance and Audit Trail
- Market Background
- Market Dynamics (Drivers, Restraints, Opportunity, Trends)
- Scenario Forecast (Optimistic, Likely, Conservative)
- Impact Analysis
- AI Impact
- Sustainability Impact
- Regulatory Impact
- Technology Impact
- Consumer / Buyer Analysis
- Purchase Drivers
- Adoption Barriers
- Buyer Journey
- Opportunity Map Analysis
- Product Life Cycle Analysis
- Supply Chain Analysis
- Investment Feasibility Matrix
- Value Chain Analysis
- PESTLE and Porter's Analysis
- Regulatory Landscape
- Regional Parent Market Outlook
- Production and Consumption Statistics
- Import and Export Statistics
- Global Market Analysis and Forecast, 2021 to 2036
- Historical Market Size Value (USD Million) & Volume (Unit) Analysis, 2021 to 2025
- Current and Future Market Size Value (USD Million) & Volume (Unit) Projections, 2026 to 2036
- Y-o-Y Growth Trend Analysis
- Absolute $ Opportunity Analysis
- Global Market Pricing Analysis, 2021 to 2036
- Global Market Analysis and Forecast, By Form, 2021 to 2036
- Introduction / Key Findings
- Historical Market Size Value (USD Million) & Volume (Unit) Analysis By Form, 2021 to 2025
- Current and Future Market Size Value (USD Million) & Volume (Unit) Analysis and Forecast By Form, 2026 to 2036
- Dry
- Liquid
- Pellet
- Premix
- Encapsulated
- Dry
- Y-o-Y Growth Trend Analysis By Form, 2021 to 2025
- Absolute $ Opportunity Analysis By Form, 2026 to 2036
- Global Market Analysis and Forecast, By Source, 2021 to 2036
- Introduction / Key Findings
- Historical Market Size Value (USD Million) & Volume (Unit) Analysis By Source, 2021 to 2025
- Current and Future Market Size Value (USD Million) & Volume (Unit) Analysis and Forecast By Source, 2026 to 2036
- Microbial
- Synthetic
- Plant-Botanical
- Mineral
- Yeast-based
- Microbial
- Y-o-Y Growth Trend Analysis By Source, 2021 to 2025
- Absolute $ Opportunity Analysis By Source, 2026 to 2036
- Global Market Analysis and Forecast, By Livestock, 2021 to 2036
- Introduction / Key Findings
- Historical Market Size Value (USD Million) & Volume (Unit) Analysis By Livestock, 2021 to 2025
- Current and Future Market Size Value (USD Million) & Volume (Unit) Analysis and Forecast By Livestock, 2026 to 2036
- Poultry
- Swine
- Ruminants
- Aquaculture
- Equine & pets
- Poultry
- Y-o-Y Growth Trend Analysis By Livestock, 2021 to 2025
- Absolute $ Opportunity Analysis By Livestock, 2026 to 2036
- Global Market Analysis and Forecast, By Function, 2021 to 2036
- Introduction / Key Findings
- Historical Market Size Value (USD Million) & Volume (Unit) Analysis By Function, 2021 to 2025
- Current and Future Market Size Value (USD Million) & Volume (Unit) Analysis and Forecast By Function, 2026 to 2036
- Gut Health
- Growth Performance
- Immunity
- Nutrient Utilization
- Stress Management
- Gut Health
- Y-o-Y Growth Trend Analysis By Function, 2021 to 2025
- Absolute $ Opportunity Analysis By Function, 2026 to 2036
- Global Market Analysis and Forecast, By Sales Channel, 2021 to 2036
- Introduction / Key Findings
- Historical Market Size Value (USD Million) & Volume (Unit) Analysis By Sales Channel, 2021 to 2025
- Current and Future Market Size Value (USD Million) & Volume (Unit) Analysis and Forecast By Sales Channel, 2026 to 2036
- Direct to Feed Mills and Integrators
- Premix Manufacturers
- Nutrition Consultants and Veterinarians
- Distributors and Dealers
- Online and Specialty Retail
- Direct to Feed Mills and Integrators
- Y-o-Y Growth Trend Analysis By Sales Channel, 2021 to 2025
- Absolute $ Opportunity Analysis By Sales Channel, 2026 to 2036
- Global Market Analysis and Forecast, By Region, 2021 to 2036
- Introduction
- Historical Market Size Value (USD Million) & Volume (Unit) Analysis By Region, 2021 to 2025
- Current Market Size Value (USD Million) & Volume (Unit) Analysis and Forecast By Region, 2026 to 2036
- North America
- Latin America
- Western Europe
- Eastern Europe
- East Asia
- South Asia and Pacific
- Middle East & Africa
- Market Attractiveness Analysis By Region
- North America Market Analysis and Forecast, By Country, 2021 to 2036
- Historical Market Size Value (USD Million) & Volume (Unit) Trend Analysis By Market Taxonomy, 2021 to 2025
- Market Size Value (USD Million) & Volume (Unit) Forecast By Market Taxonomy, 2026 to 2036
- By Country
- USA
- Canada
- Mexico
- By Form
- By Source
- By Livestock
- By Function
- By Sales Channel
- By Country
- Market Attractiveness Analysis
- By Country
- By Form
- By Source
- By Livestock
- By Function
- By Sales Channel
- Key Takeaways
- Latin America Market Analysis and Forecast, By Country
- Historical Market Size Value (USD Million) & Volume (Unit) Trend Analysis By Market Taxonomy, 2021 to 2025
- Market Size Value (USD Million) & Volume (Unit) Forecast By Market Taxonomy, 2026 to 2036
- By Country
- Brazil
- Chile
- Rest of Latin America
- By Form
- By Source
- By Livestock
- By Function
- By Sales Channel
- By Country
- Market Attractiveness Analysis
- By Country
- By Form
- By Source
- By Livestock
- By Function
- By Sales Channel
- Key Takeaways
- Western Europe Market Analysis and Forecast, By Country
- Historical Market Size Value (USD Million) & Volume (Unit) Trend Analysis By Market Taxonomy, 2021 to 2025
- Market Size Value (USD Million) & Volume (Unit) Forecast By Market Taxonomy, 2026 to 2036
- By Country
- Germany
- UK
- Italy
- Spain
- France
- Nordic
- BENELUX
- Rest of Western Europe
- By Form
- By Source
- By Livestock
- By Function
- By Sales Channel
- By Country
- Market Attractiveness Analysis
- By Country
- By Form
- By Source
- By Livestock
- By Function
- By Sales Channel
- Key Takeaways
- Eastern Europe Market Analysis and Forecast, By Country
- Historical Market Size Value (USD Million) & Volume (Unit) Trend Analysis By Market Taxonomy, 2021 to 2025
- Market Size Value (USD Million) & Volume (Unit) Forecast By Market Taxonomy, 2026 to 2036
- By Country
- Russia
- Poland
- Hungary
- Balkan & Baltic
- Rest of Eastern Europe
- By Form
- By Source
- By Livestock
- By Function
- By Sales Channel
- By Country
- Market Attractiveness Analysis
- By Country
- By Form
- By Source
- By Livestock
- By Function
- By Sales Channel
- Key Takeaways
- East Asia Market Analysis and Forecast, By Country
- Historical Market Size Value (USD Million) & Volume (Unit) Trend Analysis By Market Taxonomy, 2021 to 2025
- Market Size Value (USD Million) & Volume (Unit) Forecast By Market Taxonomy, 2026 to 2036
- By Country
- China
- Japan
- South Korea
- By Form
- By Source
- By Livestock
- By Function
- By Sales Channel
- By Country
- Market Attractiveness Analysis
- By Country
- By Form
- By Source
- By Livestock
- By Function
- By Sales Channel
- Key Takeaways
- South Asia and Pacific Market Analysis and Forecast, By Country
- Historical Market Size Value (USD Million) & Volume (Unit) Trend Analysis By Market Taxonomy, 2021 to 2025
- Market Size Value (USD Million) & Volume (Unit) Forecast By Market Taxonomy, 2026 to 2036
- By Country
- India
- ASEAN
- Australia & New Zealand
- Rest of South Asia and Pacific
- By Form
- By Source
- By Livestock
- By Function
- By Sales Channel
- By Country
- Market Attractiveness Analysis
- By Country
- By Form
- By Source
- By Livestock
- By Function
- By Sales Channel
- Key Takeaways
- Middle East & Africa Market Analysis and Forecast, By Country
- Historical Market Size Value (USD Million) & Volume (Unit) Trend Analysis By Market Taxonomy, 2021 to 2025
- Market Size Value (USD Million) & Volume (Unit) Forecast By Market Taxonomy, 2026 to 2036
- By Country
- Kingdom of Saudi Arabia
- Other GCC Countries
- Türkiye
- South Africa
- Other African Union
- Rest of Middle East & Africa
- By Form
- By Source
- By Livestock
- By Function
- By Sales Channel
- By Country
- Market Attractiveness Analysis
- By Country
- By Form
- By Source
- By Livestock
- By Function
- By Sales Channel
- Key Takeaways
- Key Countries Market Analysis
- USA
- Pricing Analysis
- Market Share Analysis, 2025
- By Form
- By Source
- By Livestock
- By Function
- By Sales Channel
- Canada
- Pricing Analysis
- Market Share Analysis, 2025
- By Form
- By Source
- By Livestock
- By Function
- By Sales Channel
- Mexico
- Pricing Analysis
- Market Share Analysis, 2025
- By Form
- By Source
- By Livestock
- By Function
- By Sales Channel
- Brazil
- Pricing Analysis
- Market Share Analysis, 2025
- By Form
- By Source
- By Livestock
- By Function
- By Sales Channel
- Chile
- Pricing Analysis
- Market Share Analysis, 2025
- By Form
- By Source
- By Livestock
- By Function
- By Sales Channel
- Germany
- Pricing Analysis
- Market Share Analysis, 2025
- By Form
- By Source
- By Livestock
- By Function
- By Sales Channel
- UK
- Pricing Analysis
- Market Share Analysis, 2025
- By Form
- By Source
- By Livestock
- By Function
- By Sales Channel
- Italy
- Pricing Analysis
- Market Share Analysis, 2025
- By Form
- By Source
- By Livestock
- By Function
- By Sales Channel
- Spain
- Pricing Analysis
- Market Share Analysis, 2025
- By Form
- By Source
- By Livestock
- By Function
- By Sales Channel
- France
- Pricing Analysis
- Market Share Analysis, 2025
- By Form
- By Source
- By Livestock
- By Function
- By Sales Channel
- India
- Pricing Analysis
- Market Share Analysis, 2025
- By Form
- By Source
- By Livestock
- By Function
- By Sales Channel
- ASEAN
- Pricing Analysis
- Market Share Analysis, 2025
- By Form
- By Source
- By Livestock
- By Function
- By Sales Channel
- Australia & New Zealand
- Pricing Analysis
- Market Share Analysis, 2025
- By Form
- By Source
- By Livestock
- By Function
- By Sales Channel
- China
- Pricing Analysis
- Market Share Analysis, 2025
- By Form
- By Source
- By Livestock
- By Function
- By Sales Channel
- Japan
- Pricing Analysis
- Market Share Analysis, 2025
- By Form
- By Source
- By Livestock
- By Function
- By Sales Channel
- South Korea
- Pricing Analysis
- Market Share Analysis, 2025
- By Form
- By Source
- By Livestock
- By Function
- By Sales Channel
- Russia
- Pricing Analysis
- Market Share Analysis, 2025
- By Form
- By Source
- By Livestock
- By Function
- By Sales Channel
- Poland
- Pricing Analysis
- Market Share Analysis, 2025
- By Form
- By Source
- By Livestock
- By Function
- By Sales Channel
- Hungary
- Pricing Analysis
- Market Share Analysis, 2025
- By Form
- By Source
- By Livestock
- By Function
- By Sales Channel
- Kingdom of Saudi Arabia
- Pricing Analysis
- Market Share Analysis, 2025
- By Form
- By Source
- By Livestock
- By Function
- By Sales Channel
- Türkiye
- Pricing Analysis
- Market Share Analysis, 2025
- By Form
- By Source
- By Livestock
- By Function
- By Sales Channel
- South Africa
- Pricing Analysis
- Market Share Analysis, 2025
- By Form
- By Source
- By Livestock
- By Function
- By Sales Channel
- USA
- Market Structure Analysis
- Competition Dashboard
- Competition Benchmarking
- Market Share Analysis of Top Players
- By Regional
- By Form
- By Source
- By Livestock
- By Function
- By Sales Channel
- Emerging Startups
- Innovation Benchmarking
- Competition Analysis
- Competition Deep Dive
- Cargill
- Overview
- Product Portfolio
- Profitability by Market Segments (Product/Region/Sales Channel)
- Sales Footprint
- Strategy Overview
- Marketing Strategy
- Product Strategy
- Channel Strategy
- ADM
- dsm-firmenich Animal Nutrition & Health
- Kemin Industries
- Alltech
- Novonesis
- Adisseo
- Trouw Nutrition
- Cargill
- Case Studies
- Success Stories
- Recent Developments
- Competition Deep Dive
- Assumptions & Acronyms Used


