

- Market Size (2026)
- USD 460.0 Mn
- Forecast (2036)
- USD 956.9 Mn
- CAGR (2026 to 2036)
- 7.6%
How big is the Weaning Stress Additives market in 2026?
USD 460.0 million in 2026 and USD 956.9 million by 2036 at a 7.6% CAGR.
Demand in the weaning stress additives market is anticipated to push valuation from USD 460.0 million in 2026 to USD 956.9 million by 2036, expanding at a 7.6% CAGR over the forecast period. Post-weaning intake disruption is pushing nutrition teams to treat additives as a control point inside nursery diets. USDA NASS reported that 33.5 million pigs were weaned on United States farms between March and May 2026. The production base keeps animal feed additive planning tied to early-life feed performance reviews and ration checks. Feed buyers use the category when diet changes must be supported by mill-ready handling evidence.
India is estimated to advance through livestock expansion and premix-channel conversion, while China is projected to grow through dense pig output and organized feed programs. The United States, Germany and the United Kingdom are expected to expand through traceability files, safety documentation and trial evidence inside regulated feed channels. EFSA implemented updated feed-additive efficacy guidance from 1 December 2024 for application evidence reviews. The guidance places microbial feed additive reviews closer to study design and claim support during supplier review.
Feed mills and swine integrators are expected to purchase these additives to protect feed intake during diet change. Premix manufacturers use the category to convert gut-health claims into dosing records and batch instructions. FDA animal-food ingredient guidance issued in January 2026 keeps ingredient identity and intended use inside supplier qualification. Documentation needs make feed premix planning more visible in accounts that need repeatable nursery diets and lower rework after farm trials. The adoption case therefore stays tied to evidence depth and verified mill handling fit across trial accounts.
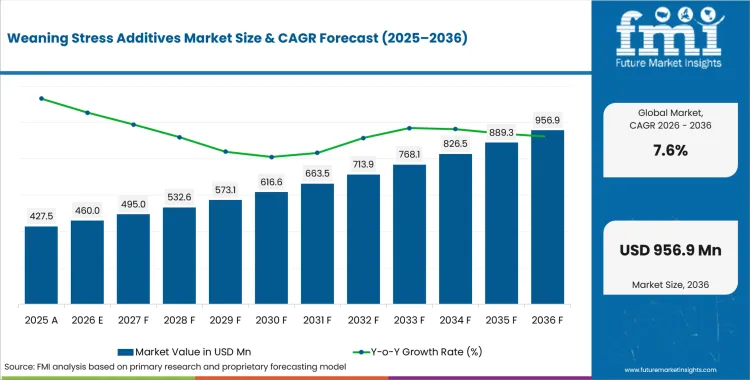
Summary of the Weaning Stress Additives Market
| Market Signal | Commercial Impact |
|---|---|
| Demand and Growth Drivers | Feed mills are expected to treat weaning additives as ration-risk tools in nursery diets. Trial documentation is projected to set the pace for repeat purchasing.
|
| Product and Segment View | Dry formats and microbial sources are projected to lead their parent categories in 2026. Piglet applications are estimated to frame the main livestock screen.
|
| Geography and Growth Outlook | India and China are projected to form the higher-growth tier in the country set. Established feed systems are expected to expand under stricter supplier review cycles.
|
| Competitive Landscape | Competition is moderately concentrated around animal nutrition portfolios and bioscience capability. Procurement reviews are expected to center on documentation quality and mill-service continuity.
|
| Analyst Perspective | Weaning stress additives should be assessed by ability to make nursery diet transitions more repeatable. Suppliers with considerable share are expected to translate gut-health claims into inclusion guidance, trial endpoints and practical mill handling proof.
|
How is the Weaning Stress Additives Market segmented?
The weaning stress additives industry is segmented by form, source, livestock, function, and region.
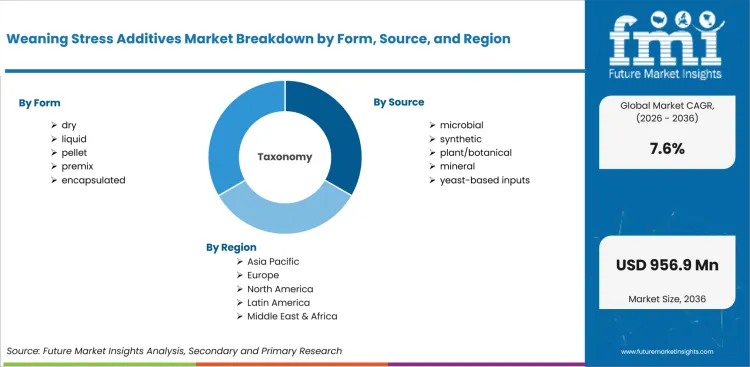
The weaning stress additives market is segmented by form, source, livestock, function, and region. By form, the market covers dry, liquid, pellet, premix, and encapsulated formats. By source, it covers synthetic, microbial, plant/botanical, mineral, and yeast-based inputs. By livestock, it covers swine, sows, piglets, finishers, and other swine. By function, it covers gut health, growth performance, immunity, nutrient utilization, and stress management. Regional coverage includes North America, Europe, East Asia, South Asia, Latin America, South Asia and Pacific, and Middle East and Africa. The same scope aligns with animal feed probiotic demand across technical feed channels and nursery-ration programs.
How does dry format shape demand within the form category?
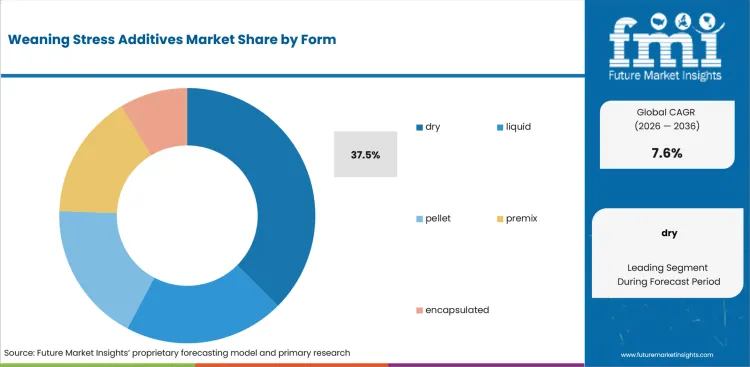
Dry-format additives fit feed mills that already run powder and premix dosing lines for nursery rations. Storage control and batch repeatability influence supplier screening during weaning programs and recurring account approval. FDA stated in January 2026 that animal food ingredients use food additive petitions and GRAS notices for premarket review. The framework makes product identity and intended use part of supplier qualification before additive trials move into routine production.
- By form, dry is projected to account for 37.5% share in 2026 driven by premix compatibility and lower spill risk. Feed mills use dry handling records to assess blend behavior before the product enters recurring nursery diets and warehouse audits.
- Dry formats are witnessing demand from feed mills owing to cleaner dosing behavior and easier inventory control during ration changes. Nutrition teams comparing feed palatability enhancer assessments need proof that format choice supports intake without creating extra mill handling.
What supports demand for microbial source choices?
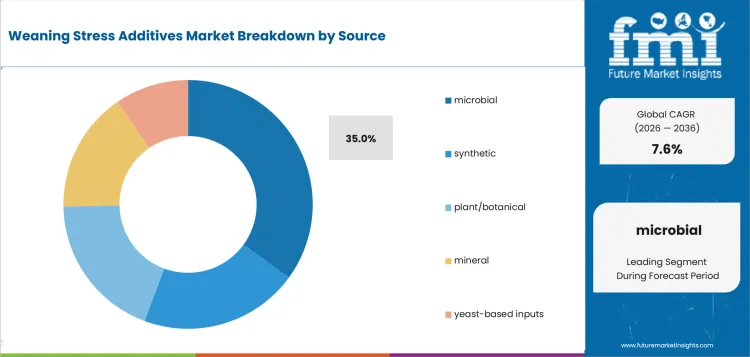
Microbial source decisions are shaped by strain identity and claim evidence in post-weaning gut programs. EFSA noted in December 2024 that updated efficacy guidance covers study types and reporting principles for feed additive dossiers. The review environment pushes microbial suppliers to show how strains behave in feed and how evidence supports nursery-ration decisions.
- By source, microbial is estimated to hold 35.0% share in 2026 supported by gut microbiota positioning and trial-ready supplier evidence. EFSA guidance keeps evidence planning visible before farm use and dossier preparation across documented additive accounts.
- Demand for microbial inputs is expected to grow among swine nutritionists attributable to strain documentation and post-weaning digestive support. These teams use probiotic strain selection to judge whether microbial additives fit supplier scorecards and trial protocols.
How do nutrition teams evaluate piglets within livestock demand?
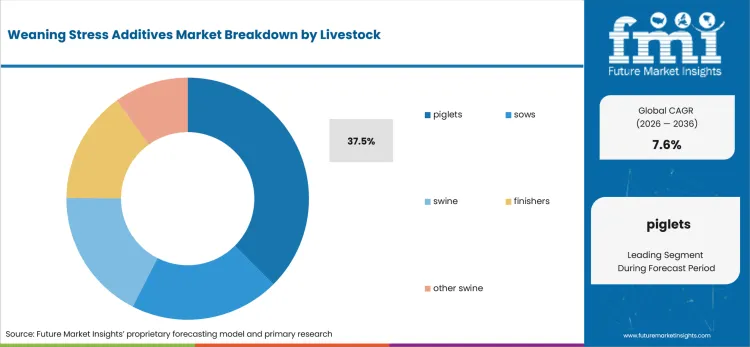
Piglet nutrition carries a narrow adjustment window after sow separation and solid-feed transition across nursery programs. USDA NASS reported 11.87 pigs saved per litter during March to May 2026 for United States farms. The productivity figure raises the cost of inconsistent nursery diets during tight early-life feeding windows. Swine integrators therefore look for additives that support intake recovery and reduce trial uncertainty after weaning. Supplier evidence must also fit farm-service routines and formal feed-mill approval documents used by procurement teams.
- By livestock, piglets are forecast to capture 37.5% share in 2026 attributable to nursery-transition risk and early-feed intake pressure. United States productivity records keep piglet throughput visible in additive planning and technical-service reviews.
- Swine integrators are increasingly purchasing piglet-focused additives led by the need for smoother movement from creep feed to nursery rations. Products linked to natural feed additive sourcing need evidence that supports daily gain and stool consistency after diet changes.
What drives gut health within the function category?
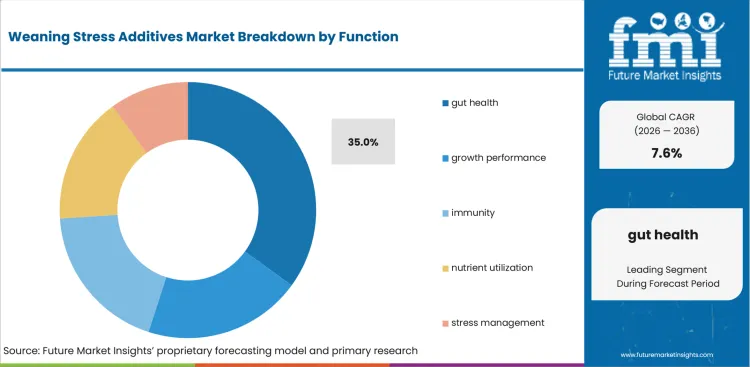
Gut-health claims become practical once farms link weaning stress to intake shifts and manure consistency. Kemin published October 2024 guidance on post-weaning piglets that highlighted gut-health support across pig production stages. Feed additive manufacturers need proof that claims translate into nursery instructions and farm-advisor records before account expansion.
- By function, gut health is likely to represent 35.0% share in 2026 owing to digestive disruption after weaning and supplier focus on nursery-ration outcomes. Kemin guidance on post-weaning piglets keeps evidence quality central during product review and trial design.
- Purchase activity for gut-health products is anticipated to rise driven by farm interest in steadier intake and fewer ration corrections. Additive programs need inclusion guidance and compatibility proof before nutritionists approve broader farm use and recurring premix ordering.
What are the drivers, restraints, and opportunities in the Weaning Stress Additives Market?
Near-term purchases are being shaped by post-weaning feed-intake control, trial-documentation burden, and premix-service expansion outlined below.
- Driver: Energy-sensitive nursery diets are expected to push feed mills toward additives that support intake recovery after weaning.
- Restraint: Adoption is anticipated to slow in farms that lack trial endpoints and clear ownership for success measures.
- Opportunity: Species-specific premix bundles are projected to open account access for additives used in post-weaning troubleshooting.
Swine operations are expected to raise interest in additives that make early nursery diets easier to manage. EFSA stated in May 2026 that feed additive dossiers need information on identity and conditions of use. Documentation pressure is therefore expected to make claims more dependent on study design and use instructions. Feed mills need that evidence before shifting trial products into recurring rations and service-led purchasing programs.
Farm managers are likely to delay purchase decisions if nursery trials lack clear endpoints for intake and stool consistency. FDA animal-food ingredient information from January 2026 describes food additive petitions and GRAS notices for animal food ingredients. Regulatory expectations are expected to keep manufacturers focused on intended use and safety support. Ingredient identity remains central during qualification and feed-mill purchasing decisions across regulated additive accounts. Clear trial ownership reduces account friction before repeat orders and broader supplier approval decisions.
Service-led selling is projected to convert the restraint into an account route for premix manufacturers and nutrition consultants. Trouw Nutrition's swine-focused technical service teams provide gut-health and performance content directly to nursery accounts. The service model supports phytogenic feed additive programs where farm teams need evidence translation before repeat ordering.
Which country CAGRs are profiled in the Weaning Stress Additives Market?
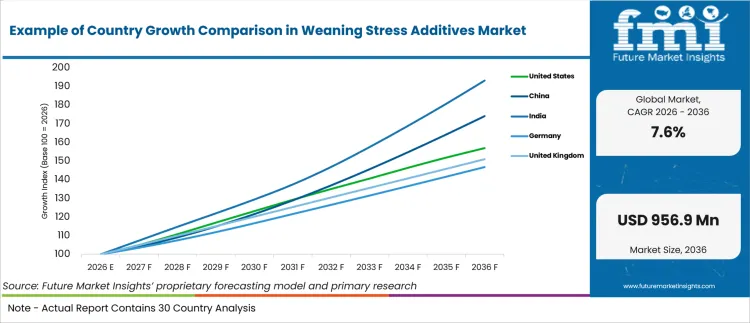
| Country | CAGR |
|---|---|
| United States | 4.6% |
| China | 5.7% |
| India | 6.8% |
| Germany | 3.9% |
| United Kingdom | 4.2% |
| Japan | 3.3% |
| South Korea | 4.4% |
Source: FMI's proprietary forecasting model and primary research
How do country-level CAGRs compare in the Weaning Stress Additives Market?
Country prospects separate around livestock scale and premix service reach across documentation-led feed accounts. India is projected at 6.8% CAGR and China is forecast at 5.7% CAGR under denser livestock output. The United States is anticipated at 4.6% CAGR and South Korea is estimated at 4.4% CAGR under technical farm screening. The United Kingdom is forecast at 4.2% CAGR and Germany is estimated at 3.9% CAGR under documentation-heavy routines. Japan is predicted at 3.3% CAGR due to consolidation and strict supplier review within animal feed accounts. The outlook supports eubiotics demand in accounts that need gut-health claims linked to usable evidence.
- United States swine systems keep weaning additives inside measurable nursery programs and documented feed conversion reviews. The United States is projected to grow at 4.6% CAGR through 2036 driven by high piglet throughput and structured feed trials. USDA NASS reported in June 2026 that United States farms held 73.7 million hogs and pigs on June 1 2026. The herd base sustains recurring demand for additives that protect feed intake after weaning and fit traceable feed programs. Farm service teams also screen products for lot records and practical instructions before moving beyond first-trial use.
- China remains a dense pig-production system that pushes nutrition teams toward repeatable nursery diets and organized feed service. China's weaning stress additives outlook is anticipated to advance at 5.7% CAGR over the assessment period supported by organized swine output. National Bureau of Statistics of China reported in February 2026 that 719.73 million pigs were slaughtered in 2025. The scale raises the value of additives that reduce feed disruption across integrated farms. Domestic registration and distributor reach remain practical hurdles for foreign suppliers seeking recurring use.
- India combines animal protein demand with uneven feed-service access across regional livestock systems and dealer-led channels. Adoption of weaning stress additives in India is estimated to expand at 6.8% CAGR through 2036 reinforced by premix conversion and farm advisory expansion. Press Information Bureau reported in November 2025 that India had 9.06 million pigs in the latest basic animal husbandry release. The smaller pig base makes targeted nursery programs more dependent on dealer training and localized advice. Premix suppliers need dealer education before recurring orders scale beyond trial herds and regional feed accounts.
- German feed accounts operate under documentation-heavy livestock systems and narrower tolerance for unproven feed claims. The German sector is projected to record 3.9% CAGR during the assessment period shaped by regulated feed practice and farm consolidation. Destatis reported in August 2025 that holdings with pigs totaled 15,600 in May 2025. Farm consolidation makes each account more valuable and raises the service burden on additive suppliers. Suppliers need EU dossier support before farm trials move into feed-mill schedules and recurring nursery rations.
- United Kingdom pig farms show stable herd volume and tighter breeding-herd pressure in commercial pork systems. Weaning stress additive demand in the United Kingdom is forecast to rise at 4.2% CAGR over the forecast period driven by nursery performance scrutiny. Department for Environment, Food and Rural Affairs reported in December 2025 that the United Kingdom had 4.7 million pigs in June 2025. The herd base supports targeted additive use where producers track piglet performance after separation. Farm assurance schemes also raise expectations for traceable ingredients and documented supplier controls during account review.
- Japan presents a smaller and disciplined livestock base shaped by farm consolidation and labor pressure. In Japan, weaning stress additive demand is predicted to advance at 3.3% CAGR through 2036 influenced by farm consolidation and distributor-led service. Ministry of Agriculture, Forestry and Fisheries stated in April 2025 that agricultural management entities are expected to halve in 10 years. Consolidation raises the need for feed products that simplify service visits and documentation for producers. Farm cooperatives need clear guidance before adding unfamiliar additives to nursery programs and producer records. Technical translation and distributor training shape whether products move beyond trial use in commercial farms.
- South Korea concentrates pig production inside technically managed farms that watch feed costs and herd productivity closely. The South Korea market is estimated to post 4.4% CAGR over the forecast period supported by dense commercial farms and structured feed programs. The Ministry of Data and Statistics recorded 10.716 million pigs in the first quarter of 2026 across national livestock holdings .The herd scale supports additives that prove value during nursery diets and feed conversion reviews.
Who are the notable companies in the Weaning Stress Additives Market?
Cargill, ADM, dsm-firmenich, Kemin Industries, Alltech, Novonesis, Adisseo, and Trouw Nutrition are the notable companies shaping this market.
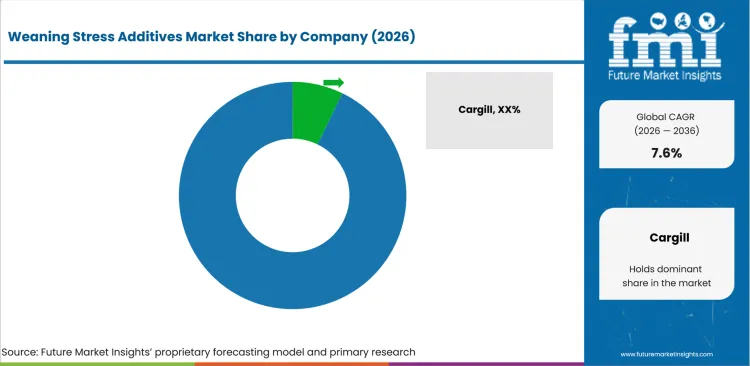
The competitive base is moderately concentrated due to animal nutrition scale and feed-additive documentation skill. Established multinational players hold broader portfolio coverage and technical-service networks across feed mill accounts. Regional specialists compete in narrower accounts where price control and farm support decide trial approval. Competition centers on ingredient evidence and handling proof over brand claims alone during supplier review.
- Portfolio breadth shapes the competitive role for Cargill and ADM in weaning stress additives. Feed mills use these companies for additive access and ration support in accounts that prefer fewer qualification steps. Their practical advantage is the ability to connect technical ingredients to premix programs and service-led purchasing routines.
- Bioscience credibility gives Novonesis and dsm-firmenich a distinct route into microbial and enzyme-led programs. Nutrition teams use these companies for strain evidence and formulation support suited to formal claim review. Their role is visible in accounts that want gut-health claims translated into documented nursery trials.
- Gut-health education separates Kemin Industries and Alltech in farm-facing settings that need practical ration support before approval. Kemin brings post-weaning gut-health content and Alltech adds feed-account reach through nutrition service networks. These companies suit farms that need advisory clarity before approving recurring additive use across nursery programs.
- Protected nutrient and service depth support Adisseo and Trouw Nutrition in formulation-heavy accounts that need documented gut-health inputs. Adisseo offers butyrate-based feed additives and Trouw Nutrition brings premix service access for commercial feed teams. The group is better placed where suppliers must join product evidence to feed-mill support and local troubleshooting.
Competitive Benchmarking: Weaning Stress Additives Market
| Company | Weaning-Relevance Fit | Documentation Support | Premix and Mill Fit | Service Reach |
|---|---|---|---|---|
| Cargill | High | Strong | High | Global |
| ADM | Medium | Strong | High | Global |
| dsm-firmenich | High | Strong | Medium | Global |
| Kemin Industries | Strong | Strong | Strong | Global |
| Alltech | Strong | Medium | Strong | Global |
| Novonesis | High | Strong | Medium | Global |
| Adisseo | High | Strong | Strong | Global |
| Trouw Nutrition | Strong | Strong | High | Global |
Source: Future Market Insights competitive analysis, 2026. Ratings reflect relative portfolio relevance and workflow fit. Service capability and geographic reach shape the remaining comparison.
Key Developments in the Weaning Stress Additives Market
- In June 2025, Novonesis completed the acquisition of dsm-firmenich's share of the Feed Enzyme Alliance. Novonesis stated that regulatory approvals had been achieved before the deal closed across relevant jurisdictions. The development points to tighter control over feed enzyme sales and distribution channels for animal nutrition accounts.
- In September 2025, ADM and Alltech announced a North American animal feed joint venture for commercial feed accounts. Alltech stated that the venture would combine United States-based Hubbard Feeds and Canada-based Masterfeeds businesses.
- In March 2026, Adisseo launched Sanion Tetra 50 and Sanion Tetra 70 for animal nutrition. The protected sodium butyrate additives were presented for gut-health and animal-performance support across feed applications.
- In November 2025, Cargill completed a capacity expansion at its Engerwitzdorf micronutrition facility in Austria. The site was upgraded to produce 30,000 metric tons per year after capacity increased by 50%. The development points to greater supply security for micronutrition inputs used in feed programs.
Key Players in the Weaning Stress Additives Market
Integrated feed and premix suppliers
- Cargill
- ADM
- Trouw Nutrition
Specialty additive suppliers
- Kemin Industries
- Alltech
- Adisseo
Bioscience and microbial additive suppliers
- dsm-firmenich
- Novonesis
Weaning Stress Additives Market - Report Scope
| Coverage field | Report scope |
|---|---|
| Market breakdown | Weaning Stress Additives Market Breakdown By Form, Source, Livestock, Function, and Region |
| Market Definition | Weaning stress additives are feed inputs used in nursery diets to support intake recovery and gut stability after separation from the dam. |
| Regions Covered | North America, Latin America, Europe, East Asia, South Asia and Pacific, Middle East and Africa |
| Countries Covered | United States, China, India, Germany, United Kingdom, Japan, South Korea and 30+ countries |
| Key Companies Profiled | Cargill, ADM, dsm-firmenich, Kemin Industries, Alltech, Novonesis, Adisseo, Trouw Nutrition |
| Forecast Period | 2026 to 2036 |
| Approach | Hybrid bottom-up and top-down methodology using nursery ration adoption, swine integration intensity, feed-mill trial conversion, supplier portfolio depth, and country livestock indicators |
Source: Future Market Insights - analysis driven by proprietary forecasting models and primary research
Weaning Stress Additives Market - Research Methodology
| Method | Approach |
| Primary Research | FMI analysts gathered input from manufacturers, service providers, technology developers, distributors, end users, procurement teams, and subject-matter experts. Interviews examined purchasing decisions, product or service evaluation, adoption barriers, approval requirements, pricing considerations, and expectations for technical or commercial support. Respondents were also asked what evidence is required before a trial, pilot, or initial order develops into regular purchasing. |
| Desk Research | Desk research covered government statistics, regulatory publications, trade data, industry associations, technical literature, standards, company filings, product information, and official corporate announcements. Sources were reviewed for relevance, publication date, geographic coverage, and consistency with the defined market scope. Claims relating to performance, applications, approvals, capacity, investment, and commercial activity were retained only when supported by credible public evidence. |
| Market Sizing and Forecasting | The market model combined the baseline value with historical performance, segment structure, pricing and volume indicators, adoption levels, company participation, and country-level demand conditions. Forecast assumptions considered economic activity, investment trends, regulatory developments, technology adoption, purchasing cycles, supply availability, and barriers to wider market use. Segment and regional estimates were reconciled before the final market total was calculated. |
| Data Validation | Estimates were checked against multiple independent indicators, including public data, company activity, trade patterns, industry developments, and findings from primary interviews. Validation also tested whether products, services, applications, and company revenues fell within the defined market boundaries. Adjacent categories, unsupported claims, overlapping revenues, and activities without direct market relevance were excluded to reduce double counting and maintain consistency across segments and countries. |
Weaning Stress Additives Market by Segments
Weaning Stress Additives Market segmented by Form:
- Dry
- Liquid
- Pellet
- Premix
- Encapsulated
Weaning Stress Additives Market segmented by Source:
- Synthetic
- Microbial
- Plant/Botanical
- Mineral
- Yeast-based
Weaning Stress Additives Market segmented by Livestock:
- Swine
- Sows
- Piglets
- Finishers
- Other Swine
Weaning Stress Additives Market segmented by Function:
- Gut Health
- Growth Performance
- Immunity
- Nutrient Utilization
- Stress Management
Weaning Stress Additives Market by Region:
- North America
- United States
- Canada
- Mexico
- Latin America
- Brazil
- Chile
- Rest of Latin America
- Western Europe
- Germany
- United Kingdom
- Italy
- Spain
- France
- Nordic
- BENELUX
- Rest of Western Europe
- Eastern Europe
- Poland
- Hungary
- Balkan and Baltic
- Rest of Eastern Europe
- East Asia
- China
- Japan
- South Korea
- South Asia and Pacific
- India
- ASEAN
- Australia and New Zealand
- Rest of South Asia and Pacific
- Middle East and Africa
- Kingdom of Saudi Arabia
- Other GCC Countries
- Turkiye
- South Africa
- Other African Union
- Rest of Middle East and Africa
Research Sources and Bibliography
- USA Department of Agriculture, National Agricultural Statistics Service. (2026, June). United States Hog Inventory Down Slightly. USDA NASS.
- USA Food and Drug Administration. (2026, January). Animal Food Ingredients. FDA Center for Veterinary Medicine.
- European Food Safety Authority. (2024, December). Online event: Update on FEEDAP guidance on the assessment of the efficacy of feed additives: what’s new. EFSA.
- European Food Safety Authority. (2026, May). Feed additives application procedure. EFSA.
- German Federal Statistical Office. (2025, August). Holdings with pigs and stocks of pigs. Destatis.
- National Bureau of Statistics of China. (2026, February). Statistical Communiqué of the People's Republic of China on the 2025 National Economic and Social Development. NBS China.
- Press Information Bureau. (2025, November). Release of Basic Animal Husbandry Statistics 2025 on the Occasion of National Milk Day 2025. Government of India.
- Department for Environment, Food and Rural Affairs. (2025, December). Livestock populations in the United Kingdom at 1 June 2025. GOV.UK.
- Ministry of Agriculture, Forestry and Fisheries. (2025, April). First Basic Plan for Food, Agriculture, and Rural Areas. Government of Japan.
- Ministry of Data and Statistics. (2026, April). Livestock Statistics in the First Quarter of 2026. Republic of Korea.
- International Feed Industry Federation. (2025, November). IFIF Annual Report. IFIF.
- Kemin Industries. (2024, October). Prevention of post-weaning diarrhea in very small piglets. Kemin Animal Nutrition and Health.
- Novonesis. (2025, June). Deal to acquire dsm-firmenich's share of the Feed Enzyme Alliance is completed, supporting Novonesis' growth strategy. Novonesis.
- Alltech. (2025, September). Alltech and ADM to launch North American animal feed joint venture. Alltech.
- Cargill. (2025, November). Cargill Animal Nutrition & Health increases micronutrition production capacity to meet growing customer demand. Cargill.
- Adisseo. (2026, March). Adisseo Expands Butyrate Portfolio with Sanion Tetra. Adisseo.
- Trouw Nutrition. (2026, April). Trouw Nutrition takes center stage at ICPIH 2026. Trouw Nutrition.
This bibliography is provided for reader reference and uses primary government, standards-body, official trade body, and company sources.
This Report Answers
- What value is the weaning stress additives market expected to reach in 2026 and 2036?
- What CAGR is forecast for the weaning stress additives market from 2026 to 2036?
- Which form and source segments shape demand across livestock and function parent categories?
- Which feed-mill and farm pressures support adoption or purchase activity?
- How do country CAGRs differ across the profiled markets?
- Which companies compete across documentation support and premix service fit?
- How does FMI validate forecasts using a hybrid bottom-up and top-down model?
- What should feed mills and swine integrators address before broader account expansion?
- How does feed-additive documentation affect supplier selection in regulated accounts?
Frequently Asked Questions
What is driving growth in the Weaning Stress Additives Market?
Growth is being driven by post-weaning feed-intake control and nursery-ration sensitivity. Feed mills and swine integrators need additives that support gut stability during diet change.
Who are the key players in the Weaning Stress Additives Market?
Key players include Cargill and ADM; Kemin Industries and Alltech; Novonesis and dsm-firmenich; Adisseo and Trouw Nutrition. Competition centers on documentation quality, bioscience capability and mill-service continuity.
What is a significant restraint in the Weaning Stress Additives Market?
A significant restraint is weak trial ownership at farm level. Adoption slows when farms lack clear endpoints for intake, stool consistency and success measures.
Why should executives track the Weaning Stress Additives Market?
Executives should track this market due to its link with feed conversion and early-life performance records. The category also affects supplier qualification and recurring premix planning across swine accounts and feed-mill programs.
What business problem does the Weaning Stress Additives Market address?
The market addresses feed-intake disruption and gut-health risk after piglets move into nursery diets. It helps nutrition teams convert product claims into dosing instructions and trial records for farm advisors.
What should procurement leaders evaluate before selecting suppliers?
Procurement leaders should evaluate specification depth and strain evidence before approving recurring supplier orders. They should also compare handling proof and local technical support across trial accounts and feed mills.
What limits return on investment for feed mills?
Return is delayed if farm trials lack clear endpoints and responsibility for success measures. Handling problems also reduce value if products disrupt batching or storage routines during nursery diet changes.
How do suppliers build long-term account confidence?
Suppliers build confidence by providing evidence files and practical inclusion guidance for nursery diets. Repeatable batches and responsive troubleshooting support retention after initial trial approval and recurring mill use.
Which segment position should formulators track closely?
Formulators should track dry and microbial inputs due to their influence on handling and claim-evidence decisions. Piglet-focused programs need a clear link between additive use and nursery performance before recurring approval.
Which country group is expected to show more visible expansion?
India and China are expected to support higher expansion under premix conversion and dense livestock output. Established markets are expected to grow under documentation-led replacement and service support across audited accounts.
Preview the report firsthand - request a free sample
Get SampleGet the brochure for pricing and purchase details.
Get PDFTable of Content
- Key Takeaways
- Market Size and CAGR
- Top Growth Driver
- Fastest Growing Segment
- Leading Region
- Key Companies
- Emerging Opportunities
- Executive Summary
- Global Market Outlook
- Demand-side Trends
- Supply-side Trends
- Technology Roadmap Analysis
- Analysis and Recommendations
- Analyst Perspective (What is happening? Why now? What should investors know?)
- Key Questions Answered
- How large is the market?
- What is the CAGR?
- What are key trends?
- Which region dominates?
- Who are the leaders?
- Market Overview
- Market Coverage / Taxonomy
- Market Definition / Scope / Limitations
- Research Methodology
- Chapter Orientation
- Analytical Lens and Working Hypotheses
- Market Structure, Signals, and Trend Drivers
- Benchmarking and Cross-market Comparability
- Market Sizing, Forecasting, and Opportunity Mapping
- Research Design and Evidence Framework
- Desk Research Programme (Secondary Evidence)
- Expert Input and Fieldwork (Primary Evidence)
- Tooling, Models, and Reference Databases
- Data Engineering and Model Build
- Quality Assurance and Audit Trail
- Market Background
- Market Dynamics (Drivers, Restraints, Opportunity, Trends)
- Scenario Forecast (Optimistic, Likely, Conservative)
- Impact Analysis
- AI Impact
- Sustainability Impact
- Regulatory Impact
- Technology Impact
- Consumer / Buyer Analysis
- Purchase Drivers
- Adoption Barriers
- Buyer Journey
- Opportunity Map Analysis
- Product Life Cycle Analysis
- Supply Chain Analysis
- Investment Feasibility Matrix
- Value Chain Analysis
- PESTLE and Porter's Analysis
- Regulatory Landscape
- Regional Parent Market Outlook
- Production and Consumption Statistics
- Import and Export Statistics
- Global Market Analysis and Forecast, 2021 to 2036
- Historical Market Size Value (USD Mn) Analysis, 2021 to 2025
- Current and Future Market Size Value (USD Mn) Projections, 2026 to 2036
- Y-o-Y Growth Trend Analysis
- Absolute $ Opportunity Analysis
- Global Market Pricing Analysis, 2021 to 2036
- Global Market Analysis and Forecast, By Form, 2021 to 2036
- Introduction / Key Findings
- Historical Market Size Value (USD Mn) Analysis By Form, 2021 to 2025
- Current and Future Market Size Value (USD Mn) Analysis and Forecast By Form, 2026 to 2036
- dry
- liquid
- pellet
- premix
- encapsulated
- dry
- Y-o-Y Growth Trend Analysis By Form, 2021 to 2025
- Absolute $ Opportunity Analysis By Form, 2026 to 2036
- Global Market Analysis and Forecast, By Source, 2021 to 2036
- Introduction / Key Findings
- Historical Market Size Value (USD Mn) Analysis By Source, 2021 to 2025
- Current and Future Market Size Value (USD Mn) Analysis and Forecast By Source, 2026 to 2036
- microbial
- synthetic
- plant/botanical
- mineral
- yeast-based inputs
- microbial
- Y-o-Y Growth Trend Analysis By Source, 2021 to 2025
- Absolute $ Opportunity Analysis By Source, 2026 to 2036
- Global Market Analysis and Forecast, By Livestock, 2021 to 2036
- Introduction / Key Findings
- Historical Market Size Value (USD Mn) Analysis By Livestock, 2021 to 2025
- Current and Future Market Size Value (USD Mn) Analysis and Forecast By Livestock, 2026 to 2036
- piglets
- sows
- swine
- finishers
- other swine
- piglets
- Y-o-Y Growth Trend Analysis By Livestock, 2021 to 2025
- Absolute $ Opportunity Analysis By Livestock, 2026 to 2036
- Global Market Analysis and Forecast, By Function, 2021 to 2036
- Introduction / Key Findings
- Historical Market Size Value (USD Mn) Analysis By Function, 2021 to 2025
- Current and Future Market Size Value (USD Mn) Analysis and Forecast By Function, 2026 to 2036
- gut health
- growth performance
- immunity
- nutrient utilization
- stress management
- gut health
- Y-o-Y Growth Trend Analysis By Function, 2021 to 2025
- Absolute $ Opportunity Analysis By Function, 2026 to 2036
- Global Market Analysis and Forecast, By Region, 2021 to 2036
- Introduction
- Historical Market Size Value (USD Mn) Analysis By Region, 2021 to 2025
- Current Market Size Value (USD Mn) Analysis and Forecast By Region, 2026 to 2036
- North America
- Latin America
- Western Europe
- Eastern Europe
- East Asia
- South Asia and Pacific
- Middle East & Africa
- Market Attractiveness Analysis By Region
- North America Market Analysis and Forecast, By Country, 2021 to 2036
- Historical Market Size Value (USD Mn) Trend Analysis By Market Taxonomy, 2021 to 2025
- Market Size Value (USD Mn) Forecast By Market Taxonomy, 2026 to 2036
- By Country
- USA
- Canada
- By Form
- By Source
- By Livestock
- By Function
- By Country
- Market Attractiveness Analysis
- By Country
- By Form
- By Source
- By Livestock
- By Function
- Key Takeaways
- Latin America Market Analysis and Forecast, By Country
- Historical Market Size Value (USD Mn) Trend Analysis By Market Taxonomy, 2021 to 2025
- Market Size Value (USD Mn) Forecast By Market Taxonomy, 2026 to 2036
- By Country
- Brazil
- Mexico
- Chile
- Rest of Latin America
- By Form
- By Source
- By Livestock
- By Function
- By Country
- Market Attractiveness Analysis
- By Country
- By Form
- By Source
- By Livestock
- By Function
- Key Takeaways
- Western Europe Market Analysis and Forecast, By Country
- Historical Market Size Value (USD Mn) Trend Analysis By Market Taxonomy, 2021 to 2025
- Market Size Value (USD Mn) Forecast By Market Taxonomy, 2026 to 2036
- By Country
- Germany
- UK
- Italy
- Spain
- France
- Nordic
- BENELUX
- Rest of Western Europe
- By Form
- By Source
- By Livestock
- By Function
- By Country
- Market Attractiveness Analysis
- By Country
- By Form
- By Source
- By Livestock
- By Function
- Key Takeaways
- Eastern Europe Market Analysis and Forecast, By Country
- Historical Market Size Value (USD Mn) Trend Analysis By Market Taxonomy, 2021 to 2025
- Market Size Value (USD Mn) Forecast By Market Taxonomy, 2026 to 2036
- By Country
- Russia
- Poland
- Hungary
- Balkan & Baltic
- Rest of Eastern Europe
- By Form
- By Source
- By Livestock
- By Function
- By Country
- Market Attractiveness Analysis
- By Country
- By Form
- By Source
- By Livestock
- By Function
- Key Takeaways
- East Asia Market Analysis and Forecast, By Country
- Historical Market Size Value (USD Mn) Trend Analysis By Market Taxonomy, 2021 to 2025
- Market Size Value (USD Mn) Forecast By Market Taxonomy, 2026 to 2036
- By Country
- China
- Japan
- South Korea
- By Form
- By Source
- By Livestock
- By Function
- By Country
- Market Attractiveness Analysis
- By Country
- By Form
- By Source
- By Livestock
- By Function
- Key Takeaways
- South Asia and Pacific Market Analysis and Forecast, By Country
- Historical Market Size Value (USD Mn) Trend Analysis By Market Taxonomy, 2021 to 2025
- Market Size Value (USD Mn) Forecast By Market Taxonomy, 2026 to 2036
- By Country
- India
- ASEAN
- Australia & New Zealand
- Rest of South Asia and Pacific
- By Form
- By Source
- By Livestock
- By Function
- By Country
- Market Attractiveness Analysis
- By Country
- By Form
- By Source
- By Livestock
- By Function
- Key Takeaways
- Middle East & Africa Market Analysis and Forecast, By Country
- Historical Market Size Value (USD Mn) Trend Analysis By Market Taxonomy, 2021 to 2025
- Market Size Value (USD Mn) Forecast By Market Taxonomy, 2026 to 2036
- By Country
- Kingdom of Saudi Arabia
- Other GCC Countries
- Türkiye
- South Africa
- Other African Union
- Rest of Middle East & Africa
- By Form
- By Source
- By Livestock
- By Function
- By Country
- Market Attractiveness Analysis
- By Country
- By Form
- By Source
- By Livestock
- By Function
- Key Takeaways
- Key Countries Market Analysis
- USA
- Pricing Analysis
- Market Share Analysis, 2025
- By Form
- By Source
- By Livestock
- By Function
- Canada
- Pricing Analysis
- Market Share Analysis, 2025
- By Form
- By Source
- By Livestock
- By Function
- Mexico
- Pricing Analysis
- Market Share Analysis, 2025
- By Form
- By Source
- By Livestock
- By Function
- Brazil
- Pricing Analysis
- Market Share Analysis, 2025
- By Form
- By Source
- By Livestock
- By Function
- Chile
- Pricing Analysis
- Market Share Analysis, 2025
- By Form
- By Source
- By Livestock
- By Function
- Germany
- Pricing Analysis
- Market Share Analysis, 2025
- By Form
- By Source
- By Livestock
- By Function
- UK
- Pricing Analysis
- Market Share Analysis, 2025
- By Form
- By Source
- By Livestock
- By Function
- Italy
- Pricing Analysis
- Market Share Analysis, 2025
- By Form
- By Source
- By Livestock
- By Function
- Spain
- Pricing Analysis
- Market Share Analysis, 2025
- By Form
- By Source
- By Livestock
- By Function
- France
- Pricing Analysis
- Market Share Analysis, 2025
- By Form
- By Source
- By Livestock
- By Function
- India
- Pricing Analysis
- Market Share Analysis, 2025
- By Form
- By Source
- By Livestock
- By Function
- ASEAN
- Pricing Analysis
- Market Share Analysis, 2025
- By Form
- By Source
- By Livestock
- By Function
- Australia & New Zealand
- Pricing Analysis
- Market Share Analysis, 2025
- By Form
- By Source
- By Livestock
- By Function
- China
- Pricing Analysis
- Market Share Analysis, 2025
- By Form
- By Source
- By Livestock
- By Function
- Japan
- Pricing Analysis
- Market Share Analysis, 2025
- By Form
- By Source
- By Livestock
- By Function
- South Korea
- Pricing Analysis
- Market Share Analysis, 2025
- By Form
- By Source
- By Livestock
- By Function
- Russia
- Pricing Analysis
- Market Share Analysis, 2025
- By Form
- By Source
- By Livestock
- By Function
- Poland
- Pricing Analysis
- Market Share Analysis, 2025
- By Form
- By Source
- By Livestock
- By Function
- Hungary
- Pricing Analysis
- Market Share Analysis, 2025
- By Form
- By Source
- By Livestock
- By Function
- Kingdom of Saudi Arabia
- Pricing Analysis
- Market Share Analysis, 2025
- By Form
- By Source
- By Livestock
- By Function
- Türkiye
- Pricing Analysis
- Market Share Analysis, 2025
- By Form
- By Source
- By Livestock
- By Function
- South Africa
- Pricing Analysis
- Market Share Analysis, 2025
- By Form
- By Source
- By Livestock
- By Function
- USA
- Market Structure Analysis
- Competition Dashboard
- Competition Benchmarking
- Market Share Analysis of Top Players
- By Regional
- By Form
- By Source
- By Livestock
- By Function
- Emerging Startups
- Innovation Benchmarking
- Competition Analysis
- Competition Deep Dive
- Cargill
- Overview
- Product Portfolio
- Profitability by Market Segments
- Sales Footprint
- Strategy Overview
- Marketing Strategy
- Product Strategy
- Channel Strategy
- ADM
- dsm-firmenich
- Kemin Industries
- Alltech
- Novonesis
- Adisseo
- Trouw Nutrition
- Cargill
- Case Studies
- Success Stories
- Recent Developments
- Competition Deep Dive
- Assumptions & Acronyms Used


