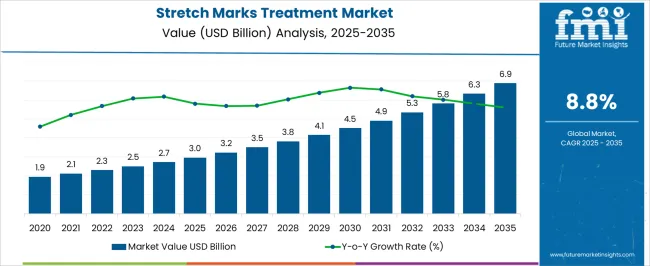
The Stretch Marks Treatment Market is estimated to be valued at USD 3.0 billion in 2025 and is projected to reach USD 6.9 billion by 2035, registering a compound annual growth rate (CAGR) of 8.8% over the forecast period.
| Metric | Value |
|---|---|
| Stretch Marks Treatment Market Estimated Value in (2025 E) | USD 3.0 billion |
| Stretch Marks Treatment Market Forecast Value in (2035 F) | USD 6.9 billion |
| Forecast CAGR (2025 to 2035) | 8.8% |
The stretch marks treatment market is experiencing consistent growth as awareness around skin health, aesthetics, and preventive dermatology continues to rise. Increasing demand is being observed from both developed and emerging regions, driven by heightened consumer focus on appearance and the availability of advanced treatment solutions.
The adoption of non invasive and minimally invasive approaches is expanding, with topical formulations, laser therapies, and device based solutions gaining traction. Rising disposable incomes, broader access to dermatological care, and growing influence of beauty standards are supporting market expansion.
Technological innovation in formulations and procedures aimed at enhancing efficacy and safety has also contributed to stronger adoption trends. The outlook for the market remains positive as awareness campaigns, clinical research, and increasing acceptance of cosmetic dermatology reinforce demand across both medical and consumer settings.
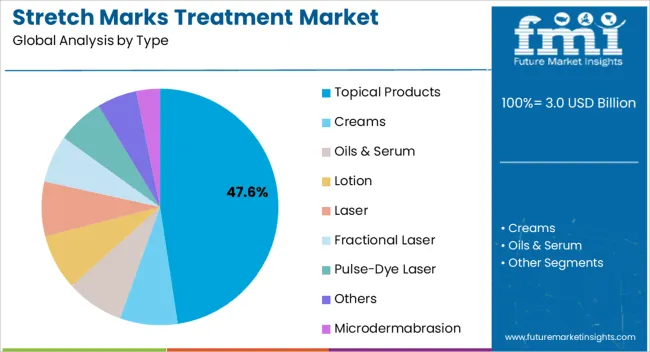
The topical products segment is anticipated to contribute 47.60% of overall revenue by 2025 within the type category, positioning it as the leading segment. Growth in this category is driven by increasing consumer preference for non invasive, easily accessible, and cost effective solutions for stretch mark reduction.
Advances in formulations with bioactive ingredients, retinoids, and natural extracts have improved perceived effectiveness and safety, thereby boosting adoption rates. The ease of over the counter availability and compatibility with daily skincare routines has further strengthened the dominance of topical products.
With expanding product innovation and greater focus on preventive care, this type continues to command a strong share in the overall market.
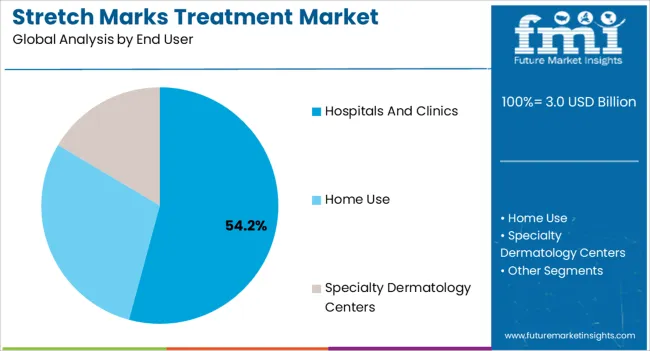
The hospitals and clinics segment is projected to hold 54.20% of total market revenue by 2025 within the end user category, making it the most prominent segment. This is attributed to the preference for professional treatments that ensure safety, precision, and stronger clinical outcomes.
Hospitals and clinics provide access to advanced technologies such as laser therapies, microdermabrasion, and combination treatments, which are sought after by patients seeking more visible and lasting results. The availability of dermatologists and trained specialists adds to patient confidence, driving consistent adoption of these facilities.
Increasing patient inclination toward clinically backed procedures continues to reinforce the dominance of hospitals and clinics in the end user segment.
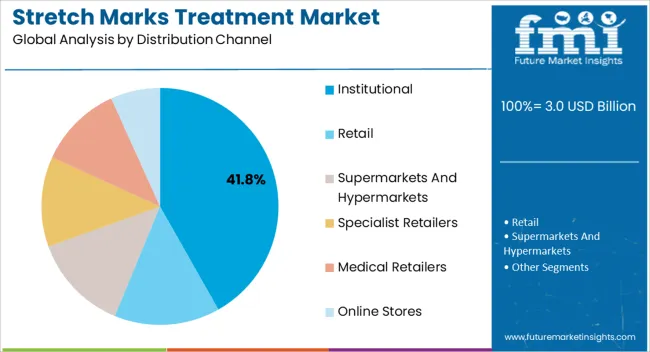
The institutional distribution channel is expected to account for 41.80% of total revenue by 2025, establishing itself as the leading channel. Growth has been supported by bulk purchasing from hospitals, clinics, and specialty dermatology centers, which rely on consistent supply of both topical products and medical devices.
Institutional procurement ensures standardized quality, regulatory compliance, and efficient cost structures, making it the preferred distribution model. Additionally, partnerships between manufacturers and healthcare institutions have strengthened supply networks and expanded access to innovative treatment solutions.
This focus on institutional channels highlights the importance of structured procurement processes in ensuring availability and affordability, which continues to reinforce its leadership in the market.
Short-term Growth (2025 to 2029): The increasing obesity and overweight in people are pushing them to lose weight. As an outcome, a certain section of people has joined a gym, and athletic activities, and sports are pushing the demand for stretch marks. The potential markets with numerous opportunities are flourishing in sales of stretch marks treatment solutions. Hence, the market is expected to hold USD 3 billion in 2025 while it is likely to reach USD 4.1 billion by 2029.
Mid-term Growth (2029 to 2035): Higher social media influence along with extending research and development activities are garnering market growth. Furthermore, the rise in FDA approvals is pushing vendors to adopt modern solutions that have lower side effects. This takes a market value from USD 4.1 billion in 2029 to a value of USD 6.9 billion in 2035.
Long-term Growth (2035 to 2035): The mixture of two types of treatment procedures such as chemical peels and microdermabrasion helps the market growth during the period. These procedures are forms of exfoliation, where the dead skin is removed. Thus, the market is anticipated to thrive at a steady CAGR of 8.81% between 2025 and 2035.
A few of the key restraints for the market include alternative medicine such as Ayurveda and homemade remedies. Furthermore, the high prices associated with invasive and non-invasive methods are restricting the growth prospects of the stretch marks treatment market. The higher BI and multiparity can be another challenge for the market.
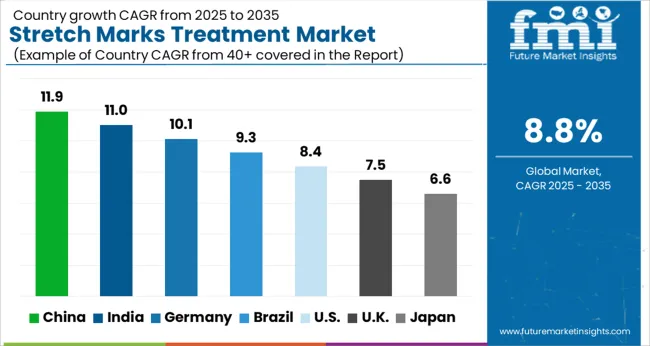
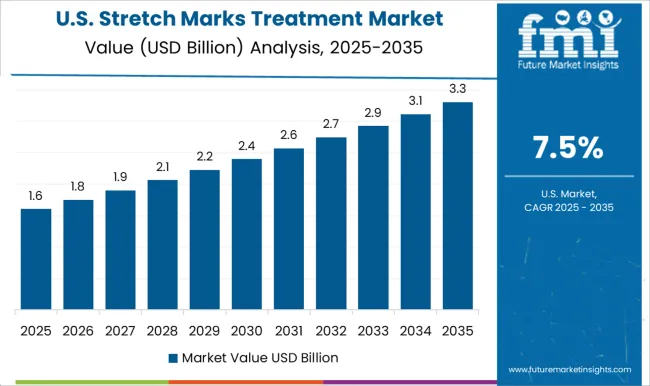
Higher Obese Population, Extended Skin Healthcare Facilities, and Increased Per Capita Income help North America lead the Global Market
Garnering the Regional Growth
The North American stretch marks treatment market leads the market in terms of market share as it is expected to hold a huge share in 2025. The growth is attributed to the increase in people having an imbalanced eating lifestyle, leading them to turn obese. This leads to two strains of people, one that loses weight through workouts such as gym, aerobics, and sports while the other strain of people goes through fat-cutting surgeries. Both kinds get stretch marks leading to the expansion of the market expansion in the region.
Changing Lifestyles, Increased Awareness around Advanced Facilities, and Rising Beauty and Cosmetic Product Consumption is Garnering the Regional Growth
Asia Pacific region is another significant market as it held a prominent market share in 2024. China stretch marks treatment market thrives on higher awareness, increased per capita incomes, and new standards of beauty. Furthermore, the advanced laser treatment tools along with the error-less plastic surgery treatment solutions are garnering market growth. Skincare giants launching their anti-stretch mark products in growing economies like China and India are contributing to regional growth.
Technological Advancements and Error-less Approach is thriving in the United Kingdom’s Market Space
The United Kingdom is another significant market for stretch marks treatment. An increase in lifestyle changes and unhealthy eating habits led to cesarean deliveries in the regional market. Alongside this, the facilities adopt advanced techniques such as the chemical peel method, laser, and cosmetic surgeries.
| Category | By Treatment Type |
|---|---|
| Leading Segment | Topical |
| Category | By End User |
|---|---|
| Leading Segment | Home Use |
Based on treatment type, topical segment leads due to its effective usage on people who have gained or lost weight in a small amount of time. Furthermore, the high availability of creams, oils, and lotions also lets the segment dominate the others in the treatment type category. Affordability also plays its part while brand promotions and an easy-to-use approach make it a better package for the end user. The segment is also supported by the high demand for anti-aging and anti-wrinkle treatments
Based on the end user, the home use segment leads. The growth is attributed to easy implementation, shorter time consumption, and real-time results optimization. Furthermore, the highly-priced hospital-based operations tend to push end users to an affordable home-use solution that is much cheaper.
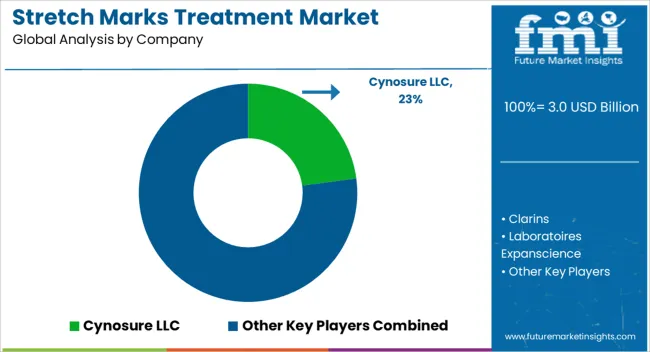
The key players focus on providing different packages to the end users. The vendors also make their solutions stretch-specific so that the right end users can be targeted. The collaboration between healthcare facilities and skincare experts is creating new opportunities for competitors while limiting the procedure fees. Other than this, the key players also launch products that help their treatment process, expanding the market size.
Market Developments
The global stretch marks treatment market is estimated to be valued at USD 3.0 billion in 2025.
The market size for the stretch marks treatment market is projected to reach USD 6.9 billion by 2035.
The stretch marks treatment market is expected to grow at a 8.8% CAGR between 2025 and 2035.
The key product types in stretch marks treatment market are topical products, creams, oils & serum, lotion, laser, fractional laser, pulse-dye laser, others and microdermabrasion.
In terms of end user, hospitals and clinics segment to command 54.2% share in the stretch marks treatment market in 2025.


Our Research Products

The "Full Research Suite" delivers actionable market intel, deep dives on markets or technologies, so clients act faster, cut risk, and unlock growth.

The Leaderboard benchmarks and ranks top vendors, classifying them as Established Leaders, Leading Challengers, or Disruptors & Challengers.

Locates where complements amplify value and substitutes erode it, forecasting net impact by horizon

We deliver granular, decision-grade intel: market sizing, 5-year forecasts, pricing, adoption, usage, revenue, and operational KPIs—plus competitor tracking, regulation, and value chains—across 60 countries broadly.

Spot the shifts before they hit your P&L. We track inflection points, adoption curves, pricing moves, and ecosystem plays to show where demand is heading, why it is changing, and what to do next across high-growth markets and disruptive tech

Real-time reads of user behavior. We track shifting priorities, perceptions of today’s and next-gen services, and provider experience, then pace how fast tech moves from trial to adoption, blending buyer, consumer, and channel inputs with social signals (#WhySwitch, #UX).

Partner with our analyst team to build a custom report designed around your business priorities. From analysing market trends to assessing competitors or crafting bespoke datasets, we tailor insights to your needs.
Supplier Intelligence
Discovery & Profiling
Capacity & Footprint
Performance & Risk
Compliance & Governance
Commercial Readiness
Who Supplies Whom
Scorecards & Shortlists
Playbooks & Docs
Category Intelligence
Definition & Scope
Demand & Use Cases
Cost Drivers
Market Structure
Supply Chain Map
Trade & Policy
Operating Norms
Deliverables
Buyer Intelligence
Account Basics
Spend & Scope
Procurement Model
Vendor Requirements
Terms & Policies
Entry Strategy
Pain Points & Triggers
Outputs
Pricing Analysis
Benchmarks
Trends
Should-Cost
Indexation
Landed Cost
Commercial Terms
Deliverables
Brand Analysis
Positioning & Value Prop
Share & Presence
Customer Evidence
Go-to-Market
Digital & Reputation
Compliance & Trust
KPIs & Gaps
Outputs
Full Research Suite comprises of:
Market outlook & trends analysis
Interviews & case studies
Strategic recommendations
Vendor profiles & capabilities analysis
5-year forecasts
8 regions and 60+ country-level data splits
Market segment data splits
12 months of continuous data updates
DELIVERED AS:
PDF EXCEL ONLINE
Anti-Stretch Marks Agents Market Size and Share Forecast Outlook 2025 to 2035
Scar and Stretch Mark Treatment Market Size and Share Forecast Outlook 2025 to 2035
Stretch Film Industry Analysis in DACH Size and Share Forecast Outlook 2025 to 2035
Stretch Film Industry Analysis in Japan Size and Share Forecast Outlook 2025 to 2035
Stretch Mark Prevention Creams Market Size and Share Forecast Outlook 2025 to 2035
Stretch Sleeve and Shrink Sleeve Labels Market Size and Share Forecast Outlook 2025 to 2035
Treatment-Resistant Hypertension Management Market Size and Share Forecast Outlook 2025 to 2035
Stretcher Accessories Market Size and Share Forecast Outlook 2025 to 2035
Treatment-Resistant Depression Treatment Market Size and Share Forecast Outlook 2025 to 2035
Stretch and Shrink Films Market Size and Share Forecast Outlook 2025 to 2035
Stretch Film Packs Market Insights on Type, Product, Application, Industry, and Region - 2025 to 2035
Stretch Films Market Outlook - Size, Demand & Industry Trends 2025 to 2035
Stretch Mark Removal Products Market Insights - Growth & Forecast 2025 to 2035
Stretch Hood Films Market Analysis by Up to 50 microns, 50-100 microns, 100-150 microns, 150 microns & above Through 2035
Treatment Pumps Market Insights Growth & Demand Forecast 2025 to 2035
Stretchable Electronics Market Trends - Growth & Forecast 2025 to 2035
Stretch Wrapper Market Growth - Demand & Forecast 2025 to 2035
Stretch Blow Molding Machines Market Segmentation based on Technology Type, Orientation Type, End Use, and Region: A Forecast for 2025 and 2035
Stretchable Conductive Material Analysis by Material, Fillers, Stretching Mechanism, Fabrication, Function, Application, End-User and Region - Forecast for 2025 to 2035
Market Share Insights of Leading Stretch Blow Molding Machines Providers

Thank you!
You will receive an email from our Business Development Manager. Please be sure to check your SPAM/JUNK folder too.
Chat With
MaRIA