

- Market Size (2026)
- USD 5.8 Bn
- Forecast (2036)
- USD 21.6 Bn
- CAGR (2026 to 2036)
- 14.0%
How big is Structural Health Monitoring Market in 2026?
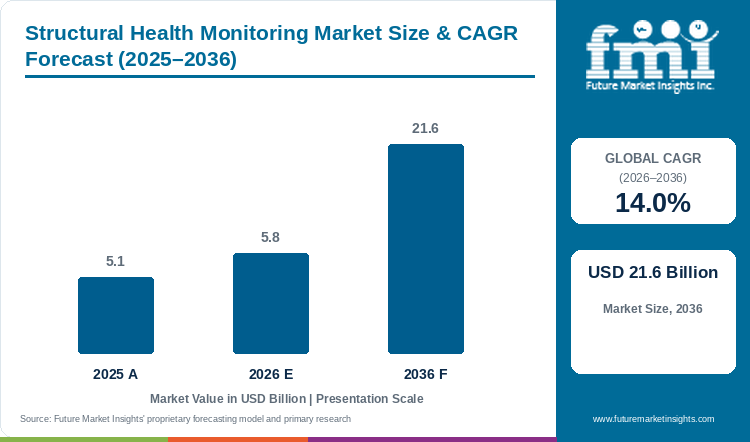
Demand is projected to expand at 14.0% CAGR from 2026 to 2036. Market value rises from USD 5.1 billion in 2025 to USD 5.81 billion in 2026 and USD 21.55 billion by 2036.
A structural monitoring system becomes useful when an engineer can connect a measured response with the behavior of the asset being examined, whether that response involves strain, vibration, displacement or temperature. Hardware establishes the measurement pathway, while software and engineering services help interpret changes against an appropriate baseline. [1] Wireless systems can reduce the amount of cabling required across a large structure, although power availability, radio coverage and sensor positioning still determine whether a proposed installation is practical. Demand is therefore linked to the engineering question that an owner needs to answer and the response that the measurements can reveal. The Sydney Harbour Bridge example documented by CSIRO illustrates the value of observing many individual supports across a complex asset, while Japanese railway research shows how remote vibration measurement can address access constraints. [2][4] Remote sensing services provide a complementary view of large areas, whereas installed structural sensors capture selected local responses. Projected growth through 2036 reflects wider use of these condition measurements in maintenance decisions, with civil infrastructure, industrial equipment and energy assets creating different installation and interpretation requirements.
Key Market Trends & Insights
- Wireless monitoring is gaining attention where extensive cabling complicates installation, although coverage, battery life and the required sampling pattern still shape system design. [1]
- Owners are connecting measured structural responses with maintenance questions, so software interpretation depends on a suitable baseline and knowledge of the structure under observation. [3]
- Remote vibration techniques provide another measurement route for railway structures, particularly when direct access would interfere with normal operations or complicate inspection work. [4]
Regional Highlights
- Australia and New Zealand combine a strong infrastructure-monitoring outlook with practical examples of dense sensor networks, including the Sydney Harbour Bridge system documented by CSIRO. [2]
- German bridge monitoring emphasizes clearly defined engineering objectives, because traffic loading and aging structures do not create the same measurement requirements at every site. [3]
- Japanese railway research examines non-contact vibration and deflection measurement, creating a distinct technical route alongside permanently installed structural monitoring systems. [4]
Market Size & Forecast
Table 1: Market Size and Forecast for Structural Health Monitoring Market (USD billion and percentage), 2025 to 2036
| Metric | Value |
|---|---|
| 2025 market value | USD 5.1 billion |
| 2026 market value | USD 5.81 billion |
| 2036 market value | USD 21.55 billion |
| CAGR 2026 to 2036 | 14.0% |
| Revenue increase 2026 to 2036 | USD 15.74 billion |
| Market expansion 2026 to 2036 | 3.71 times |
The market is projected to grow from USD 5.81 billion in 2026 to USD 21.55 billion in 2036, at a CAGR of 14.0%. Expansion depends on converting measurements into useful maintenance decisions, because the relevant failure mechanism determines which observations are valuable. Within large industrial machines, sensor bearings can supply component-level readings that help engineers investigate the response of the moving assembly and its surrounding supports, alongside other structural instruments selected for the installation. [1]
What makes a structural measurement useful for maintenance?
Monitoring begins with an engineering objective, followed by a decision about the response that needs to be measured and the conditions under which measurements will be compared. A bridge support, railway span and industrial frame may each require different sensors and sampling arrangements. Official technical work consequently treats measurement selection and interpretation as connected tasks rather than assuming that a larger sensor network automatically provides a better diagnosis. [1][2][3][4]
Table 2: Industry evidence relevant to the structural health monitoring market
| Indicator | Data point or observation | Market relevance | Source |
|---|---|---|---|
| Wireless measurements | FHWA technical research examines strain, acceleration, displacement and tilt | Sensor selection follows the engineering response of interest | [1] |
| Distributed bridge sensing | CSIRO describes 2,400 sensors across 800 road-deck supports | Large assets can require many location-specific observations | [2] |
| Remote railway measurement | RTRI describes U-Doppler vibration and deflection assessment | Non-contact measurement offers an alternative where access is difficult | [4] |
Analyst Perspective
"The structural health monitoring market is likely to move deeper into predictive infrastructure management as asset owners shift away from periodic inspection."
- Sudip Saha, Co-founder, Future Market Insights
How is the Structural Health Monitoring Market segmented?
The market is segmented by Component, System Type, Application, and Region.
The market is segmented by component into hardware, software and services, with sensors and data acquisition systems forming the hardware layer, design and analysis tools supporting interpretation, and engineering services covering installation and continuing operation. By system type, wired and wireless systems describe the communication architecture, while applications include bridges and dams, buildings and stadiums, vessels and platforms, airframes and wind turbines, and large machines and equipment.
Why does hardware retain a substantial component share?
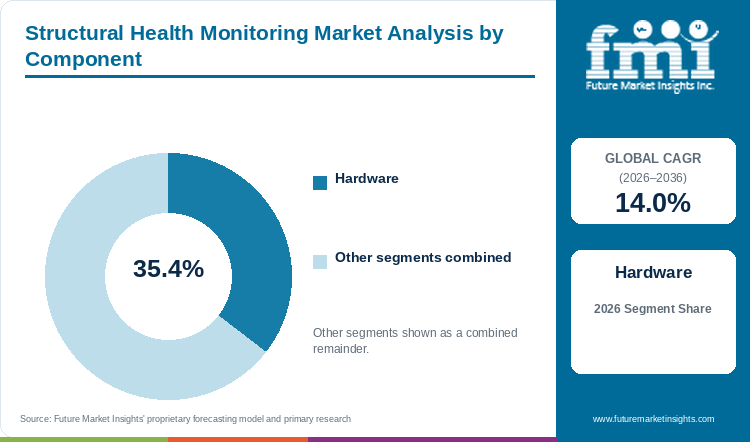
The Hardware segment is projected to account for 35.4% of component demand in 2026.
Table 3: Component Share for Structural Health Monitoring Market (percentage share), 2026
| Component | Estimated share (2026) |
|---|---|
| Hardware | 35.4% |
| Other components | 64.6% |
| Total | 100.0% |
Table 4: Segment Position and Market Growth for Structural Health Monitoring Market, 2026 to 2036
| Metric | Value |
|---|---|
| Global CAGR (2026 to 2036) | 14.0% |
| Profiled component segment | Hardware |
A monitoring installation needs a physical connection with the response being assessed, which makes sensors and data acquisition equipment fundamental to the system. An accelerometer used to examine vibration serves a different purpose from a strain gauge measuring a local structural response, while installation position affects what either device can reveal. [1] Hardware expenditure therefore follows the number and type of measurement points, the surrounding environment and the need to capture comparable observations over time. Photonics technology can contribute optical sensing approaches, but these are one part of a wider choice of measurement techniques. Hardware retains a substantial share because an analytical model cannot recover a structural response that the installed instruments never measured. [1]
- Hardware is projected to represent 35.4% of component demand in 2026, since every measurement point requires instruments and acquisition equipment suited to the response being examined.
- Sensor type, mounting location and sampling requirements influence the information available for subsequent structural interpretation and maintenance assessment. [1][3]
Why are wireless systems prominent in monitoring installations?
The Wireless Systems segment is projected to account for 58.7% of system type demand in 2026.
Table 5: System Type Share for Structural Health Monitoring Market (percentage share), 2026
| System Type | Estimated share (2026) |
|---|---|
| Wireless Systems | 58.7% |
| Wired Systems | 41.3% |
| Total | 100.0% |
Running cables across a bridge, stadium or large industrial structure can add installation work and make some measurement locations difficult to reach. Wireless architectures address this constraint by transmitting measurements without a continuous signal cable between every sensor position and the collection point. [1] Their usefulness still depends on the surrounding structure, the required transmission range and the power arrangements at each node, so system selection remains an engineering decision. A low-frequency condition measurement can impose a different communication burden from a continuously sampled vibration signal. The segment's demand position reflects the practical appeal of flexible deployment, particularly where existing assets need additional observations without a complete redesign of the monitoring installation. [1]
- Wireless Systems are projected to hold 58.7% of system-type demand in 2026, as reduced signal cabling makes additional monitoring points more practical on existing bridges and large structures.
- Power supply, radio coverage and the timing of measurements remain relevant design constraints even when a wireless system reduces signal-cable requirements. [1]
What are the drivers, restraints, and opportunities in the Structural Health Monitoring Market?
The value of structural monitoring depends on measurements that can be related to a maintenance decision across the asset's working life. Equipment purchase is only the beginning, since baseline conditions, mounting and environmental changes can affect interpretation. Suppliers that make those observations useful between inspections can address a clear engineering need, especially on complex structures where access and cabling make additional measurement points difficult to install. [1][2][3][4]
Driver
Aging infrastructure and heavily used assets create demand for measurements that help engineers examine how structures behave under actual operating conditions. The relevant benefit comes from connecting a measured change with a maintenance question, whether the asset is a bridge support, industrial frame or railway span. [1][2][3][4] Structural monitoring also complements established inspection practices by providing observations between visits or at difficult locations, supporting a more detailed understanding of selected components without assuming that instrumentation removes the need for engineering assessment.
Restraint
An installed sensor can provide a technically accurate reading that remains difficult to interpret if the baseline, loading condition or environmental influence is poorly characterized. Temperature changes, mounting arrangements and communication interruptions can all affect the usefulness of a measurement series. [1][3] These requirements add engineering and maintenance work beyond the initial hardware purchase, while the resulting system must remain suitable for the asset's operating life. Buyers consequently need to evaluate the complete measurement pathway including installation, acquisition and continuing interpretation.
Opportunity
Monitoring services can become more useful when they connect structural measurements with a specific maintenance decision, such as examining an unusual vibration response or prioritizing inspection of a support. Computer-aided engineering can help explore how the observed response relates to loading and structural behavior, while measured data gives the model an empirical point of comparison. [3] Suppliers that combine suitable instruments with interpretation suited to the asset have an opportunity to serve owners who need an actionable engineering assessment connected with the actual maintenance decision.
Which country CAGRs are profiled in the Structural Health Monitoring Market?
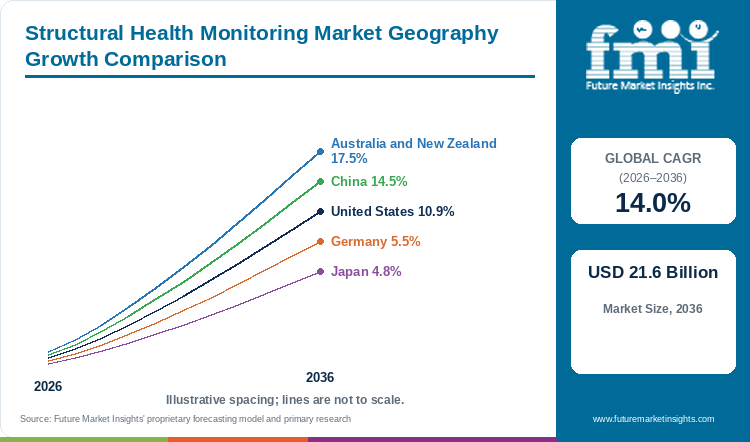
Table 6: Country CAGR Comparison for Structural Health Monitoring Market (CAGR percentage), 2026 to 2036
| Country | CAGR | Forecast period |
|---|---|---|
| Australia and New Zealand | 17.5% | 2026 to 2036 |
| China | 14.5% | 2026 to 2036 |
| United States | 10.9% | 2026 to 2036 |
| Germany | 5.5% | 2026 to 2036 |
| Japan | 4.8% | 2026 to 2036 |
Country-wise Analysis
Australia and New Zealand Structural Health Monitoring Market Outlook (2026 to 2036)
The Sydney Harbour Bridge offers a concrete Australian example of monitoring at a scale that requires many individual observations, with CSIRO describing 2,400 sensors across 800 road-deck supports. [2] The system illustrates how infrastructure owners can examine the condition of selected components within an asset that remains in everyday use. The combined Australia and New Zealand market is projected to expand at a CAGR of 17.5% from 2026 to 2036. This outlook applies to the combined market rather than assigning an identical rate to each country. Monitoring demand can involve bridges, buildings and other infrastructure, with the most useful installation determined by the structural question, local access conditions and the owner's ability to act on the resulting measurements.
China Structural Health Monitoring Market Outlook (2026 to 2036)
China's extensive infrastructure base gives monitoring suppliers a large variety of structures to assess, ranging from major bridges to buildings and energy-related assets. The commercial challenge is matching a measurement system to a particular structural response, because the same sensor layout will not answer every maintenance question. Growth is projected at a CAGR of 14.5% from 2026 to 2036, supported by demand for more detailed information about asset condition. Wired installations can remain appropriate where dependable power and communication routes are available, while wireless alternatives can simplify selected retrofit situations. The resulting demand extends beyond instruments to engineering interpretation, as owners need to distinguish an actual change in structural behavior from ordinary variation caused by loading or environmental conditions. [1]
United States Structural Health Monitoring Market Outlook (2026 to 2036)
US highway research has examined wireless measurement of strain, displacement, acceleration and tilt, demonstrating that structural monitoring involves several different engineering responses rather than a single condition score. FHWA's technical work also emphasizes establishing a useful baseline before interpreting subsequent observations. [1] The US market is projected to grow at a CAGR of 10.9% from 2026 to 2036. This creates demand for systems that can be installed and maintained within the practical constraints of an operating asset, particularly where measurements need to be collected at multiple locations. Software and service providers have a role in relating those observations to the asset's behavior, while the choice of instruments still depends on the structure and the question under investigation.
Germany Structural Health Monitoring Market Outlook (2026 to 2036)
German bridge-monitoring research places particular emphasis on setting a clear objective for the measurement program, because aging structures and changing traffic loads can create different assessment needs. BASt's technical work treats the selection of measured quantities as part of that engineering process. [3] Germany's market is projected to expand at a CAGR of 5.5% from 2026 to 2036. A targeted installation may examine a limited number of critical locations rather than maximizing the number of sensors, with the interpretation supported by knowledge of the bridge and its operating conditions. This approach creates room for specialist engineering services alongside hardware, especially when an owner needs to understand whether an observed response warrants further investigation or a change in maintenance priority.
Japan Structural Health Monitoring Market Outlook (2026 to 2036)
Railway structures give Japan a distinctive monitoring use case because measurements often need to be obtained without disrupting operations or requiring prolonged access to difficult locations. RTRI describes a U-Doppler approach for remote, non-contact measurement of structural vibration and bridge deflection from the ground. [4] The Japanese market is projected to grow at a CAGR of 4.8% from 2026 to 2036. Such techniques sit alongside installed sensors rather than replacing every monitoring architecture, because the appropriate method depends on the response being examined and the observation period required. Suppliers therefore need to address access, measurement resolution and interpretation together, with particular value in applications where direct installation or repeated site access would complicate the engineering assessment.
Who are the notable companies in the Structural Health Monitoring Market?
Campbell Scientific; GEOKON; COWI; Geocomp; Acellent Technologies
Hardware manufacturers, system integrators and engineering consultants occupy different positions in structural monitoring. An instrument supplier contributes measurement capability, while an engineering service provider helps determine where observations are needed and what the results mean for the asset. The purchasing comparison therefore needs to consider the complete project, including installation conditions, data acquisition and interpretation, because a technically capable sensor does not by itself define a suitable monitoring program for a bridge, railway structure or industrial machine.
Competitive Benchmarking: Structural Health Monitoring Market
Table 7: Competitive positioning for the structural health monitoring market
| Company | Positioning | Commercial distinction |
|---|---|---|
| Campbell Scientific | Data acquisition and monitoring instrumentation | Provides measurement and data-logging equipment used in structural monitoring systems. |
| GEOKON | Geotechnical and structural measurement instruments | Supplies sensors for measuring physical responses in civil engineering applications. |
| COWI | Engineering assessment and structural monitoring services | Connects monitoring work with infrastructure engineering and asset assessment. |
| Geocomp | Geotechnical and infrastructure monitoring services | Combines field measurements with engineering interpretation for infrastructure projects. |
| Acellent Technologies | Structural health monitoring systems | Develops monitoring solutions for assessing the condition of engineered structures. |
Key Developments in the Structural Health Monitoring Market
- CSIRO has documented the Sydney Harbour Bridge monitoring system with 2,400 sensors across 800 road-deck supports, providing an established example of dense measurement coverage on an operating bridge. [2]
- BASt's bridge-monitoring research emphasizes defining the purpose of monitoring and selecting appropriate measured quantities, linking instrumentation decisions with the engineering assessment required for a particular structure. [3]
- RTRI describes remote non-contact vibration and deflection measurement using U-Doppler technology, illustrating an alternative approach when direct access to a railway structure is difficult. [4]
Key Players in the Structural Health Monitoring Market
Data acquisition and monitoring instrumentation
- Campbell Scientific
Geotechnical and structural measurement instruments
- GEOKON
Engineering assessment and structural monitoring services
- COWI
Geotechnical and infrastructure monitoring services
- Geocomp
Structural health monitoring systems
- Acellent Technologies
Structural Health Monitoring Market - Report Scope
Table 8: Report Scope for Structural Health Monitoring Market, 2026 to 2036
| Coverage field | Report scope |
|---|---|
| Market | Structural Health Monitoring Market |
| Historical reference | 2025 |
| Base year | 2026 |
| Forecast period | 2026 to 2036 |
| Currency and units | USD billion |
| Segmentation | Component, System Type, Application |
| Geographic coverage | North America, Latin America, Europe, Asia Pacific, MEA |
| Country and market profiles | Australia and New Zealand, China, United States, Germany, Japan |
| Representative companies | Campbell Scientific; GEOKON; COWI; Geocomp; Acellent Technologies |
Structural Health Monitoring Market - Research Methodology
Table 9: Research Methodology for Structural Health Monitoring Market, 2026 edition
| Method | Approach |
|---|---|
| Market definition | Structural sensors, acquisition systems, analytical software and associated engineering services are examined as connected functions. |
| Demand assessment | Monitoring requirements are assessed against the asset, measured response and maintenance question. |
| Segmentation | Component, system type and application categories retain their separate analytical roles. |
| Geographic assessment | Country and combined-market profiles connect forecast rates with documented infrastructure and research conditions. |
| Competitive assessment | Instrument makers and engineering service providers are compared according to their actual project roles. |
| Evidence review | Official engineering research supports technical claims, with dates and institutional scope retained. |
Structural Health Monitoring Market by Segments
Structural Health Monitoring Market segmented by Component:
- Hardware
- Sensors
- Data Acquisition Systems
- Software
- Design and Analysis
- Parameter Identification and Tracking
- Service
- Installation Service
- Design and Consulting Service
- Operation and Maintenance Service
- Sensors
Structural Health Monitoring Market segmented by System Type:
- Wired Systems
- Wireless Systems
Structural Health Monitoring Market segmented by Application:
- Bridges and Dams
- Buildings and Stadiums
- Vessels and Platforms
- Airframes and Wind Turbines
- Large Machines and Equipment
Structural Health Monitoring Market by Region
- North America
- United States
- Canada
- Latin America
- Brazil
- Mexico
- Argentina
- Chile
- Western Europe
- Germany
- France
- United Kingdom
- Italy
- Spain
- Benelux
- Nordics
- Eastern Europe
- Poland
- Czech Republic
- Romania
- Hungary
- East Asia
- China
- Japan
- South Korea
- South Asia and Pacific
- India
- ASEAN
- Australia and New Zealand
- Middle East and Africa
- GCC Countries
- South Africa
- Türkiye
- Israel
Research Sources and Bibliography
- [1] US Federal Highway Administration. Accessed 15 October 2026. Assessing the Structural Health of America's Highway Bridges
- [2] CSIRO. Accessed 15 October 2026. Monitoring the health of structures
- [3] Federal Highway Research Institute, Germany. Accessed 15 October 2026. B 197: Erfahrungssammlung Monitoring für Brückenbauwerke
- [4] Railway Technical Research Institute. Accessed 15 October 2026. Inspection and diagnosis using remote non-contact measurements
This Report Answers
- How large is the structural health monitoring market in 2026?
- What is the market outlook through 2036?
- Which component has a substantial demand share?
- Which system type has the larger share?
- What determines the usefulness of structural monitoring?
Frequently Asked Questions
How large is the structural health monitoring market in 2026?
The market is estimated at USD 5.81 billion in 2026, compared with the 2025 reference value of USD 5.1 billion.
What is the market outlook through 2036?
The market is projected to reach USD 21.55 billion by 2036, expanding at a CAGR of 14.0% from 2026 to 2036.
Which component has a substantial demand share?
Hardware holds a projected 35.4% share in 2026, encompassing the sensors and acquisition equipment that establish the physical measurement pathway.
Which system type has the larger share?
Wireless systems represent a projected 58.7% share in 2026, supported by applications where extensive signal cabling complicates installation. [1]
What determines the usefulness of structural monitoring?
The measured response needs to address an engineering question and be interpreted against suitable loading and baseline conditions, rather than treating additional readings as a diagnosis on their own. [1][3]
Preview the report firsthand - request a free sample
Get SampleGet the brochure for pricing and purchase details.
Get PDFTable of Content
- Key Takeaways
- Market Size and CAGR
- Top Growth Driver
- Fastest Growing Segment
- Leading Region
- Key Companies
- Emerging Opportunities
- Executive Summary
- Global Market Outlook
- Demand-side Trends
- Supply-side Trends
- Technology Roadmap Analysis
- Analysis and Recommendations
- Analyst Perspective (What is happening? Why now? What should investors know?)
- Key Questions Answered
- How large is the market?
- What is the CAGR?
- What are key trends?
- Which region dominates?
- Who are the leaders?
- Market Overview
- Market Coverage / Taxonomy
- Market Definition / Scope / Limitations
- Research Methodology
- Chapter Orientation
- Analytical Lens and Working Hypotheses
- Market Structure, Signals, and Trend Drivers
- Benchmarking and Cross-market Comparability
- Market Sizing, Forecasting, and Opportunity Mapping
- Research Design and Evidence Framework
- Desk Research Programme (Secondary Evidence)
- Expert Input and Fieldwork (Primary Evidence)
- Tooling, Models, and Reference Databases
- Data Engineering and Model Build
- Quality Assurance and Audit Trail
- Market Background
- Market Dynamics (Drivers, Restraints, Opportunity, Trends)
- Scenario Forecast (Optimistic, Likely, Conservative)
- Impact Analysis
- AI Impact
- Sustainability Impact
- Regulatory Impact
- Technology Impact
- Consumer / Buyer Analysis
- Purchase Drivers
- Adoption Barriers
- Buyer Journey
- Opportunity Map Analysis
- Product Life Cycle Analysis
- Supply Chain Analysis
- Investment Feasibility Matrix
- Value Chain Analysis
- PESTLE and Porter's Analysis
- Regulatory Landscape
- Regional Parent Market Outlook
- Production and Consumption Statistics
- Import and Export Statistics
- Global Market Analysis and Forecast, 2021 to 2036
- Historical Market Size Value (USD Billion) Analysis, 2021 to 2025
- Current and Future Market Size Value (USD Billion) Projections, 2026 to 2036
- Y-o-Y Growth Trend Analysis
- Absolute $ Opportunity Analysis
- Global Market Pricing Analysis, 2021 to 2036
- Global Market Analysis and Forecast, By Component, 2021 to 2036
- Introduction / Key Findings
- Historical Market Size Value (USD Billion) Analysis By Component, 2021 to 2025
- Current and Future Market Size Value (USD Billion) Analysis and Forecast By Component, 2026 to 2036
- Hardware
- Sensors
- Data Acquisition Systems
- Software
- Design and Analysis
- Parameter Identification and Tracking
- Service
- Installation Service
- Design and Consulting Service
- Operation and Maintenance Service
- Y-o-Y Growth Trend Analysis By Component, 2021 to 2025
- Absolute $ Opportunity Analysis By Component, 2026 to 2036
- Global Market Analysis and Forecast, By System Type, 2021 to 2036
- Introduction / Key Findings
- Historical Market Size Value (USD Billion) Analysis By System Type, 2021 to 2025
- Current and Future Market Size Value (USD Billion) Analysis and Forecast By System Type, 2026 to 2036
- Wired Systems
- Wireless Systems
- Y-o-Y Growth Trend Analysis By System Type, 2021 to 2025
- Absolute $ Opportunity Analysis By System Type, 2026 to 2036
- Global Market Analysis and Forecast, By Application, 2021 to 2036
- Introduction / Key Findings
- Historical Market Size Value (USD Billion) Analysis By Application, 2021 to 2025
- Current and Future Market Size Value (USD Billion) Analysis and Forecast By Application, 2026 to 2036
- Bridges and Dams
- Buildings and Stadiums
- Vessels and Platforms
- Airframes and Wind Turbines
- Large Machines and Equipment
- Y-o-Y Growth Trend Analysis By Application, 2021 to 2025
- Absolute $ Opportunity Analysis By Application, 2026 to 2036
- Global Market Analysis and Forecast, By Region, 2021 to 2036
- Introduction
- Historical Market Size Value (USD Billion) Analysis By Region, 2021 to 2025
- Current Market Size Value (USD Billion) Analysis and Forecast By Region, 2026 to 2036
- North America
- Latin America
- Europe
- Market Attractiveness Analysis By Region
- North America Market Analysis and Forecast, By Country, 2021 to 2036
- Historical Market Size Value (USD Billion) Trend Analysis By Market Taxonomy, 2021 to 2025
- Market Size Value (USD Billion) Forecast By Market Taxonomy, 2026 to 2036
- By Country
- United States
- Canada
- Mexico
- By Component
- By System Type
- By Application
- By Country
- Market Attractiveness Analysis
- By Country
- By Component
- By System Type
- By Application
- Key Takeaways
- Latin America Market Analysis and Forecast, By Country
- Historical Market Size Value (USD Billion) Trend Analysis By Market Taxonomy, 2021 to 2025
- Market Size Value (USD Billion) Forecast By Market Taxonomy, 2026 to 2036
- By Country
- Brazil
- Chile
- Rest of Latin America
- By Component
- By System Type
- By Application
- By Country
- Market Attractiveness Analysis
- By Country
- By Component
- By System Type
- By Application
- Key Takeaways
- Europe Market Analysis and Forecast, By Country
- Historical Market Size Value (USD Billion) Trend Analysis By Market Taxonomy, 2021 to 2025
- Market Size Value (USD Billion) Forecast By Market Taxonomy, 2026 to 2036
- By Country
- Germany
- United Kingdom
- Italy
- Spain
- France
- Nordic
- BENELUX
- Rest of Western Europe
- Russia
- Poland
- Hungary
- Balkan & Baltic
- Rest of Eastern Europe
- Asia Pacific
- China
- Japan
- South Korea
- India
- ASEAN
- Australia and New Zealand
- Rest of South Asia and Pacific
- MEA
- Kingdom of Saudi Arabia
- Other GCC Countries
- Turkiye
- South Africa
- Other African Union
- Rest of Middle East & Africa
- By Component
- By System Type
- By Application
- By Country
- Market Attractiveness Analysis
- By Country
- By Component
- By System Type
- By Application
- Key Takeaways
- Key Countries Market Analysis
- United States
- Pricing Analysis
- Market Share Analysis, 2025
- By Component
- By System Type
- By Application
- Canada
- Pricing Analysis
- Market Share Analysis, 2025
- By Component
- By System Type
- By Application
- Mexico
- Pricing Analysis
- Market Share Analysis, 2025
- By Component
- By System Type
- By Application
- Brazil
- Pricing Analysis
- Market Share Analysis, 2025
- By Component
- By System Type
- By Application
- Chile
- Pricing Analysis
- Market Share Analysis, 2025
- By Component
- By System Type
- By Application
- Germany
- Pricing Analysis
- Market Share Analysis, 2025
- By Component
- By System Type
- By Application
- United Kingdom
- Pricing Analysis
- Market Share Analysis, 2025
- By Component
- By System Type
- By Application
- Italy
- Pricing Analysis
- Market Share Analysis, 2025
- By Component
- By System Type
- By Application
- Spain
- Pricing Analysis
- Market Share Analysis, 2025
- By Component
- By System Type
- By Application
- France
- Pricing Analysis
- Market Share Analysis, 2025
- By Component
- By System Type
- By Application
- India
- Pricing Analysis
- Market Share Analysis, 2025
- By Component
- By System Type
- By Application
- ASEAN
- Pricing Analysis
- Market Share Analysis, 2025
- By Component
- By System Type
- By Application
- Australia and New Zealand
- Pricing Analysis
- Market Share Analysis, 2025
- By Component
- By System Type
- By Application
- China
- Pricing Analysis
- Market Share Analysis, 2025
- By Component
- By System Type
- By Application
- Japan
- Pricing Analysis
- Market Share Analysis, 2025
- By Component
- By System Type
- By Application
- South Korea
- Pricing Analysis
- Market Share Analysis, 2025
- By Component
- By System Type
- By Application
- Russia
- Pricing Analysis
- Market Share Analysis, 2025
- By Component
- By System Type
- By Application
- Poland
- Pricing Analysis
- Market Share Analysis, 2025
- By Component
- By System Type
- By Application
- Hungary
- Pricing Analysis
- Market Share Analysis, 2025
- By Component
- By System Type
- By Application
- Kingdom of Saudi Arabia
- Pricing Analysis
- Market Share Analysis, 2025
- By Component
- By System Type
- By Application
- South Africa
- Pricing Analysis
- Market Share Analysis, 2025
- By Component
- By System Type
- By Application
- United States
- Market Structure Analysis
- Competition Dashboard
- Competition Benchmarking
- Market Share Analysis of Top Players
- By Regional
- By Component
- By System Type
- By Application
- Emerging Startups
- Innovation Benchmarking
- Competition Analysis
- Competition Deep Dive
- Campbell Scientific
- Overview
- Product Portfolio
- Profitability by Market Segments
- Sales Footprint
- Strategy Overview
- Marketing Strategy
- Product Strategy
- Channel Strategy
- GEOKON
- COWI
- Geocomp
- Acellent Technologies
- Campbell Scientific
- Case Studies
- Success Stories
- Recent Developments
- Competition Deep Dive
- Assumptions & Acronyms Used


