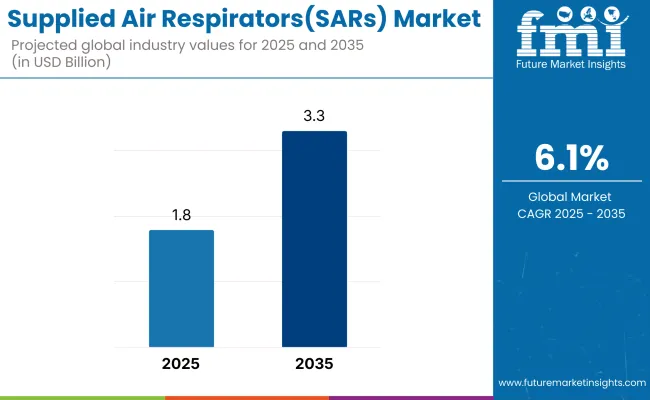
The Supplied Air Respirators (SARs) Market is valued at USD 1.8 billion in 2025. According to FMI analysis, the SARs sector will grow at a CAGR of 6.1% and reach USD 3.3 billion by 2035. Respirator protection systems are integral in work.

Spaces where employees or workers are highly exposed to harmful airborne contaminants. Industrial sectors including construction, manufacturing, mining, and chemical processing will remain the major end-users due to their rigid workplace safety regulations and rising emphasis towards occupational health.
In 2024, the Supplied Air Respirators (SARs) industry experienced a revolutionary turn, backed by an increased focus on workplace safety and shifting regulatory environments. Construction, manufacturing, and chemical processing industries stepped up their efforts toward respiratory protection, ensuring broad acceptance of SARs. Improved filtration technology and ergonomic design additionally enhanced their popularity, ensuring they became an essential tool in dangerous working conditions.
As the industry heads into 2025, growth is expected to accelerate further, boosted by rigorous occupational health regulations and the ongoing upgrade of industrial infrastructure. Businesses are paying greater attention to the welfare of their employees, incorporating cutting-edge SARs to reduce airborne risks to an optimal level.
The industry for Supplied Air Respirators (SARs) is growing at a fast pace, propelled by high safety standards and growing industrial risks. Organizations that focus on pioneering respiratory solutions will succeed, whereas organizations behind the curve risk extreme operational and legal penalties. With workplace safety taking center stage, the implementation of SARs is surging, transforming industry standards and driving long-term growth.
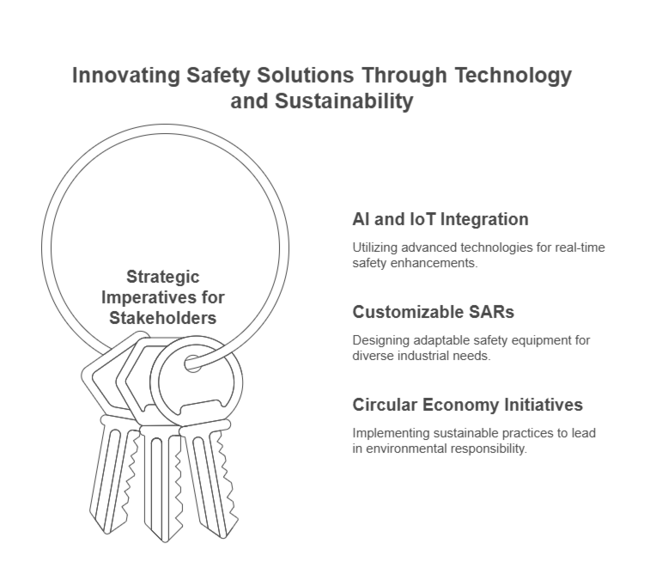
Integrate AI and IoT for Predictive Safety Solutions:
Combining AI-driven monitoring and IoT-based SARs can generate real-time insights, allowing proactive detection of hazards and customized respiratory protection, making businesses stand out in a safety-focused environment.
Develop Customizable and Modular SARs for Industry-Specific Requirements:
Investing in customizable SAR designs specific to individual industrial environments-e.g., ultra-lightweight for construction or high-durability ones for mining-can drive user adoption and increase customer base.
Introduce Circular Economy Projects for Sustainable Development:
Adopting recycling programs for SAR parts, developing biodegradable filter materials, and implementing green manufacturing practices will make firms leaders in sustainability, addressing increasing environmental demand

| Risk Factor | Probability & Impact |
|---|---|
| Volatility of Industrial Demand Cycles-Fluctuations in mining, manufacturing, and construction activity could generate unpredictable demand, contributing to inventory mismanagement and unstable revenue. | High Probability, High Impact |
| Ergonomic and User Comfort Issues-Discomfort and fatigue associated with prolonged SAR utilization can decrease worker compliance, encouraging organizations to pursue alternative technologies. | High Probability, Medium Impact |
| Lack of Standardization in Global Safety Regulations-Different compliance requirements in different regions can make product approvals more complex, raise certification expenses, and slow down-market entry. | Medium Probability, High Impact |
| Priority | Immediate Action |
|---|---|
| Expand SAR Customization for Niche Industries | Create customized variants for high-heat, confined-space, and extreme-environment applications to acquire untapped industry segments. |
| Address Worker Comfort and Wearability Concerns | Invest in lightweight materials, superior airflow mechanisms, and fatigue-curing designs for enhancing user compliance and long-term adoption. |
| Integrate Sustainable Manufacturing Practices | Adopt environmentally friendly production methods, explore biodegradable filter parts, and establish SAR recycling initiatives to conform to international sustainability aspirations. |
To stay ahead, companies must pivot toward innovation-driven respiratory solutions, prioritizing worker comfort, regulatory alignment, and sustainability. The future stage of development relies on creating SARs with adaptive filtering, ergonomic formats, and AI-driven safety monitoring. Industry penetration into specialized applications-e.g., high-hazard industrial areas and emergency situations has the potential to tap new sources of revenue.
Moreover, companies will need to take a proactive stance in keeping up with shifting compliance regimes and committing to circular economy practices in order to secure future-proofed operations. A forward-thinking strategy will not only bolster industry position but also reshape industry standards in workplace safety.
Self-contained breathing apparatus (SCBA) will dominate the SAR sector, driven by strict safety regulations in dangerous work environments. SCBAs provide unmatched protection in high-risk industries such as firefighting, chemical processing, and mining, where toxic air exposure is a serious issue.
As technology advances with lighter materials and longer-duration air supply, SCBA uptake will gain momentum. The segment will grow steadily as industries focus on employee safety, capturing a CAGR of 6.0% through 2035.
Long tube respirators will also become increasingly popular, especially in those requiring prolonged operational life in tight spaces. With the capacity to deliver a steady flow of air from distant sources, they are suitable for industries such as manufacturing and pharmaceutical production. With automation and precision work on the rise, long tube respirators will gain more demand.
The chemical sector will be a major growth driver for SAR adoption, driven by the demand for sophisticated respiratory protection in the handling of hazardous chemicals. Firms investing in next-generation SARs with improved filtration and real-time monitoring will be at a competitive advantage. With a CAGR of 5.8% through 2035, this industry will continue to lead the way in respiratory safety innovation.
The electronics sector will also see increasing dependence on SARs as there is increasing demand for cleanroom environments. With growing semiconductor manufacturing and precision production, shielding workers from airborne impurities will become paramount. Sophisticated SARs for extended wear and low airflow resistance will stimulate adoption.
Fire protection services will experience consistent demand for high-performance respirators, as urbanization and climate-related wildfires increase the demand for better firefighter protection. Other sectors, such as pharmaceuticals and oil & gas, will also drive SAR adoption through changing safety standards.

The USA will remain in the forefront of SAR technology innovations driven by demanding OSHA legislation and a serious concern for labor protection. Advancement will be triggered by surging industrial automation, growth of the chemical processing industries, and escalated investments in disaster response equipment.
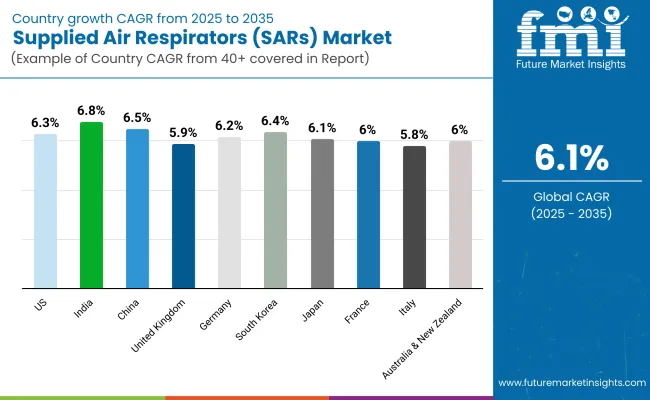
The wildfire and toxic substances incidents spike will increase the need for top-rate respirators used in firefighting and catastrophe handling. Also, aerospace and defense sectors will lead the industry towards development in lightweight and high-durability SARs. AI-based respiratory monitoring and modularity-centric producers will lead the industry with considerable share. FMI anticipates that the CAGR of the United States will be 6.3% over the forecast period.
India's SAR industry will witness a stable growth momentum, led by the increased industrialization and effective enforcement of worker safety regulations. The demand will be pushed with the developing large-scale infrastructure projects, such as smart cities and high-risk factory complexes. Escalation in the production of chemicals and pharma units will further drive adoption as firms look to adhere to global safety standards.
As the spread of multinational companies grows, superior respiratory products will be introduced, and domestic manufacturers will be compelled to enhance competitiveness and lower prices. Encouragement of job safety in mining and construction activities by the government will drive large-scale adoption, especially in poor air quality. FMI predicts that India's CAGR will be 6.8% by 2035.
China's SAR industry will grow dramatically, driven by accelerated industrialization, strict air quality standards, and leadership of China in world manufacturing. The chemical and electronics sectors will be leading demand drivers as China solidifies its role in high-tech manufacturing and semiconductor manufacturing. Increasing concerns about workplace exposure to dangerous fumes and airborne pollutants will drive industrial employers to implement innovative respiratory solutions.
Government-initiated environmental regulations and increasing investments in labor protection will drive SAR adoption in heavy industry sectors such as mining and metallurgy. Furthermore, China's emphasis on boosting domestic production of high-performance safety equipment will transform into cost-efficient innovations and technology development. FMI believes that the CAGR of China will be 6.5% during the forecast period.
The United Kingdom will experience steady demand for SARs, driven mostly by its solid regulatory environment and emphasis on worker protection in perilous industries. The pharmaceutical and biotechnology industries of the nation will lead the way in adoption, since cleanroom working conditions and handling chemicals necessitate better respiratory protection.
The drive for sustainable and reusable protective equipment will promote innovation, with manufacturers working on biodegradable filters and energy-saving air supply systems. With growing challenges in urban firefighting, adoption of SAR among fire departments will accelerate. Based on technological improvement and rising compliance with safety regulations, FMI predicts the United Kingdom's CAGR to be 5.9% by 2035.
Germany's SAR industry will succeed based on its strong industrial establishment and stringent occupational safety regulations. The nation's leadership in manufacturing automobiles and heavy machinery will support demand for SARs in applications involving welding, painting, and handling hazardous substances.
Growing interest in occupational health among chemical and pharmaceutical industries will also drive the growth, with employers investing to acquire next-generation respiratory protection. Additionally, Germany’s leadership in sustainability will propel the transition to energy-efficient and environment-friendly SAR systems. FMI predicts that Germany's CAGR will be 6.2% from 2025 to 2035.
South Korea's SAR industry will grow as a result of its sophisticated technology infrastructure and stringent workplace safety standards. The electronics and semiconductor sectors will be major drivers of growth, with cleanroom safety needs driving demand for ultra-lightweight and high-filtration SARs.
Shipbuilding and heavy engineering sector growth will also drive adoption, as high-exposure activities need sophisticated respiratory solutions. The government's focus on enhancing occupational safety standards will compel industries to adopt AI-based SARs for better protection of workers. Furthermore, investments in disaster management and emergency response will open up new avenues for innovation. FMI believes that South Korea's CAGR will be 6.4% during 2025 to 2035.
Japan's SAR industry will experience steady growth, fueled by its emphasis on automation, robotics, and precision manufacturing. Japan's electronics and automotive sectors will be the key users of sophisticated SARs since clean manufacturing conditions necessitate top-notch respiratory protection. The move towards sustainable industrial processes will compel firms to come up with recyclable and energy-saving SAR designs.
Additionally, Japan's emergency preparedness programs, especially earthquake and nuclear safety, will drive more SAR demand in the emergency response space. Since the safety of workers is a prime concern, companies that invest in wearable technology and intelligent respiratory products will dominate the industry. FMI predicts the CAGR of Japan will be 6.1% during the forecast period.
France's robust chemical and petrochemical industries will be among the first to adopt state-of-the-art respiratory systems, as stringent emissions controls fuel spending on workplace safety. Expansion will also be boosted by France's growing defense and aerospace industries, where high-performance SARs are essential.
The surging emphasis on sustainable production and green protective equipment will challenge firms to become creative in material science and filtration technology. Furthermore, France's active response to crisis readiness and industrial hazard management will continue the demand for high-efficiency SARs. FMI opines that the CAGR of France will be 6.0% during the forecast period.
Italy's SAR industry will be influenced by its manufacturing, chemical, and construction sectors, where strict safety standards are fuelling uptake. As Italy deepens its industrial production and export capacity, the demand for efficient respirators will increase. Growth will also be driven by the food processing and pharmaceutical industries that will need advanced SARs to maintain contamination-free environments.
Growing demand for protection of workers while undertaking heritage restoration and dangerous material demolition work will further drive demand. Italy's resolve to follow green industrial practices will compel firms to find out SAR solutions that are energy-efficient and recyclable. FMI opines that Italy's CAGR will be 5.8% from 2025 to 2035.
The SAR industry in Australia and New Zealand will expand based on stringent occupational health and safety legislation, especially within mining, oil & gas, and the handling of hazardous materials. Both countries will create more demand for advanced respiratory protection with their strong air quality and worker safety regulations. The growing occurrence of bushfires in Australia will also drive SAR adoption within fire departments and emergency response services.
Workplace safety in food processing and agriculture will be a key focus for New Zealand as well, and it will contribute to industry expansion. FMI opines that the CAGR of Australia and New Zealand will reach 6.0% over the forecast period.
(Surveyed Q4 2024, n=450 stakeholder participants evenly distributed across manufacturers, distributors, and end-users in the USA, Western Europe, Japan, and South Korea)
Regional Variance:
High Variance:
Convergent and Divergent ROI Views:
73% of USA stakeholders found advanced filtration and automation to be 'worth the investment,' while 41% in Japan still favored traditional SARs with replaceable filters.
Agreement:
Variation:
Shared Challenges:
89% identified increasing cost of materials (silicone up 28%, electronic components up 22%) as a top concern.
Regional Differences:
Manufacturers:
Distributors:
End-Users (Industrial Workers & Emergency Responders):
Alignment:
76% of worldwide manufacturers intend to invest in AI-based airflow regulation and adaptive filtration technology.
Divergence:
High Consensus: Workplace safety compliance, durability, and material cost pressures are still common issues.
Key Variances:
| Country | Regulatory Impact & Mandatory Certifications |
|---|---|
| United States | 29 CFR 1910.134 by OSHA requires robust respiratory protection programs. NIOSH approval is required for SARs. The California Air Resources Board impacts low-emission production. |
| India | BIS standards and the Factories Act govern PPE compliance and industrial air quality. IS 14746 certification is required by companies for respiratory devices. 'Make in India' incentives from the government encourage domestic manufacturing. |
| China | GB 2626-2019 establishes national standards for respiratory protective equipment. Firms are required to meet CCC (China Compulsory Certification) for SARs. Stringent industrial emission regulations affect product uptake. |
| United Kingdom | HSE requires compliance with EN 14594 for continuous flow SARs. Brexit-driven regulatory changes necessitate CE or UKCA marking for market access. More stringent worker safety regulation drives SAR uptake. |
| Germany | EU-OSHA and DGUV regulation imposes rigorous protection for workers. EN 12941/12942 certification is obligatory for SARs. Germany excels in green SAR innovation because of sustainability initiatives. |
| South Korea | KOSHA (Korea Occupational Safety and Health Agency) governs respiratory safety in workplaces. KC certification is obligatory. High-tech demand for SARs is fueled by increasing semiconductor and chemical industries. |
| Japan | JIS T8150 governs SAR safety standards. METI and MHLW enforce regulations in workplaces. Cost-conscious uptake because of voluntary, not compulsory, enforcement. |
| France | ANSES applies strict worker exposure levels, fueling demand for SARs. Firms are required to conform to EN 14594 standards. Sustainable PPE production is encouraged through the French Green Plan. |
| Italy | INAIL safety guidelines require certified respiratory protection. EU standards (EN 12941/12942) are compulsory. Industrialization drives SAR deployment. |
| Australia-New Zealand | Safe Work Australia and WorkSafe NZ require AS/NZS 1716 compliance. Increasing mining and construction safety standards drive demand. Recent reforms of PPE quality control compel firms towards high-standard certifications. |
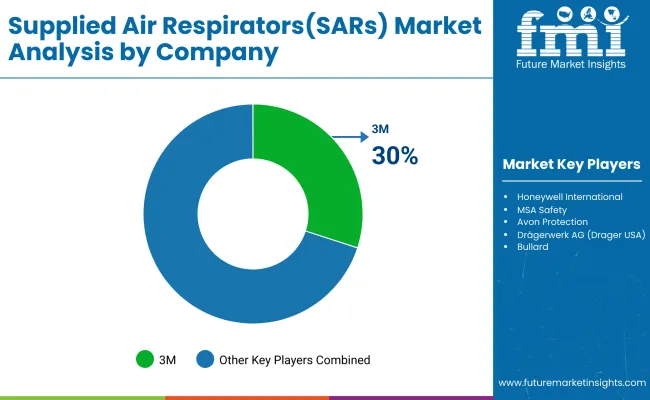
The global supplied air respirators (SAR) industry has a moderately concentrated competitive structure, with large players such as 3M, Honeywell, MSA Safety, and Avon Protection holding considerable market share while niche players find space in specialized use. These leaders in the industry compete on a mix of technological advancement, pricing strategies, expansion into international sectors, and compliance efforts.
In 2024, the competitive landscape heightened as firms concentrated on creating thinner, wiser respiratory products with capabilities such as Bluetooth connectivity and longer battery life while, at the same time, penetrating new emerging sectors and agreeing strategic alliances to enhance distribution channels.
A number of significant developments have characterized the sector in 2024, including 3M enhancing its industry foothold with the introduction of its next-generation G-series SAR systems directly targeting drug and chemical manufacturers.
Furthermore, Avon Protection closed a substantial USD 12 million USA Department of Defense contract in April for state-of-the-art SAR systems.
The competitive landscape has also been shaped by changing regulatory norms, such as OSHA's 2024 updates to respiratory protection standards, that have fueled rising demand for NIOSH-approved systems.

3M -~30-35%
Industrial and healthcare industry leader.
Honeywell - ~20-25%
Leader in oil & gas, chemical, and fire safety.
MSA Safety - ~15-20%
Leaders in firefighting and industrial safety.
Avon Protection - ~10-12%
Military & defense applications sector leader.
Draeger - ~8-10%
Medical and mining SAR solutions specialist.
Bullard - ~5-7%
Fire service and heavy industry specialist.
Self-contained Breathing Apparatus, Long Tube Respirators
Chemical Industry, Electronic Industry, Fire Protection Sector. Others
North America, Latin America, Western Europe, Eastern Europe, South Asia and Pacific, East Asia, Middle East and Africa
Increasing workplace safety regulations and rising awareness of respiratory hazards are pushing companies to adopt advanced supplied air respirators.
Firms are integrating features like real-time air quality monitoring, ergonomic designs, and enhanced filtration systems to improve user safety and comfort.
Sectors like chemicals, manufacturing, firefighting, and mining are rapidly adopting these respirators due to stringent safety requirements.
Supply chain disruptions, fluctuating raw material costs, and evolving regulatory standards pose significant hurdles for manufacturers.
Stricter occupational safety mandates and incentives for worker protection equipment are accelerating adoption across multiple industries.


Full Research Suite comprises of:
Market outlook & trends analysis
Interviews & case studies
Strategic recommendations
Vendor profiles & capabilities analysis
5-year forecasts
8 regions and 60+ country-level data splits
Market segment data splits
12 months of continuous data updates
DELIVERED AS:
PDF EXCEL ONLINE
Airless Paint Spray System Market Size and Share Forecast Outlook 2025 to 2035
Air Caster Skids System Market Size and Share Forecast Outlook 2025 to 2035
Airborne Molecular Contamination Control Services Market Forecast and Outlook 2025 to 2035
Airflow Balancer Market Size and Share Forecast Outlook 2025 to 2035
Aircraft Cabin Environment Sensor Market Forecast and Outlook 2025 to 2035
Aircraft Flight Control System Market Size and Share Forecast Outlook 2025 to 2035
Airborne Radar Market Size and Share Forecast Outlook 2025 to 2035
Aircraft Electric Motor Market Forecast Outlook 2025 to 2035
Airport Ground Transportation Market Forecast and Outlook 2025 to 2035
Airless Sprayer Accessories Market Size and Share Forecast Outlook 2025 to 2035
Air Purge Valve Market Size and Share Forecast Outlook 2025 to 2035
Air Flow Sensors Market Size and Share Forecast Outlook 2025 to 2035
Air Separation Plant Market Size and Share Forecast Outlook 2025 to 2035
Air Cooled Turbo Generators Market Size and Share Forecast Outlook 2025 to 2035
Aircraft Cooling Turbines Market Size and Share Forecast Outlook 2025 to 2035
Air Conditioning Compressor Market Size and Share Forecast Outlook 2025 to 2035
Air Measuring Equipment Market Size and Share Forecast Outlook 2025 to 2035
Aircraft Smoke Detection and Fire Extinguishing System Market Size and Share Forecast Outlook 2025 to 2035
Aircraft Hose Fittings Market Size and Share Forecast Outlook 2025 to 2035
Aircraft Cabin Interior Market Size and Share Forecast Outlook 2025 to 2035

Thank you!
You will receive an email from our Business Development Manager. Please be sure to check your SPAM/JUNK folder too.
Chat With
MaRIA