upramalleolar Osteotomy Implants Market Size and Share Forecast Outlook (2023 to 2033)

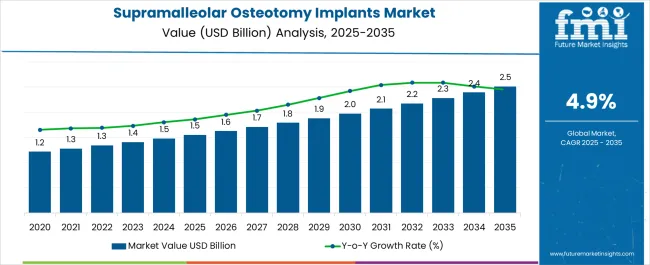
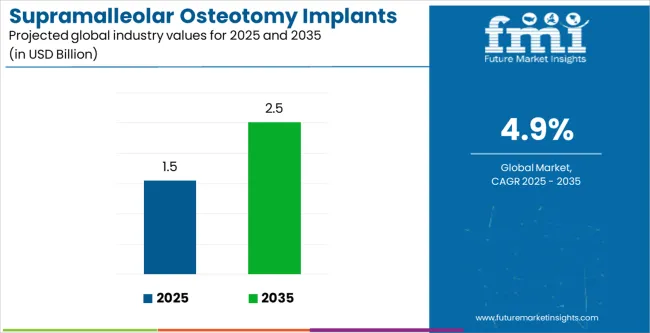
The supramalleolar osteotomy implants market size is projected to be worth USD 1.4 billion in 2023. The market is likely to surpass USD 2.3 billion by 2033 at a CAGR of 5.2% during the forecast period. The market growth is being propelled by increased degenerative joint diseases and ankle osteoarthritis. Supramalleolar osteotomy implants help to realign the bones in the lower leg and foot, providing stability and restoring proper function.

As a result of the different creeping diseases that have appeared pertaining to the bones, there has been a rapid increase in the incidence of orthopedic injuries in recent years. The number of bone injuries and fractures has increased in recent years as a result of the world's large senior population. Furthermore, the incidence of different types of local injuries caused by falls among the elderly proven to be a driving factor for market expansion.

Other Drivers Propelling the Demand for Supramalleolar Osteotomy Implants Include:

  • SMO implants have been shown to provide significant improvement in ankle function and pain relief for patients with specific ankle conditions. This positive clinical outcomes drive the market.
  • Many SMO procedures can be performed using minimally invasive techniques, which can result in smaller incisions. This factor contributes to the growing adoption of SMO implants.
  • Advances in implant design, materials, and surgical techniques have led to the development of improved SMO implants. For instance, 3D printing which has seen a significant demand in supramalleolar osteotomy surgeries.

Challenges for Companies /Manufacturers in the Supramalleolar Osteotomy Implants Market:

  • SMO implants and associated surgical equipment can be expensive. This cost may pose a barrier to their adoption.
  • Risk associated with SMO implants which includes infection, implant failure, nonunion (failure of bones to heal), malunion (improper bone alignment), and nerve or blood vessel damage. These risks can influence the decision-making process for surgeons and patients.
  • The surgical technique is complex and may have a steep learning curve for surgeons who are not experienced in this procedure. This factor can limit the widespread adoption of SMO implants.

Opportunities in the Supramalleolar Osteotomy Implants Industry:

  • There is a need for robust clinical studies and data collection to evaluate the efficacy and long-term outcomes of different implant designs and surgical techniques. This data-driven approach can help inform surgical decision-making, optimize treatment protocols, and improve patient outcomes.
  • Minimally invasive surgical techniques have gained popularity in recent years. These approaches aim to reduce tissue trauma, post-operative pain, and recovery time for patients. As a result, there is a growing demand for SMO implants.
  • As the population ages and the incidence of conditions like osteoarthritis rises, there is a growing demand for effective treatment options.

Latest Trends in the Supramalleolar Osteotomy Implants Market:

  • The increasing demand for modern techniques and advanced therapies which includes minimally invasive techniques are major trends in the market.
  • There is ongoing research and development to explore new materials or material combinations that can offer enhanced mechanical properties, such as improved strength-to-weight ratio or better fatigue resistance.
  • Collaboration between implant manufacturers, surgeons, and researchers for development of improved implant designs, surgical techniques, and patient outcomes.
Attributes Details
Supramalleolar Osteotomy Implants Market Size (2023) USD 1.4 billion
Supramalleolar Osteotomy Implants Market Projected Size (2033) USD 2.3 billion
Value CAGR (2023 to 2033) 5.2%

Comparison of Historical vs Future Outlook on Supramalleolar Osteotomy Implants Market Demand (2017 to 2022 vs 2023 to 2033)

From 2017 to 2022, the global supramalleolar osteotomy implants market experienced a CAGR of 4.2%, reaching a market size of USD 1.4 billion in 2023.

From 2017 to 2022, the global supramalleolar osteotomy implants industry witnessed steady growth due to the rising incidence and recognition of ankle-related conditions have driven the demand for SMO implants. There has been a significant increase in the awareness and diagnosis of ankle-related conditions such as ankle arthritis, malalignment, and instability. This has led to a greater number of patients seeking treatment options, including supramalleolar osteotomy.

Future Forecast for Supramalleolar Osteotomy Implants Industry:

Looking ahead, the global supramalleolar osteotomy implants industry is expected to rise at a CAGR of 5.2% from 2023 to 2033. During the forecast period, the market size is expected to reach USD 2.3 billion by 2033.

The future of SMO implants lies in the realm of customization. Advances in imaging technology, computer-assisted design (CAD), and 3D printing enable the creation of patient-specific implants tailored to an individual's anatomy. This customization potential can lead to improved implant fit, better alignment, and enhanced surgical outcomes.

Surgical techniques for supramalleolar osteotomy have advanced, allowing for improved precision, reduced invasiveness, and better patient outcomes. These advancements have contributed to the increased adoption of SMO procedures, driving the demand for SMO implants.
Future Market Forecast for the Supramalleolar Osteotomy Implants Industry

Supramalleolar Osteotomy Implants Market to Surge in the United States Due to Rising Prevalence of Osteoarthritis.

Country The United States
Market Size (USD million) by End of Forecast Period (2033) USD 766.2 million
CAGR % 2023 to End of Forecast (2033) 5.7%

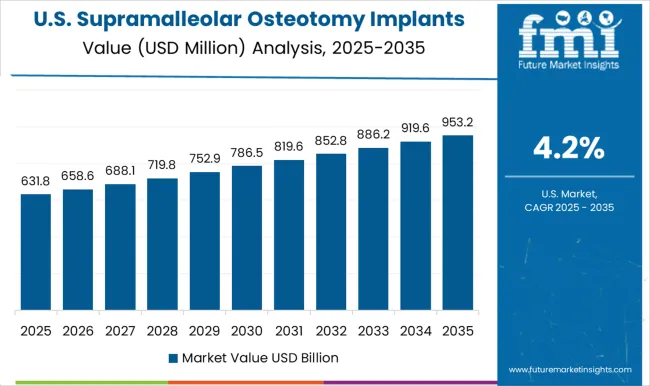
The supramalleolar osteotomy implants industry in the United States is expected to reach a market size of USD 766.2 million by 2033, expanding at a CAGR of 5.7%. Due to the rising incidence and recognition of arthritis conditions have driven the demand for SMO implants in the country. According to the Centers for Disease Control and Prevention, around 32.5 million persons in the United States had osteoarthritis in 2020. This has led to a greater number of patients seeking treatment options, including supramalleolar osteotomy.

Rising Demand for Supramalleolar Osteotomy Implants by Healthcare Professional to Propel the United Kingdom Market Growth

Country The United Kingdom
Market Size (USD million) by End of Forecast Period (2033) USD 134.4 million
CAGR % 2023 to End of Forecast (2033) 5.9%

The supramalleolar osteotomy implants industry in the United Kingdom is expected to reach a market share of USD 134.4 million by 2033, expanding at a CAGR of 5.9% during the forecast period. Surgeons in the UK have been adopting advanced surgical techniques for ankle realignment and stabilization, including SMO.

These techniques have been refined over time, resulting in improved outcomes and increased patient awareness. As patients become more aware of treatment options, they are seeking SMO procedures as a means to alleviate their ankle conditions.

Notable Growth Expected in China's Supramalleolar Osteotomy Implants Market Owing to Surge Collaborative Research and Development in Implants

Country China
Market Size (USD million) by End of Forecast Period (2033) USD 251.2 million
CAGR % 2023 to End of Forecast (2033) 6.8%

The supramalleolar osteotomy implants industry in China is anticipated to reach a market size of USD 251.2 million by 2033, moving at a CAGR of 6.8% during the forecast period. The supramalleolar osteotomy implants industry in China is expected to grow prominently due to the increasing collaborative research and clinical advancements in implants. The China has a strong research and clinical community that focuses on orthopedics and ankle surgery.

Collaborations between implant manufacturers, surgeons, and researchers have led to advancements in the understanding and treatment of ankle conditions. These collaborations contribute to the development of improved implant designs and surgical techniques, creating a favorable environment for the adoption of SMO implants.
Growing Awareness and Acceptance to Drive Market Growth in Japan

Country Japan
Market Size (USD million) by End of Forecast Period (2033) USD 184.7 million
CAGR % 2023 to End of Forecast (2033) 6.6%

The supramalleolar osteotomy implants industry in Japan is estimated to reach a market size of USD 184.7 million by 2033, thriving at a CAGR of 6.6%. The market in Japan is predicted to grow because factors such as aging demographics, sports injuries, and an active lifestyle contribute to the rise in ankle problems.

Ankle-related conditions such as ankle arthritis, malalignment, and instability are becoming more prevalent in the Japan population. As a result, there is a growing demand for effective surgical interventions like SMO, which drives the need for SMO implants.
Demand for Supramalleolar Osteotomy Implants is Rising Due to Increased Technological Advancements in Implants to Fuel Market Growth in South Korea

Country South Korea
Market Size (USD million) by End of Forecast Period (2033) USD 136.7 million
CAGR % 2023 to End of Forecast (2033) 6.4%

The supramalleolar osteotomy implants industry in South Korea is expected to reach a market size of USD 136.7 million by 2033, expanding at a CAGR of 6.4% during the forecast period. The market in South Korea is forecasted to witness growth due to surge in technological advancements in implant design.

he development of innovative implant designs has contributed to the increased demand for SMO implants. Modern SMO implants offer improved stability, fixation, and compatibility with minimally invasive techniques. These advancements make the procedure more appealing to both patients and surgeons, leading to a higher demand for SMO implants in the South Korea.

Country-Wise Insights on Supramalleolar Osteotomy Implants Market Trends

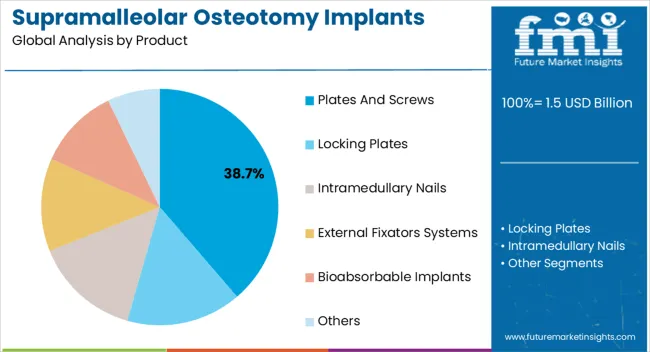
Plates and Screws to Dominate Supramalleolar Osteotomy Implants Industry with 5.1% CAGR through 2033

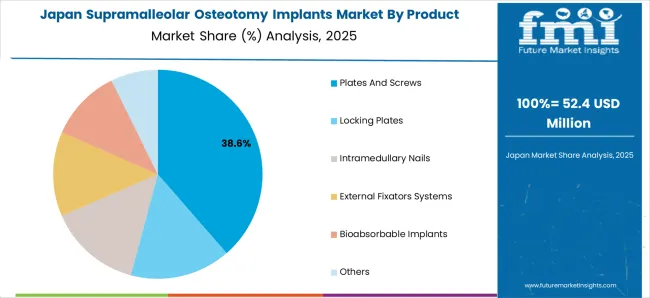
The plates and screws is expected to dominate the supramalleolar osteotomy implants industry with a CAGR of 5.1% from 2023 to 2033. This segment captures a significant market share in 2023 due to recent developments in plates.

A nickel-titanium alloy known as nitinol having shape-memory properties encourages a constant compressive force to fractured surfaces. Nitinol staples offers benefits that make them a significant implant material. Many key osteotomy plates market manufactures are incorporating nitinol to their products which is boosting the demand.

How the Varus Deformities are Driving Supramalleolar Osteotomy Implants Market?

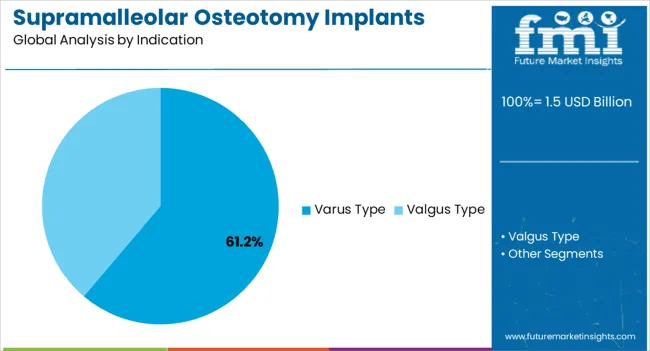
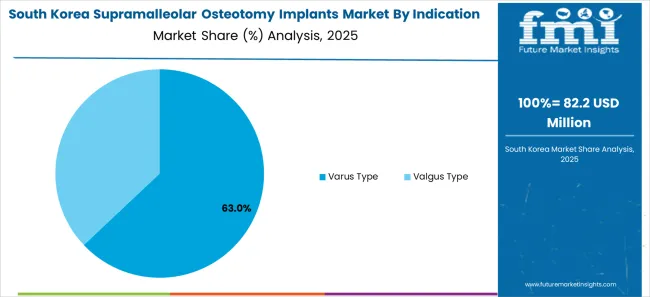
The varus deformities are expected to dominate the supramalleolar osteotomy implants industry with a CAGR of 5.4% from 2023 to 2033. There is a constant need for improvements in the treatment choices for osteoarthritis of the varus deformity. This covers the creation of novel surgical procedures, materials for implants, and methods for joint preservation that can lead to improved outcomes, quicker recoveries, and longer-lasting effects. Patients and medical professionals are looking for therapies that can cure varus-type osteoarthritis in a way that is efficient and long-lasting.

Which End User is Widely Adopted the Supramalleolar Osteotomy Implants?

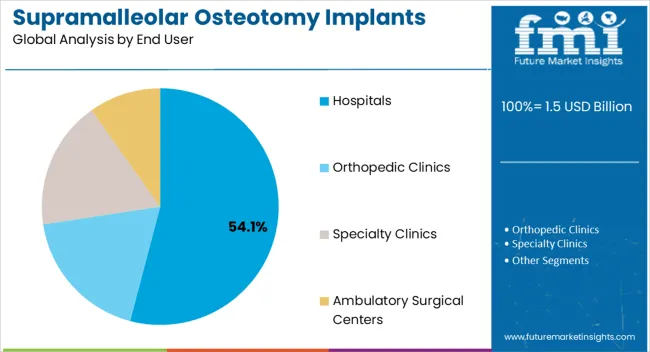
The hospital segment is expected to dominate the supramalleolar osteotomy implants industry with a CAGR of 4.7% from 2023 to 2033. With the help of cutting-edge medical technology, this industry sector gains a sizeable market share in 2023 and offers patients improved surgical results. Due to the accessibility of trained healthcare personnel and specialized services, hospitals have a high adoption rate for osteotomy implantation treatments.
Category-Wise Insights into Supramalleolar Osteotomy Implants Applications

The supramalleolar osteotomy implants sector is fiercely competitive, with many companies fighting for market dominance. To stay ahead of the competition in such a circumstance, essential players must employ smart techniques.

Key Strategies Used by the Participants

Product Development

Companies spend a lot of money on R&D to create new products that increase efficiency, reliability, and cost-effectiveness. Product innovation enables firms to distinguish themselves from their competitors while also meeting the changing needs of their customers.

Strategic Alliances & Collaborations

Key industry leaders typically form strategic alliances and collaborations with other businesses in order to leverage their strengths and expand their market reach. Such partnerships may also provide companies with access to new technologies and markets.

Expansion into Emerging Markets

The supramalleolar osteotomy implants industry is quickly increasing in emerging markets such as China and India. To boost their presence in these locations, key companies are expanding their distribution networks and establishing local production plants.

Acquisitions and mergers

Mergers and acquisitions are frequently used by key players in the supramalleolar osteotomy implants business to consolidate their market position, extend their product range, and gain access to new markets.

How Market Players Stay Competitive in the Supramalleolar Osteotomy Implants Industry

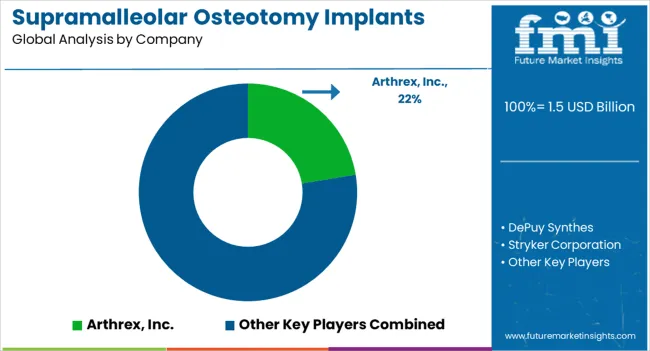
  • Arthrex, Inc.
  • DePuy Synthes
  • Stryker Corporation
  • Zimmer Biomet Holdings, Inc.
  • Smith & Nephew plc
  • CONMED Corporation
  • Wright Medical Group N.V.

Key Developments in the Supramalleolar Osteotomy Implants Market:

  • On May 23, 2023, Paragon 28 introduced the PRESERVE SMO Allograft System and Gorilla Supramalleolar Osteotomy (SMO) Plating for supramalleolar osteotomies
  • On Jun 29, 2022, the introduction of the EasyFuse Dynamic Compression System was announced by Stryker. The foot and ankle staple system was developed utilising nitinol to reduce surgical complexity.
  • On Sept. 1, 2022, Surgical Planning Associates and Zimmer Biomet Holdings, Inc. have entered into an exclusive multi-year co-marketing agreement. Zimmer Biomet Holdings, Inc. is a leader in medical technology.

Segmentation Analysis of the Supramalleolar Osteotomy Implants Market

By Product:

  • Plates and Screws
  • Locking Plates
  • Intramedullary Nails
  • External Fixators systems
  • Bioabsorbable Implants
  • Others

By Indication:

  • Varus Type
  • Valgus Type

By End User:

  • Hospitals
  • Orthopedic Clinics
  • Specialty clinics
  • Ambulatory Surgical Centers

By Region:

  • North America
  • Latin America
  • Europe
  • East Asia
  • South Asia
  • Oceania
  • The Middle East & Africa

Table of Content

  • 1. Executive Summary
  • 2. Market Overview
  • 3. Key Market Trends
  • 4. Value Added Insights
  • 5. Market Background
  • 6. Global Market Volume (in Units) Analysis 2017 to 2022 and Forecast, 2023 to 2033
  • 7. Global Market - Pricing Analysis
  • 8. Global Market Demand (in Value or Size in USD Million) Analysis 2017 to 2022 and Forecast, 2023 to 2033
  • 9. Global Market Analysis 2017 to 2022 and Forecast 2023 to 2033, By Product
    • 9.1. Plates and Screws
    • 9.2. Locking Plates
    • 9.3. Intramedullary Nails
    • 9.4. External Fixator Systems
    • 9.5. Bioabsorbable Implants
    • 9.6. Others
  • 10. Global Market Analysis 2017 to 2022 and Forecast 2023 to 2033, By Indication
    • 10.1. Varus Deformity
    • 10.2. Valgus Deformity
  • 11. Global Market Analysis 2017 to 2022 and Forecast 2023 to 2033, By End User
    • 11.1. Hospitals
    • 11.2. Orthopedic Clinics
    • 11.3. Specialty Clinics
    • 11.4. Ambulatory Surgical Centers
  • 12. Global Market Analysis 2017 to 2022 and Forecast 2023 to 2033, By Region
    • 12.1. North America
    • 12.2. Latin America
    • 12.3. Europe
    • 12.4. South Asia
    • 12.5. East Asia
    • 12.6. Oceania
    • 12.7. Middle East and Africa (MEA)
  • 13. North America Market Analysis 2017 to 2022 and Forecast 2023 to 2033
  • 14. Latin America Market Analysis 2017 to 2022 and Forecast 2023 to 2033
  • 15. Europe Market Analysis 2017 to 2022 and Forecast 2023 to 2033
  • 16. South Asia Market Analysis 2017 to 2022 and Forecast 2023 to 2033
  • 17. East Asia Market Analysis 2017 to 2022 and Forecast 2023 to 2033
  • 18. Oceania Market Analysis 2017 to 2022 and Forecast 2023 to 2033
  • 19. Middle East and Africa Market Analysis 2017 to 2022 and Forecast 2023 to 2033
  • 20. Market Structure Analysis
  • 21. Competition Analysis
    • 21.1. Arthrex, Inc.
    • 21.2. DePuy Synthes
    • 21.3. Stryker Corporation
    • 21.4. Zimmer Biomet Holdings, Inc.
    • 21.5. Smith & Nephew plc
    • 21.6. CONMED Corporation
    • 21.7. Wright Medical Group N.V.
  • 22. Assumptions and Acronyms Used
  • 23. Research Methodology

List of Tables

Table 01: Global Market Value (US$ Million) Analysis and Forecast 2017 to 2033, by Product

Table 02: Global Market Volume (Units) Analysis and Forecast 2017 to 2033, by Product

Table 03: Global Market Value (US$ Million) Analysis and Forecast 2017 to 2033, By Indication

Table 04: Global Market Value (US$ Million) Analysis and Forecast 2017 to 2033, By End User

Table 05: Global Market Value (US$ Million) Analysis and Forecast 2017 to 2033, by Region

Table 06: North America Market Value (US$ Million) Analysis 2017 to 2022 and Forecast 2023 to 2033, by Country

Table 07: North America Market Value (US$ Million) Analysis and Forecast 2017 to 2033, by Product

Table 08: North America Market Volume (Units) Analysis and Forecast 2017 to 2033, by Product

Table 09: North America Market Value (US$ Million) Analysis and Forecast 2017 to 2033, by Application

Table 10: North America Market Value (US$ Million) Analysis and Forecast 2017 to 2033, By End User

Table 11: Latin America Market Value (US$ Million) Analysis 2017 to 2022 and Forecast 2023 to 2033, by Country

Table 12: Latin America Market Value (US$ Million) Analysis and Forecast 2017 to 2033, by Product

Table 13: Latin America Market Volume (Units) Analysis and Forecast 2017 to 2033, by Product

Table 14: Latin America Market Value (US$ Million) Analysis and Forecast 2017 to 2033, by Application

Table 15: Latin America Market Value (US$ Million) Analysis and Forecast 2017 to 2033, By End User

Table 16: Europe Market Value (US$ Million) Analysis 2017 to 2022 and Forecast 2023 to 2033, by Country

Table 17: Europe Market Value (US$ Million) Analysis and Forecast 2017 to 2033, by Product

Table 18: Europe Market Volume (Units) Analysis and Forecast 2017 to 2033, by Product

Table 19: Europe Market Value (US$ Million) Analysis and Forecast 2017 to 2033, by Application

Table 20: Europe Market Value (US$ Million) Analysis and Forecast 2017 to 2033, By End User

Table 21: South Asia Market Value (US$ Million) Analysis 2017 to 2022 and Forecast 2023 to 2033, by Country

Table 22: South Asia Market Value (US$ Million) Analysis and Forecast 2017 to 2033, by Product

Table 23: South Asia Market Volume (Units) Analysis and Forecast 2017 to 2033, by Product

Table 24: South Asia Market Value (US$ Million) Analysis and Forecast 2017 to 2033, by Application

Table 25: South Asia Market Value (US$ Million) Analysis and Forecast 2017 to 2033, By End User

Table 26: East Asia Market Value (US$ Million) Analysis 2017 to 2022 and Forecast 2023 to 2033, by Country

Table 27: East Asia Market Value (US$ Million) Analysis and Forecast 2017 to 2033, by Product

Table 28: East Asia Market Volume (Units) Analysis and Forecast 2017 to 2033, by Product

Table 29: East Asia Market Value (US$ Million) Analysis and Forecast 2017 to 2033, by Application

Table 30: East Asia Market Value (US$ Million) Analysis and Forecast 2017 to 2033, By End User

Table 31: Oceania Market Value (US$ Million) Analysis 2017 to 2022 and Forecast 2023 to 2033, by Country

Table 32: Oceania Market Value (US$ Million) Analysis and Forecast 2017 to 2033, by Product

Table 33: Oceania Market Volume (Units) Analysis and Forecast 2017 to 2033, by Product

Table 34: Oceania Market Value (US$ Million) Analysis and Forecast 2017 to 2033, by Application

Table 35: Oceania Market Value (US$ Million) Analysis and Forecast 2017 to 2033, By End User

Table 36: Middle East and Africa Market Value (US$ Million) Analysis 2017 to 2022 and Forecast 2023 to 2033, by Country

Table 37: Middle East and Africa Market Value (US$ Million) Analysis and Forecast 2017 to 2033, by Product

Table 38: Middle East and Africa Market Volume (Units) Analysis and Forecast 2017 to 2033, by Product

Table 39: Middle East and Africa Market Value (US$ Million) Analysis and Forecast 2017 to 2033, by Application

Table 40: Middle East and Africa Market Value (US$ Million) Analysis and Forecast 2017 to 2033, By End User

List of Figures

Figure 01: Global Market Volume (Units), 2017 to 2022

Figure 02: Global Market Volume (Units) & Y-o-Y Growth (%) Analysis, 2023 to 2033

Figure 03:  Pricing Analysis per unit (US$), in 2023

Figure 04:  Pricing Forecast per unit (US$), in 2033

Figure 05: Global Market Value (US$ Million) Analysis, 2017 to 2022

Figure 06: Global Market Forecast & Y-o-Y Growth, 2023 to 2033

Figure 07: Global Market Absolute $ Opportunity (US$ Million) Analysis, 2022 to 2033

Figure 08: Global Market Value Share (%) Analysis 2023 and 2033, by Product

Figure 09: Global Market Y-o-Y Growth (%) Analysis 2022 to 2033, by Product

Figure 10: Global Market Attractiveness Analysis 2023 to 2033, by Product

Figure 11: Global Market Value Share (%) Analysis 2023 and 2033, By Indication

Figure 12: Global Market Y-o-Y Growth (%) Analysis 2022 to 2033, By Indication

Figure 13: Global Market Attractiveness Analysis 2023 to 2033, By Indication

Figure 14: Global Market Value Share (%) Analysis 2023 and 2033, By End User

Figure 15: Global Market Y-o-Y Growth (%) Analysis 2022 to 2033, By End User

Figure 16: Global Market Attractiveness Analysis 2023 to 2033, By End User

Figure 17: Global Market Value Share (%) Analysis 2023 and 2033, by Region

Figure 18: Global Market Y-o-Y Growth (%) Analysis 2022 to 2033, by Region

Figure 19: Global Market Attractiveness Analysis 2023 to 2033, by Region

Figure 20: North America Market Value (US$ Million) Analysis, 2017 to 2022

Figure 21: North America Market Value (US$ Million) Forecast, 2023-2033

Figure 22: North America Market Value Share, by Product (2023 E)

Figure 23: North America Market Value Share, By Indication (2023 E)

Figure 24: North America Market Value Share, By End User (2023 E)

Figure 25: North America Market Value Share, by Country (2023 E)

Figure 26: North America Market Attractiveness Analysis by Product, 2023 to 2033

Figure 27: North America Market Attractiveness Analysis By Indication, 2023 to 2033

Figure 28: North America Market Attractiveness Analysis By End User, 2023 to 2033

Figure 29: North America Market Attractiveness Analysis by Country, 2023 to 2033

Figure 30: USA Market Value Proportion Analysis, 2022

Figure 31: Global Vs. USA Growth Comparison

Figure 32: USA Market Share Analysis (%) by Product, 2022 & 2033

Figure 33: USA Market Share Analysis (%) By Indication, 2022 & 2033

Figure 34: USA Market Share Analysis (%) By End User, 2022 & 2033

Figure 35: Canada Market Value Proportion Analysis, 2022

Figure 36: Global Vs. Canada. Growth Comparison

Figure 37: Canada Market Share Analysis (%) by Product, 2022 & 2033

Figure 38: Canada Market Share Analysis (%) By Indication, 2022 & 2033

Figure 39: Canada Market Share Analysis (%) By End User, 2022 & 2033

Figure 40: Latin America Market Value (US$ Million) Analysis, 2017 to 2022

Figure 41: Latin America Market Value (US$ Million) Forecast, 2023-2033

Figure 42: Latin America Market Value Share, by Product (2023 E)

Figure 43: Latin America Market Value Share, By Indication (2023 E)

Figure 44: Latin America Market Value Share, By End User (2023 E)

Figure 45: Latin America Market Value Share, by Country (2023 E)

Figure 46: Latin America Market Attractiveness Analysis by Product, 2023 to 2033

Figure 47: Latin America Market Attractiveness Analysis By Indication, 2023 to 2033

Figure 48: Latin America Market Attractiveness Analysis By End User, 2023 to 2033

Figure 49: Latin America Market Attractiveness Analysis by Country, 2023 to 2033

Figure 50: Mexico Market Value Proportion Analysis, 2022

Figure 51: Global Vs Mexico Growth Comparison

Figure 52: Mexico Market Share Analysis (%) by Product, 2022 & 2033

Figure 53: Mexico Market Share Analysis (%) By Indication, 2022 & 2033

Figure 54: Mexico Market Share Analysis (%) By End User, 2022 & 2033

Figure 55: Brazil Market Value Proportion Analysis, 2022

Figure 56: Global Vs. Brazil. Growth Comparison

Figure 57: Brazil Market Share Analysis (%) by Product, 2022 & 2033

Figure 58: Brazil Market Share Analysis (%) By Indication, 2022 & 2033

Figure 59: Brazil Market Share Analysis (%) By End User, 2022 & 2033

Figure 60: Argentina Market Value Proportion Analysis, 2022

Figure 61: Global Vs Argentina Growth Comparison

Figure 62: Argentina Market Share Analysis (%) by Product, 2022 & 2033

Figure 63: Argentina Market Share Analysis (%) By Indication, 2022 & 2033

Figure 64: Argentina Market Share Analysis (%) By End User, 2022 & 2033

Figure 65: Europe Market Value (US$ Million) Analysis, 2017 to 2022

Figure 66: Europe Market Value (US$ Million) Forecast, 2023-2033

Figure 67: Europe Market Value Share, by Product (2023 E)

Figure 68: Europe Market Value Share, By Indication (2023 E)

Figure 69: Europe Market Value Share, By End User (2023 E)

Figure 70: Europe Market Value Share, by Country (2023 E)

Figure 71: Europe Market Attractiveness Analysis by Product, 2023 to 2033

Figure 72: Europe Market Attractiveness Analysis By Indication, 2023 to 2033

Figure 73: Europe Market Attractiveness Analysis By End User, 2023 to 2033

Figure 74: Europe Market Attractiveness Analysis by Country, 2023 to 2033

Figure 75: UK Market Value Proportion Analysis, 2022

Figure 76: Global Vs. UK Growth Comparison

Figure 77: UK Market Share Analysis (%) by Product, 2022 & 2033

Figure 78: UK Market Share Analysis (%) By Indication, 2022 & 2033

Figure 79: UK Market Share Analysis (%) By End User, 2022 & 2033

Figure 80: Germany Market Value Proportion Analysis, 2022

Figure 81: Global Vs. Germany Growth Comparison

Figure 82: Germany Market Share Analysis (%) by Product, 2022 & 2033

Figure 83: Germany Market Share Analysis (%) By Indication, 2022 & 2033

Figure 84: Germany Market Share Analysis (%) By End User, 2022 & 2033

Figure 85: Italy Market Value Proportion Analysis, 2022

Figure 86: Global Vs. Italy Growth Comparison

Figure 87: Italy Market Share Analysis (%) by Product, 2022 & 2033

Figure 88: Italy Market Share Analysis (%) By Indication, 2022 & 2033

Figure 89: Italy Market Share Analysis (%) By End User, 2022 & 2033

Figure 90: France Market Value Proportion Analysis, 2022

Figure 91: Global Vs France Growth Comparison

Figure 92: France Market Share Analysis (%) by Product, 2022 & 2033

Figure 93: France Market Share Analysis (%) By Indication, 2022 & 2033

Figure 94: France Market Share Analysis (%) By End User, 2022 & 2033

Figure 95: Spain Market Value Proportion Analysis, 2022

Figure 96: Global Vs Spain Growth Comparison

Figure 97: Spain Market Share Analysis (%) by Product, 2022 & 2033

Figure 98: Spain Market Share Analysis (%) By Indication, 2022 & 2033

Figure 99: Spain Market Share Analysis (%) By End User, 2022 & 2033

Figure 100: Russia Market Value Proportion Analysis, 2022

Figure 101: Global Vs Russia Growth Comparison

Figure 102: Russia Market Share Analysis (%) by Product, 2022 & 2033

Figure 103: Russia Market Share Analysis (%) By Indication, 2022 & 2033

Figure 104: Russia Market Share Analysis (%) By End User, 2022 & 2033

Figure 105: BENELUX Market Value Proportion Analysis, 2022

Figure 106: Global Vs BENELUX Growth Comparison

Figure 107: BENELUX Market Share Analysis (%) by Product, 2022 & 2033

Figure 108: BENELUX Market Share Analysis (%) By Indication, 2022 & 2033

Figure 109: BENELUX Market Share Analysis (%) By End User, 2022 & 2033

Figure 110: East Asia Market Value (US$ Million) Analysis, 2017 to 2022

Figure 111: East Asia Market Value (US$ Million) Forecast, 2023-2033

Figure 112: East Asia Market Value Share, by Product (2023 E)

Figure 113: East Asia Market Value Share, By Indication (2023 E)

Figure 114: East Asia Market Value Share, By End User (2023 E)

Figure 115: East Asia Market Value Share, by Country (2023 E)

Figure 116: East Asia Market Attractiveness Analysis by Product, 2023 to 2033

Figure 117: East Asia Market Attractiveness Analysis By Indication, 2023 to 2033

Figure 118: East Asia Market Attractiveness Analysis By End User, 2023 to 2033

Figure 119: East Asia Market Attractiveness Analysis by Country, 2023 to 2033

Figure 120: China Market Value Proportion Analysis, 2022

Figure 121: Global Vs. China Growth Comparison

Figure 122: China Market Share Analysis (%) by Product, 2022 & 2033

Figure 123: China Market Share Analysis (%) By Indication, 2022 & 2033

Figure 124: China Market Share Analysis (%) By End User, 2022 & 2033

Figure 125: Japan Market Value Proportion Analysis, 2022

Figure 126: Global Vs. Japan Growth Comparison

Figure 127: Japan Market Share Analysis (%) by Product, 2022 & 2033

Figure 128: Japan Market Share Analysis (%) By Indication, 2022 & 2033

Figure 129: Japan Market Share Analysis (%) By End User, 2022 & 2033

Figure 130: South Korea Market Value Proportion Analysis, 2022

Figure 131: Global Vs South Korea Growth Comparison

Figure 132: South Korea Market Share Analysis (%) by Product, 2022 & 2033

Figure 133: South Korea Market Share Analysis (%) By Indication, 2022 & 2033

Figure 134: South Korea Market Share Analysis (%) By End User, 2022 & 2033

Figure 135: South Asia Market Value (US$ Million) Analysis, 2017 to 2022

Figure 136: South Asia Market Value (US$ Million) Forecast, 2023-2033

Figure 137: South Asia Market Value Share, by Product (2023 E)

Figure 138: South Asia Market Value Share, By Indication (2023 E)

Figure 139: South Asia Market Value Share, By End User (2023 E)

Figure 140: South Asia Market Value Share, by Country (2023 E)

Figure 141: South Asia Market Attractiveness Analysis by Product, 2023 to 2033

Figure 142: South Asia Market Attractiveness Analysis By Indication, 2023 to 2033

Figure 143: South Asia Market Attractiveness Analysis By End User, 2023 to 2033

Figure 144: South Asia Market Attractiveness Analysis by Country, 2023 to 2033

Figure 145: India Market Value Proportion Analysis, 2022

Figure 146: Global Vs. India Growth Comparison

Figure 147: India Market Share Analysis (%) by Product, 2022 & 2033

Figure 148: India Market Share Analysis (%) By Indication, 2022 & 2033

Figure 149: India Market Share Analysis (%) By End User, 2022 & 2033

Figure 150: Indonesia Market Value Proportion Analysis, 2022

Figure 151: Global Vs. Indonesia Growth Comparison

Figure 152: Indonesia Market Share Analysis (%) by Product, 2022 & 2033

Figure 153: Indonesia Market Share Analysis (%) By Indication, 2022 & 2033

Figure 154: Indonesia Market Share Analysis (%) By End User, 2022 & 2033

Figure 155: Malaysia Market Value Proportion Analysis, 2022

Figure 156: Global Vs. Malaysia Growth Comparison

Figure 157: Malaysia Market Share Analysis (%) by Product, 2022 & 2033

Figure 158: Malaysia Market Share Analysis (%) By Indication, 2022 & 2033

Figure 159: Malaysia Market Share Analysis (%) By End User, 2022 & 2033

Figure 160: Thailand Market Value Proportion Analysis, 2022

Figure 161: Global Vs. Thailand Growth Comparison

Figure 162: Thailand Market Share Analysis (%) by Product, 2022 & 2033

Figure 163: Thailand Market Share Analysis (%) By Indication, 2022 & 2033

Figure 164: Thailand Market Share Analysis (%) By End User, 2022 & 2033

Figure 165: Oceania Market Value (US$ Million) Analysis, 2017 to 2022

Figure 166: Oceania Market Value (US$ Million) Forecast, 2023-2033

Figure 167: Oceania Market Value Share, by Product (2023 E)

Figure 168: Oceania Market Value Share, By Indication (2023 E)

Figure 169: Oceania Market Value Share, By End User (2023 E)

Figure 170: Oceania Market Value Share, by Country (2023 E)

Figure 171: Oceania Market Attractiveness Analysis by Product, 2023 to 2033

Figure 172: Oceania Market Attractiveness Analysis By Indication, 2023 to 2033

Figure 173: Oceania Market Attractiveness Analysis By End User, 2023 to 2033

Figure 174: Oceania Market Attractiveness Analysis by Country, 2023 to 2033

Figure 175: Australia Market Value Proportion Analysis, 2022

Figure 176: Global Vs. Australia Growth Comparison

Figure 177: Australia Market Share Analysis (%) by Product, 2022 & 2033

Figure 178: Australia Market Share Analysis (%) By Indication, 2022 & 2033

Figure 179: Australia Market Share Analysis (%) By End User, 2022 & 2033

Figure 180: New Zealand Market Value Proportion Analysis, 2022

Figure 181: Global Vs New Zealand Growth Comparison

Figure 182: New Zealand Market Share Analysis (%) by Product, 2022 & 2033

Figure 183: New Zealand Market Share Analysis (%) By Indication, 2022 & 2033

Figure 184: New Zealand Market Share Analysis (%) By End User, 2022 & 2033

Figure 185: Middle East & Africa Market Value (US$ Million) Analysis, 2017 to 2022

Figure 186: Middle East & Africa Market Value (US$ Million) Forecast, 2023-2033

Figure 187: Middle East & Africa Market Value Share, by Product (2023 E)

Figure 188: Middle East & Africa Market Value Share, By Indication (2023 E)

Figure 189: Middle East & Africa Market Value Share, By End User (2023 E)

Figure 190: Middle East & Africa Market Value Share, by Country (2023 E)

Figure 191: Middle East & Africa Market Attractiveness Analysis by Product, 2023 to 2033

Figure 192: Middle East & Africa Market Attractiveness Analysis By Indication, 2023 to 2033

Figure 193: Middle East & Africa Market Attractiveness Analysis By End User, 2023 to 2033

Figure 194: Middle East & Africa Market Attractiveness Analysis by Country, 2023 to 2033

Figure 195: GCC Countries Market Value Proportion Analysis, 2022

Figure 196: Global Vs GCC Countries Growth Comparison

Figure 197: GCC Countries Market Share Analysis (%) by Product, 2022 & 2033

Figure 198: GCC Countries Market Share Analysis (%) By Indication, 2022 & 2033

Figure 199: GCC Countries Market Share Analysis (%) By End User, 2022 & 2033

Figure 200: Türkiye Market Value Proportion Analysis, 2022

Figure 201: Global Vs. Türkiye Growth Comparison

Figure 202: Türkiye Market Share Analysis (%) by Product, 2022 & 2033

Figure 203: Türkiye Market Share Analysis (%) By Indication, 2022 & 2033

Figure 204: Türkiye Market Share Analysis (%) By End User, 2022 & 2033

Figure 205: South Africa Market Value Proportion Analysis, 2022

Figure 206: Global Vs. South Africa Growth Comparison

Figure 207: South Africa Market Share Analysis (%) by Product, 2022 & 2033

Figure 208: South Africa Market Share Analysis (%) By Indication, 2022 & 2033

Figure 209: South Africa Market Share Analysis (%) By End User, 2022 & 2033

Figure 210: Northern Africa Market Value Proportion Analysis, 2022

Figure 211: Global Vs Northern Africa Growth Comparison

Figure 212: Northern Africa Market Share Analysis (%) by Product, 2022 & 2033

Figure 213: Northern Africa Market Share Analysis (%) By Indication, 2022 & 2033

Figure 214: Northern Africa Market Share Analysis (%) By End User, 2022 & 2033

Frequently Asked Questions

What is the Supramalleolar Osteotomy Implants Market CAGR for 2033?

The supramalleolar osteotomy implants market CAGR for 2033 is 5.2%.

How Big Will the Supramalleolar Osteotomy Implants Market by 2033?

The market is estimated to reach USD 2.3 billion by 2033.

Who are the Key Supramalleolar Osteotomy Implants Market Players?

DePuy Synthes, Zimmer Biomet, and Smith & Nephew are key market players.

What is the Current Market Valuation of the Supramalleolar Osteotomy Implants Market?

The market is estimated to secure a valuation of USD 1.4 billion in 2023.

Which Region Holds a Significant Share of the Supramalleolar Osteotomy Implants Market?

North America holds a significant share of the market.

Explore Therapeutic Device Insights

Future Market Insights

Supramalleolar Osteotomy Implants Market