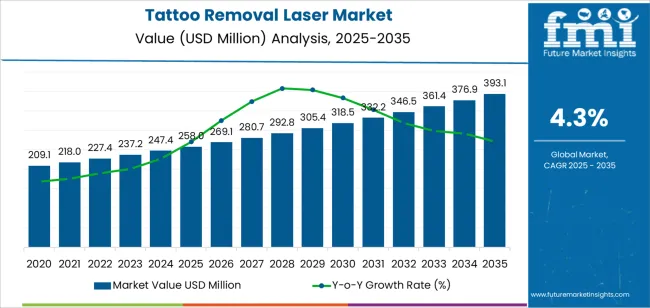
The tattoo removal laser market is experiencing robust growth driven by increasing demand for aesthetic treatments, advancements in laser technology, and growing awareness regarding safe and effective tattoo removal options. Market expansion is being supported by the rising number of individuals seeking corrective cosmetic procedures and the growing influence of beauty and wellness trends across both developed and emerging economies.
Manufacturers are focusing on improving laser precision, minimizing treatment discomfort, and reducing recovery time, thereby enhancing overall patient satisfaction. Regulatory approvals and clinical validations have strengthened consumer confidence in advanced laser systems, while continuous innovation in multi-wavelength and high-frequency laser devices is improving treatment outcomes.
The future outlook remains positive, with increasing investments in aesthetic infrastructure, the rise of specialized dermatology centers, and growing acceptance of non-invasive procedures These factors are expected to sustain steady revenue growth and broaden market penetration across diverse geographic regions.

| Metric | Value |
|---|---|
| Tattoo Removal Laser Market Estimated Value in (2025 E) | USD 258.0 million |
| Tattoo Removal Laser Market Forecast Value in (2035 F) | USD 393.1 million |
| Forecast CAGR (2025 to 2035) | 4.3% |
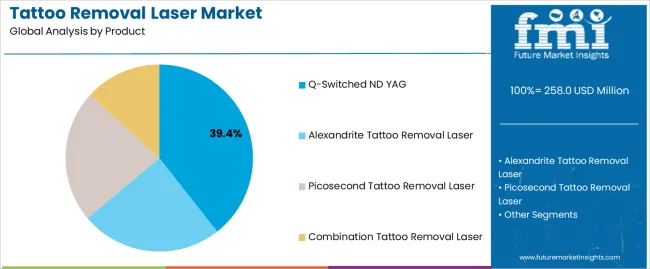
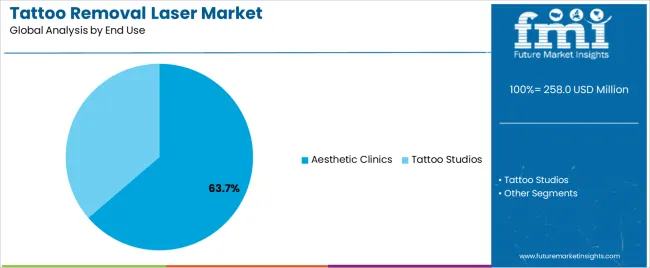
The market is segmented by Product and End Use and region. By Product, the market is divided into Q-Switched ND YAG, Alexandrite Tattoo Removal Laser, Picosecond Tattoo Removal Laser, and Combination Tattoo Removal Laser. In terms of End Use, the market is classified into Aesthetic Clinics and Tattoo Studios. Regionally, the market is classified into North America, Latin America, Western Europe, Eastern Europe, Balkan & Baltic Countries, Russia & Belarus, Central Asia, East Asia, South Asia & Pacific, and the Middle East & Africa.

The Q-Switched ND YAG segment, accounting for 39.40% of the product category, has emerged as the leading technology due to its proven efficacy in removing multi-colored tattoos with minimal skin damage. Its dominance is attributed to its ability to deliver high-intensity, short-pulse energy that effectively targets pigment particles while preserving surrounding tissues.
Market adoption has been supported by the device’s versatility across different skin types and pigmentation depths. Continuous technological upgrades, such as dual-wavelength options and enhanced beam delivery systems, have improved treatment precision and safety.
Demand has also been reinforced by the growing preference for shorter recovery periods and reduced post-treatment complications As awareness of aesthetic procedures increases, and device affordability improves across clinics, the Q-Switched ND YAG laser segment is expected to maintain its leading share and drive innovation within the tattoo removal laser market.

The aesthetic clinics segment, representing 63.70% of the end-use category, has retained market leadership due to the growing preference for professional, clinic-based tattoo removal services offering advanced laser technologies and skilled dermatologists. Its prominence is supported by the rapid expansion of cosmetic treatment centers and rising disposable incomes that encourage spending on aesthetic enhancements.
Aesthetic clinics provide comprehensive aftercare and personalized treatment plans, enhancing overall consumer experience and satisfaction. Market growth is further reinforced by the availability of multi-modal laser systems and customized service packages that cater to varying tattoo types and sizes.
The integration of digital imaging and treatment planning tools within clinics has improved accuracy and patient trust Over the forecast period, continued investments in aesthetic infrastructure, coupled with increasing consumer focus on appearance and self-expression, are expected to sustain the segment’s dominance and drive overall market expansion.
| Historical CAGR (2020 to 2025) | 6.8% |
|---|---|
| Forecast CAGR (2025 to 2035) | 4.30% |
Historically, the tattoo removal laser industry exhibited a CAGR of 6.8% from 2020 to 2025. This growth can be attributed to several factors:
The forecasted CAGR for the tattoo removal laser industry from 2025 to 2035 is 4.30%, indicating a deceleration in growth compared to the historical period. Several factors may contribute to this slowdown:
Rising Demand for Non-Invasive Procedures
The trend towards non-invasive cosmetic procedures has spurred a corresponding increase in demand for tattoo removal lasers. As consumers prioritize minimally invasive treatments over surgical options like excision or dermabrasion, tattoo removal lasers offer a less invasive alternative with comparable effectiveness and fewer risks, driving market growth and adoption rates.
Diversity in Ink Colors
Tattoos featuring vibrant and intricate ink colors, including fluorescent and UV-reactive pigments, present unique challenges for removal. Consequently, there is a growing need for tattoo removal lasers capable of effectively targeting and eliminating a wide range of tattoo colors.
Advances in laser technology, such as the development of specialized wavelengths and pulse durations, address this demand by offering solutions tailored to the diverse spectrum of ink pigments, enhancing treatment outcomes and customer satisfaction.
Advancements in Skin Typing and Pigment Analysis
Recent advancements in skin typing and pigment analysis technologies have revolutionized the tattoo removal process. By providing more accurate assessments of skin types and tattoo characteristics, these innovations enable practitioners to tailor treatment plans for optimal results.
Personalized approaches to tattoo removal enhance efficacy, minimize side effects, and improve patient satisfaction, driving demand for laser-based removal procedures and shaping the future of the industry.
Combination Therapies
The emergence of combination therapies in tattoo removal has expanded treatment options and improved outcomes for patients. By combining laser treatments with topical agents or complementary energy-based devices, practitioners can address diverse tattoo characteristics and optimize results.
Combination therapies offer enhanced efficacy, reduced side effects, and shorter treatment times compared to single-modality approaches, making them increasingly popular among patients seeking comprehensive tattoo removal solutions.
This section provides detailed insights into specific segments in the tattoo removal laser industry.
| By Product | Q-Switched Laser |
|---|---|
| Market Share in 2025 | 68% |
Q-switched lasers are poised to remain the dominant product segment in the tattoo removal laser industry, capturing a substantial market share of 68% in 2025.
| Leading End User | Aesthetic Clinics |
|---|---|
| Market Share in 2025 | 77% |
Aesthetic clinics are expected to retain their leading position as the primary end user segment, holding a significant market share of 77% in 2025.
The section analyzes the tattoo removal laser market across key countries, including the United States, United Kingdom, India, Thailand, and Germany. The analysis delves into the specific factors driving the demand for tattoo removal laser in these countries.
| Countries | CAGR |
|---|---|
| United States | 3.2% |
| United Kingdom | 2.20% |
| India | 6.7% |
| Thailand | 6.2% |
| Germany | 2.70% |
The tattoo removal laser industry in the United States is anticipated to rise at a CAGR of 3.2% through 2035.
The tattoo removal laser industry in the United Kingdom is projected to rise at a CAGR of 2.20% through 2035.
India’s tattoo removal laser industry is likely to witness expansion at a CAGR of 6.70% through 2035.
Thailand's tattoo removal laser industry is projected to rise at a CAGR of 6.2% through 2035.
Germany's tattoo removal laser market is expected to rise at a 2.70% CAGR through 2035.

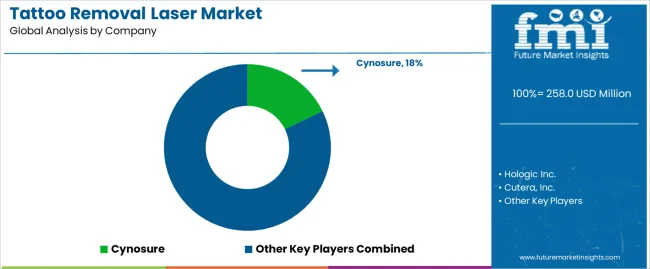
The tattoo removal laser industry contains a blend of established medical device companies with a long history of developing and manufacturing laser technologies, alongside smaller, niche players focusing on specific laser technologies or catering to particular market segments.
Additionally, new entrants are continuously emerging, often driven by advancements in laser technology, affordability, or unique service models.
In this industry, companies strive to differentiate themselves through various strategies. This includes emphasizing unique features like advanced laser technology offering faster treatment times, reduced side effects, or specialized applicators for specific tattoo colors or skin types.
Additionally, companies are focusing on value creation by offering competitive pricing models, convenient treatment options, and comprehensive patient consultations to build trust and attract customers.
As the industry matures, collaboration and strategic partnerships are gaining traction. This allows companies to leverage each other's strengths, expand their geographic reach, and offer patients a wider range of treatment options.
Additionally, collaborations with research institutions or universities can lead to the development of new and more effective laser technologies, further propelling innovation within the market.
Recent Developments in the Tattoo Removal Laser Industry
The global tattoo removal laser market is estimated to be valued at USD 258.0 million in 2025.
The market size for the tattoo removal laser market is projected to reach USD 393.1 million by 2035.
The tattoo removal laser market is expected to grow at a 4.3% CAGR between 2025 and 2035.
The key product types in tattoo removal laser market are q-switched nd yag, _q-switched tattoo removal laser, _ruby, alexandrite tattoo removal laser, picosecond tattoo removal laser and combination tattoo removal laser.
In terms of end use, aesthetic clinics segment to command 63.7% share in the tattoo removal laser market in 2025.


Our Research Products

The "Full Research Suite" delivers actionable market intel, deep dives on markets or technologies, so clients act faster, cut risk, and unlock growth.

The Leaderboard benchmarks and ranks top vendors, classifying them as Established Leaders, Leading Challengers, or Disruptors & Challengers.

Locates where complements amplify value and substitutes erode it, forecasting net impact by horizon

We deliver granular, decision-grade intel: market sizing, 5-year forecasts, pricing, adoption, usage, revenue, and operational KPIs—plus competitor tracking, regulation, and value chains—across 60 countries broadly.

Spot the shifts before they hit your P&L. We track inflection points, adoption curves, pricing moves, and ecosystem plays to show where demand is heading, why it is changing, and what to do next across high-growth markets and disruptive tech

Real-time reads of user behavior. We track shifting priorities, perceptions of today’s and next-gen services, and provider experience, then pace how fast tech moves from trial to adoption, blending buyer, consumer, and channel inputs with social signals (#WhySwitch, #UX).

Partner with our analyst team to build a custom report designed around your business priorities. From analysing market trends to assessing competitors or crafting bespoke datasets, we tailor insights to your needs.
Supplier Intelligence
Discovery & Profiling
Capacity & Footprint
Performance & Risk
Compliance & Governance
Commercial Readiness
Who Supplies Whom
Scorecards & Shortlists
Playbooks & Docs
Category Intelligence
Definition & Scope
Demand & Use Cases
Cost Drivers
Market Structure
Supply Chain Map
Trade & Policy
Operating Norms
Deliverables
Buyer Intelligence
Account Basics
Spend & Scope
Procurement Model
Vendor Requirements
Terms & Policies
Entry Strategy
Pain Points & Triggers
Outputs
Pricing Analysis
Benchmarks
Trends
Should-Cost
Indexation
Landed Cost
Commercial Terms
Deliverables
Brand Analysis
Positioning & Value Prop
Share & Presence
Customer Evidence
Go-to-Market
Digital & Reputation
Compliance & Trust
KPIs & Gaps
Outputs
Full Research Suite comprises of:
Market outlook & trends analysis
Interviews & case studies
Strategic recommendations
Vendor profiles & capabilities analysis
5-year forecasts
8 regions and 60+ country-level data splits
Market segment data splits
12 months of continuous data updates
DELIVERED AS:
PDF EXCEL ONLINE
Tattoo Removal Patch Market
Laser Hair Removal Devices Market Analysis - Growth & Forecast 2025 to 2035
Laser Frequency Splitting and Mode Competition Teaching Instrument Market Size and Share Forecast Outlook 2025 to 2035
Laser Component Analyzer Market Size and Share Forecast Outlook 2025 to 2035
Laser-Assisted Smart Lathes Market Size and Share Forecast Outlook 2025 to 2035
Laser Drilling Equipment Market Size and Share Forecast Outlook 2025 to 2035
Laser Transverse Mode Teaching Instrument Market Forecast and Outlook 2025 to 2035
Laser Welding Equipment Market Forecast and Outlook 2025 to 2035
Laser Welding Market Size and Share Forecast Outlook 2025 to 2035
Tattoo Needles Market Size and Share Forecast Outlook 2025 to 2035
Laser Ablation Systems Market Size and Share Forecast Outlook 2025 to 2035
Laser Measurement Integrating Sphere Market Size and Share Forecast Outlook 2025 to 2035
Laser Safety Cloths Market Size and Share Forecast Outlook 2025 to 2035
Laser Dazzler Market Size and Share Forecast Outlook 2025 to 2035
Laser Cable Marking Market Size and Share Forecast Outlook 2025 to 2035
Laser Cladding Market Size and Share Forecast Outlook 2025 to 2035
Laser Marking Equipment Market Size and Share Forecast Outlook 2025 to 2035
Laser Cutting Machines Market Size and Share Forecast Outlook 2025 to 2035
Laser Wire Marking Systems Market Size and Share Forecast Outlook 2025 to 2035
Laser Photomask Market Size and Share Forecast Outlook 2025 to 2035

Thank you!
You will receive an email from our Business Development Manager. Please be sure to check your SPAM/JUNK folder too.
Chat With
MaRIA