

- Market Size (2026)
- USD 72.1 Bn
- Forecast (2036)
- USD 124.3 Bn
- CAGR (2026 to 2036)
- 5.6%
How big is Theme Park Tourism Market in 2026?
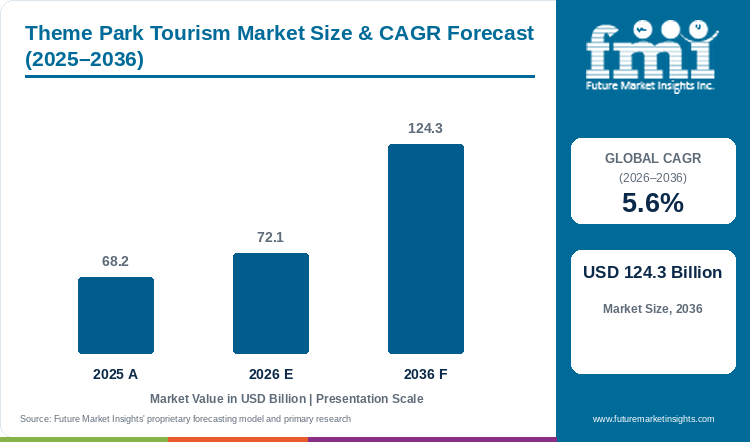
Assessed at USD 68.2 billion in 2025 and progressing to USD 72.1 billion in 2026, the theme park tourism market valuation is on course to reach USD 124.3 billion by 2036, supported by a forecast-period CAGR of 5.6%.
Paid express-queue tiers and franchise land additions govern per-guest yield expansion across destination resort complexes. During 2025, global theme park tourism market size recorded USD 68.2 billion prior to hitting USD 72.1 billion for 2026. By 2036, global industry valuation is slated to attain USD 124.3 billion on a 5.6% CAGR. IP-Branded Mega Amusement and Theme Parks secure 56.4% of 2026 park type value because extra-large parks achieve a 0.760 positive emotion score versus 0.702 at smaller venues [11]. That multi-day resort model separates the category from resort wave aquaparks at 8.0% CAGR, since mega parks bundle multi-night hotel packages with tiered ride reservations [1]. Operators are scaling franchise capacity to capture those multi-day stays as Universal Epic Universe lifted Comcast fourth-quarter 2025 theme park EBITDA past USD 1,035 million [2]. Oriental Land Co. Ltd. also achieved record per-guest receipts of JPY 18,403 in fiscal 2026 [6]. FMI survey insights suggest that multi-billion-dollar coaster capital intensity and statutory hourly wage escalation remain the primary commercial hurdles through 2036 [7].
Key Market Trends & Insights
- By park type: IP-Branded Mega Amusement and Theme Parks command 56.4% of 2026 park type value because proprietary movie and gaming lands draw international fly-in guests.
- By monetization stream: Gate Admissions and Express Queue Passes represent 51.8% in 2026 through date-based dynamic ticket pricing and paid virtual-queue upgrades.
- By visitor group: Families with Children contribute 61.2% for 2026 as multi-generational households book bundled character-dining and resort hotel packages.
- By traveler age cohort: Travelers aged 28 to 54 in the Millennial and Gen-X segment generate 46.8% during 2026 through parental financing of family vacations and nostalgia-driven adult attendance.
Regional Highlights
- Top national expansion: The United Arab Emirates leads country-level growth at a 7.2% CAGR through 2036 supported by AED 12 billion Yas Island commitments.
- Broader country progression: Japan posts a 5.9% CAGR ahead of the United States at 5.4% while France registers 5.2% and the United Kingdom records 5.1%.
Market Size & Forecast
Table 1: Market Size and Forecast for the Theme Park Tourism Market (USD billion and CAGR percentage), 2025 to 2036
| Metric | Value |
|---|---|
| 2025 Market Size | USD 68.2 billion |
| Estimated Market Size in 2026 | USD 72.1 billion |
| Projected Market Size by 2036 | USD 124.3 billion |
| CAGR, 2026 to 2036 | 5.6% |
| Added Valuation, 2026 to 2036 | USD 52.2 billion |
Destination theme park operators prioritize per-capita guest yield growth over raw turnstile headcount discounts to protect operating margins against rising park labor and energy bills. In August 2026, The Walt Disney Company reported that third-quarter fiscal 2026 Experiences segment operating income rose 20% to USD 3,017 million as domestic per-capita guest outlays climbed 4% [1]. Management teams now pair branded amusement attractions with mobile app lightning-lane reservations so guests wait less time in queues and dedicate more hours to themed retail and dining zones.
Turnstile Attendance and Per-Capita Yield Sizing
Table 2: Turnstile Attendance and Per-Capita Yield Sizing for the Theme Park Tourism Market (USD billion and operational ranges), 2025 to 2036
| Metric | 2025 | 2026 | 2036 |
|---|---|---|---|
| Market size (USD billion) | 68.2 | 72.1 | 124.3 |
| Global commercial theme and amusement park attendance (million visits) | 865.0 to 920.0 | 895.0 to 955.0 | 1,290.0 to 1,380.0 |
| On-property and partner resort hotel room-nights (million) | 118.0 to 130.0 | 124.0 to 137.0 | 195.0 to 215.0 |
| Average blended per-capita guest outlay per park visit (USD) | 74.0 to 79.0 | 75.5 to 80.5 | 90.0 to 96.5 |
Operational note: Blended per-capita guest outlay benchmarks reflect combined gate admissions and express queue passes with in-park dining and licensed merchandise as well as on-site resort lodging.
Regional thrill parks and global mega resorts exhibit wide gaps in per-guest monetization depending on intellectual property strength and overnight hotel attachment. In February 2026, Six Flags Entertainment Corporation disclosed full-year 2025 attendance of 47.4 million guests with per-capita outlays of USD 61.90 split between USD 33.41 in admissions and USD 28.49 in in-park products [5]. Operators therefore add indoor entertainment centers and seasonal Halloween and winter festival events to lift in-park dining and collectible merchandise attachment.
Per Capita & Destination Resort Complex Sizing
Table 3: Per Capita and Park Complex Valuation Indicators for the Theme Park Tourism Market (USD), 2025 to 2036
| Metric | 2025 | 2026 | 2036 |
|---|---|---|---|
| World population (billion) | 8.2 | 8.3 | 9.0 |
| Market value per 1,000 people (USD) | 8,317.1 | 8,686.7 | 13,811.1 |
| Annual valuation per commercial theme park venue (USD million) | 72.0 to 80.0 | 75.0 to 84.0 | 118.0 to 132.0 |
| Express pass and ancillary in-park share (%) | 46.0% to 49.0% | 47.5% to 50.5% | 52.0% to 56.0% |
Table 4: Park Venue & Monetization Stream Valuation Indicators for the Theme Park Tourism Market (USD and percentages), 2026
| Metric | Value | Institutional Reference Basis |
|---|---|---|
| Market size, 2026 | USD 72.1 billion | 2026 global valuation baseline |
| Commercial mega, regional, and resort water parks global | 910 venues | Major destination and regional gated amusement venues |
| Market value per gated venue | USD 79.2 million | Annualized admissions, lodging, and in-park valuation |
| Gate Admissions and Express Queue Passes value, 2026 | USD 37.3 billion | 51.8% monetization stream allocation |
Frontline cast-member service consistency and shaded rest zones directly govern repeat season-pass renewals when ticket prices rise. An October 2025 study in BMC Psychology surveyed 384 attraction visitors and proved that unequal staff-visitor interaction reduced revisit intention with a total effect of minus 0.38 at p below 0.001 [12]. Resort planners now pair staff hospitality training with climate-controlled leisure venues so families remain comfortable during peak summer afternoons.
Analyst Perspective
"Theme park operators no longer chase volume through deep season-pass discounting. They build multi-gate franchise worlds where express ride reservations and interactive character merchandise along with on-site hotel early entry push per-guest receipts higher every year. Parks that pair exclusive film IP with indoor climate-controlled attractions will capture the highest margin growth through 2036."
- Ronak Shah, Principal Consultant, Future Market Insights.
How is the theme park tourism market segmented?
The theme park tourism market is segmented across four core axes covering park type and monetization stream with visitor group and traveler age cohort. In 2026, IP-Branded Mega Amusement and Theme Parks account for 56.4% of park type value while Gate Admissions and Express Queue Passes represent 51.8% of receipts.
By park type: IP-Branded Mega Amusement and Theme Parks lead ahead of Water Parks and Indoor Resort Aquaparks and Regional Thrill Coaster and Edutainment Parks.
By monetization stream: Gate Admissions and Express Queue Passes lead ahead of On-Property Resort Hotels and Vacation Packages. The category also includes In-Park Dining and Licensed Merchandise.
By visitor group: Families with Children lead ahead of Young Adults and International Tour Groups.
By traveler age cohort: Adults in the 28 to 54 year Millennial and Gen-X bracket hold the top position ahead of Boomers aged 55+ and Gen-Z young adult visitors.
Why do IP-Branded Mega Amusement and Theme Parks lead the park type category?
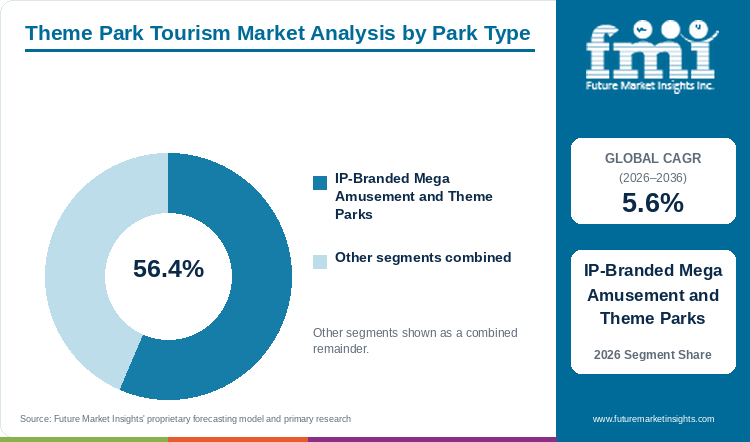
IP-Branded Mega Amusement and Theme Parks command 56.4% of 2026 park type valuation, anchored by multi-gate franchise lands and international tourist draw.
Table 5: Park Type Share for the Theme Park Tourism Market (percentage share), 2026
| Park Type | Share (2026) |
|---|---|
| IP-Branded Mega Amusement and Theme Parks | 56.4% |
| Other Segments Combined | 43.6%* |
| Total | 100.0% |
*Note: Water parks and regional thrill parks contribute the remaining 43.6% of 2026 theme park tourism valuation.
Table 6: Park Type Leadership and Market Growth for the Theme Park Tourism Market (segment and CAGR percentage), 2026 to 2036
| Metric | Value |
|---|---|
| Global CAGR (2026 to 2036) | 5.6% |
| Primary Segment | IP-Branded Mega Amusement and Theme Parks |
IP-Branded Mega Amusement and Theme Parks dominate global valuation because exclusive cinema and gaming franchise lands convert single-day amusement outings into four-to-seven-night destination vacations. A June 2026 study in PLOS One analyzed 144,360 visitor reviews across 106 theme parks and confirmed that extra-large IP parks achieved a 0.760 positive emotion score versus 0.702 for smaller parks [11]. Operators integrate international leisure travel packages with multi-park hopper passes to lock guests into flagship resort campuses.
- IP-Branded Mega Amusement and Theme Parks hold 56.4% of park type value in 2026 because multi-gate resorts command premium admission tariffs and multi-day stays.
- Comcast Corporation reported in January 2026 that the May 2025 opening of Universal Epic Universe propelled fourth-quarter 2025 Theme Parks receipts up 21.9% to USD 2,893 million [2].
What sustains Gate Admissions and Express Queue Passes leadership in the monetization stream segment?
Gate Admissions and Express Queue Passes represent 51.8% of the monetization stream category in 2026, supported by tiered calendar pricing and paid line-skipping passes.
Gate Admissions and Express Queue Passes generate the majority of resort receipts because dynamic calendar ticketing charges peak rates during school holidays while paid express passes monetize guest time sensitivity. Visitors flying internationally for a once-in-a-decade trip readily purchase single-ride and full-day express access to guarantee entry onto flagship dark rides. Parks also bundle coastal water recreation admission upgrades during summer months to expand multi-gate ticket yields.
- Gate Admissions and Express Queue Passes represent 51.8% of monetization stream value in 2026 as mobile line-skipping passes deliver near-100% incremental operating margin.
- The Walt Disney Company reported in August 2026 that third-quarter fiscal 2026 theme park admissions reached USD 3,253 million, up 9% year-on-year on higher average ticket realization [1].
How do On-Property Resort Hotels and In-Park Merchandise expand ancillary resort monetization?
On-Property Resort Hotels and Vacation Packages with In-Park Dining and Licensed Merchandise account for 48.2% of combined monetization stream value in 2026.
On-Property Resort Hotels and Vacation Packages combine with In-Park Dining and Licensed Merchandise to capture the remaining 48.2% of resort receipts by retaining guest wallets twenty-four hours a day. Themed hotels grant guests early morning park entry that drives occupancy above 90%, while interactive wands and themed dining reservations lift in-park per-capita outlays. Operators construct upscale resort hospitality and compact transit hotels right at park turnstiles to capture both luxury and value-conscious overnight families.
- On-property hotels and in-park food and merchandise capture 48.2% of 2026 receipts as Disney Q3 FY2026 Resorts and vacations reached USD 2,766 million up 17% and Parks food and merchandise reached USD 2,284 million [1].
- Oriental Land Co. Ltd. reported in April 2026 that Fantasy Springs lifted Tokyo Disney Resort hotel occupancy to 94.7% and hotel receipts up 7.8% to JPY 119.0 billion in FY3/2026 [6].
Why do Families with Children lead the visitor group category?
Families with Children secure 61.2% of visitor group value in 2026, anchored by school-holiday travel calendars and dedicated preschool theme park formats.
Families with Children account for 61.2% of visitor group demand because parents plan annual vacations around milestone childhood visits to character parks and brick-building resorts. Multi-person family bookings multiply admission ticket and meal-plan receipts per reservation compared with solo travelers. Destination resort groups now construct standalone junior parks and children recreational programs specifically engineered for families with children under ten years old.
- Families with Children secure 61.2% of visitor group value in 2026 as operators roll out dedicated regional parks scaled for toddler and elementary-school cohorts.
- Comcast NBCUniversal confirmed in June 2026 that Universal Kids Resort in Frisco with a 300-room hotel opens on July 1, 2026 [3], while Merlin Entertainments opened LEGOLAND Shanghai and Peppa Pig Theme Park Dallas-Fort Worth in 2025 [4].
What gives Millennials and Gen-X 28 to 54 Years the leading position in traveler age cohort?
The 28 to 54 year Millennial and Gen-X age cohort captures 46.8% of traveler age cohort value for 2026, supported by peak household earning power and franchise nostalgia.
Guests between 28 and 54 years old in the Millennial and Gen-X group top age-cohort demand at 46.8% because these adults finance family vacations while attending classic film franchise events. Adult Millennial and Gen-X visitors drive premium attendance at after-hours food and wine festivals and Halloween horror nights. Destination operators also integrate integrated resort entertainment and evening dining districts to capture adult night-time outlays.
- Adult guests aged 28 to 54 in the Millennial and Gen-X group secure 46.8% of 2026 age-cohort value through higher adoption of VIP guided tours and table-service dining.
- Merlin Entertainments Limited reported in March 2026 that strategic focus on guest experience and dynamic pricing delivered 8.6% commercial per-capita growth across 60.5 million visitors in 2025 [4].
What are the drivers, restraints, and opportunities in the theme park tourism market?
In the theme park tourism market, multi-billion-dollar IP land openings and dynamic express-pass pricing are projected to drive adoption whereas statutory wage inflation and extreme summer heat restrain outdoor operations and indoor Gulf region and preschool resort formats create high-growth opportunities.
- Driver: Multi-gate expansions anchored by blockbuster animation and video-game franchises extend average guest length of stay and support double-digit hotel and admissions growth.
- Restraint: High capital investment cycles for custom roller coasters with rising municipal minimum wages and summer heatwaves pressure regional park EBITDA margins.
- Opportunity: Climate-controlled indoor mega parks in the Gulf region and standalone preschool family resorts generate year-round attendance in previously underserved catchments.
Growth Analysis and Future Potential: Qualitative Demand Drivers
Full-year operations of newly opened immersive theme park lands are generating sustained increases in municipal tourism taxes and on-site resort hotel occupancy. In June 2026, Comcast NBCUniversal reported that the first anniversary of Universal Epic Universe in Orlando drove twelve consecutive months of Orange County tourism tax growth and generated USD 2 billion in economic impact for Florida [3]. New franchise gates in Asia and Europe reinforce that momentum, as The Walt Disney Company reported strong international demand in February 2026 for Zootopia at Shanghai Disneyland ahead of the 2026 debut of World of Frozen in Disneyland Paris [14].
Risk Assessment of the Theme Park Tourism Market: Labor Inflation and Weather Volatility
Statutory hourly park wage increases and extreme summer temperatures create margin friction for outdoor regional amusement operators that lack multi-day resort pricing power. In its February 2026 Form 10-K filing with the U.S. Securities and Exchange Commission, United Parks and Resorts Inc. disclosed that the minimum wage for theme park employees in San Diego rises to USD 19.00 per hour on July 1, 2026 [7]. Six Flags Entertainment Corporation also reported in February 2026 that debt service across USD 5,117 million in total debt and weather-sensitive operating days weighed on net profitability despite USD 3,100.3 million in 2025 receipts [5].
Commercial Opportunity Analysis: Asset-Light Licensing and Regional Park Consolidation
Global operators are capturing high-return expansion by licensing flagship IP to state-backed Middle East developers while consolidating high-potential regional parks across Europe. In May 2025, The Walt Disney Company and Miral announced plans to develop a landmark waterfront Disney theme park and resort on Yas Island in Abu Dhabi funded and operated by Miral under Disney Imagineering creative oversight [9]. In September 2026, Miral committed over AED 12 billion across five years to expand Yas Island theme parks and resort hotels [8], while Compagnie des Alpes launched a EUR 250 million Parc Asterix expansion plan and acquired Germany's Belantis park in April 2025 to convert into Parc Asterix Germany [10].
Theme Park Tourism Market by Country (2026 to 2036)
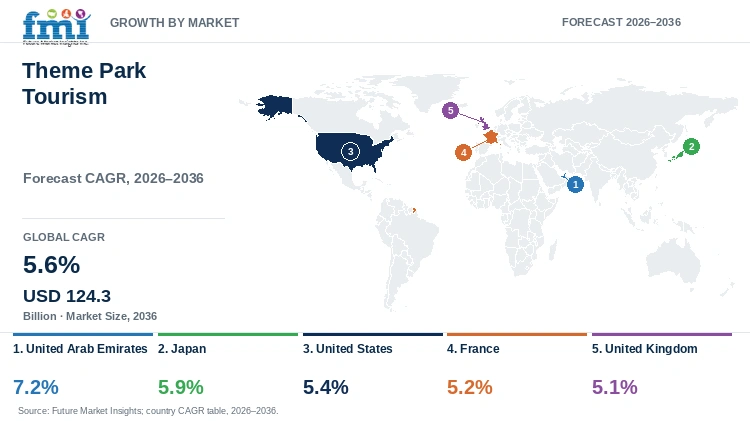
Regional demand modeling places the United Arab Emirates first in theme park tourism expansion with a 7.2% CAGR to 2036 ahead of Japan at 5.9% with the United States recording 5.4%. France at 5.2% and the United Kingdom at 5.1% anchor Western Europe destination resort volume.
Table 7: Country CAGR and Primary Growth Levers for the Theme Park Tourism Market (CAGR percentage and operational growth levers), 2026 to 2036
| Country | CAGR (2026 to 2036) | Primary Growth Lever |
|---|---|---|
| United Arab Emirates | 7.2% | AED 12 billion Yas Island investment and planned Disney Abu Dhabi resort |
| Japan | 5.9% | Record JPY 18,403 per-guest receipts at Tokyo Disney Resort and 25th park anniversaries |
| United States | 5.4% | Universal Epic Universe full-year ramp and July 2026 Universal Kids Resort opening |
| France | 5.2% | World of Frozen debut at Disneyland Paris and EUR 250 million Parc Asterix investment |
| United Kingdom | 5.1% | Merlin Entertainments resort upgrades and Universal UK Bedford project planning |
Source: Future Market Insights analysis
United Arab Emirates Theme Park Tourism Market Outlook (2026 to 2036)
Climate-controlled indoor mega parks and sovereign leisure investments propel the United Arab Emirates to a global-leading 7.2% CAGR through 2036. Fully air-conditioned complexes on Yas Island in Abu Dhabi including Warner Bros. World and SeaWorld Abu Dhabi along with Ferrari World maintain peak family attendance throughout extreme summer heat months. Global studio licensing and multi-year capital commitments are now expanding that indoor resort footprint. In May 2025, The Walt Disney Company and Miral signed a landmark agreement to build a waterfront Disney theme park resort on Yas Island [9]. In September 2026, Miral committed over AED 12 billion across five years to expand Yas Island attractions and hotels under Abu Dhabi Tourism Strategy 2030 [8].
Key takeaway: In the United Arab Emirates, Miral's AED 12 billion Yas Island expansion and the planned Disney Abu Dhabi resort are projected to drive a 7.2% CAGR.
Japan Theme Park Tourism Market Outlook (2026 to 2036)
Premium paid express passes and themed hotel integration drive a projected 5.9% CAGR in Japan from 2026 to 2036. Operators in Tokyo and Osaka enforce daily turnstile attendance caps while maximizing per-visitor realization through vacation packages and seasonal collectible merchandise. In April 2026, Oriental Land Co. Ltd. reported record FY3/2026 consolidated receipts of JPY 704.5 billion as Tokyo Disney Resort welcomed 27.53 million guests at a record JPY 18,403 per guest and 94.7% hotel occupancy following the Fantasy Springs expansion [6]. Milestone resort celebrations are sustaining that pricing power. In January 2026, JTB Tourism Research forecast 307 million domestic travelers and 41.4 million inbound visitors as Tokyo DisneySea and Universal Studios Japan celebrate 25th anniversaries [13].
Key takeaway: In Japan, record JPY 18,403 per-guest resort yields and 25th anniversary celebrations at Tokyo DisneySea and Universal Studios Japan are forecast to sustain 5.9% growth.
United States Theme Park Tourism Market Outlook (2026 to 2036)
Fourth-gate destination resort expansions in Florida and new regional preschool parks in Texas drive a 5.4% CAGR across United States destination parks through 2036. Major studio operators rely on dynamic calendar pricing and lightning-lane ride reservations to expand operating margins across mature domestic parks. In August 2026, The Walt Disney Company reported Q3 FY2026 Experiences operating income up 20% to USD 3,017 million on 4% higher domestic per-capita guest outlays [1]. New park gates are simultaneously expanding total resort capacity. Comcast NBCUniversal documented in June 2026 that Universal Epic Universe generated USD 2 billion in Florida economic impact during its first year ahead of the July 1, 2026 debut of Universal Kids Resort in Frisco [3].
Key takeaway: In the United States, Universal Epic Universe capacity ramp-up and high per-capita express and hotel realization are estimated to anchor a 5.4% CAGR.
France Theme Park Tourism Market Outlook (2026 to 2036)
Second-gate franchise transformations and on-site hotel expansions at the two largest resorts near Paris sustain a 5.2% CAGR across France theme park resorts from 2026 to 2036. Both flagship campuses are converting single-day rail commuters into multi-night resort hotel guests through immersive themed lands. In February 2026, The Walt Disney Company confirmed the 2026 opening of World of Frozen within the reimagined Disney Adventure World second gate at Disneyland Paris [14]. Domestic historical theme parks are matching that capital intensity. In December 2025, Compagnie des Alpes reported record FY2024/25 Leisure Parks EBITDA up 23.8% to EUR 176 million and launched a EUR 250 million investment plan through 2030 at Parc Asterix featuring the Londinium indoor coaster [10].
Key takeaway: In France, the World of Frozen expansion at Disneyland Paris and EUR 250 million Parc Asterix upgrades are slated to drive 5.2% annual growth.
United Kingdom Theme Park Tourism Market Outlook (2026 to 2036)
Short-break themed resort hotels and proposed international studio park developments support a 5.1% CAGR across United Kingdom gated attractions between 2026 and 2036. Domestic park operators co-locate themed castle and woodland lodges next to regional coaster gates to lift per-family accommodation and dining receipts. In March 2026, Merlin Entertainments Limited reported 60.5 million global visitors and GBP 1,999 million in 2025 receipts with 8.6% commercial per-capita growth across its portfolio led by Alton Towers and LEGOLAND Windsor [4]. Multi-billion-dollar inbound studio development is set to reinforce long-term destination capacity. In June 2026, Comcast NBCUniversal confirmed its regional Europe expansion roadmap featuring a planned Universal destination theme park resort in Bedford north of London [3].
Key takeaway: In the United Kingdom, Merlin Entertainments per-capita yield management and short-break themed hotel packages are predicted to support a 5.1% CAGR.
Full report country CAGRs cover North America and Latin America with Western Europe and Eastern Europe. Coverage also spans East Asia, South Asia and Pacific, and Middle East and Africa.
Who are the notable companies in the theme park tourism market?
The Walt Disney Company Disney Experiences and Universal Destinations & Experiences Comcast along with Merlin Entertainments Limited lead global operations in the theme park tourism market. Six Flags Entertainment Corporation and Oriental Land Co. Ltd. as well as United Parks & Resorts Inc. also hold major market shares.
Commercial tiers across the theme park tourism sector distinguish global IP destination resort conglomerates and high-yield Asia-Pacific licensed resort operators from regional thrill park chains.
- Global IP Destination Resort Conglomerates: The Walt Disney Company Disney Experiences and Universal Destinations & Experiences Comcast integrate proprietary film studios with multi-gate resorts and on-property hotel complexes.
- High-Yield Licensed and Family Edutainment Groups: Oriental Land Co. Ltd. operates Tokyo Disney Resort at world-leading per-guest realization, while Merlin Entertainments Limited runs global LEGOLAND resorts and short-break theme parks.
- Regional Thrill Coaster and Marine Park Chains: Six Flags Entertainment Corporation and United Parks & Resorts Inc. operate extensive North America portfolios of roller-coaster and marine-life theme parks.
Competitive Benchmarking: Theme Park Tourism Market
Table 8: Competitive Benchmarking for the Theme Park Tourism Market (qualitative capability ratings), 2026
| Company | Proprietary IP Strength | On-Site Hotel Integration | Per-Capita Yield Growth | Geographic Reach |
|---|---|---|---|---|
| The Walt Disney Company Disney Experiences | High | High | High | Global resorts in US, France, Japan, China, and planned Abu Dhabi |
| Universal Destinations & Experiences Comcast | High | High | High | Orlando Epic Universe, Hollywood, Texas Kids Resort, Japan, China |
| Merlin Entertainments Limited | High | Medium to High | High | 60.5 million visitors across LEGOLAND resorts, UK parks, and Shanghai |
| Six Flags Entertainment Corporation | Medium | Low to Medium | Medium to High | 47.4 million guests across merged North America regional thrill parks |
| Oriental Land Co. Ltd. | High | High | High | 27.53 million guests at Tokyo Disneyland and Tokyo DisneySea |
| United Parks & Resorts Inc. | Medium to High | Low to Medium | Medium to High | SeaWorld, Busch Gardens, and Discovery Cove parks across the US |
Evaluation basis: Proprietary IP Strength evaluates ownership or long-term licensing of blockbuster entertainment franchises, while On-Site Hotel Integration measures resort room inventory connected directly to park gates.
Key Developments in the Theme Park Tourism Market
- The Walt Disney Company and Miral announced plans on May 7, 2025 to build a waterfront Disney theme park and resort on Yas Island in Abu Dhabi [9], followed by Miral's AED 12 billion five-year Yas Island investment commitment in September 2026 [8].
- Comcast NBCUniversal marked the first anniversary of Universal Epic Universe in Orlando on June 3, 2026 with USD 2 billion in Florida economic impact and confirmed the July 1, 2026 opening of Universal Kids Resort in Texas [3].
- Oriental Land Co. Ltd. reported record FY3/2026 consolidated net receipts of JPY 704.5 billion and record per-guest realization of JPY 18,403 on April 28, 2026 following full-year operation of Fantasy Springs at Tokyo DisneySea [6].
Key Players in the Theme Park Tourism Market
Global IP Destination Resort Conglomerates
- The Walt Disney Company Disney Experiences
- Universal Destinations & Experiences Comcast
High-Yield Licensed and Family Edutainment Groups
- Oriental Land Co. Ltd.
- Merlin Entertainments Limited
Regional Thrill Coaster and Marine Park Chains
- Six Flags Entertainment Corporation
- United Parks & Resorts Inc.
Theme Park Tourism Market - Report Scope
Table 9: Report Scope for the Theme Park Tourism Market (coverage fields and definitions), 2026 to 2036
| Coverage field | Report scope |
|---|---|
| Market breakdown | Park Type, Monetization Stream, Visitor Group, and Traveler Age Cohort |
| Quantitative Units | USD Billion |
| Market Definition | Includes commercial guest outlays at IP-branded mega theme parks, water parks and indoor resort aquaparks, and regional thrill and edutainment parks across gate admissions, express queue passes, on-property resort hotels, and in-park food, beverage, and licensed merchandise. Excludes standalone municipal fairs, un-gated city parks, and cruise ship operations. |
| Regions Covered | North America, Latin America, Western Europe, Eastern Europe, East Asia, South Asia and Pacific, and Middle East and Africa |
| Countries Covered | United Arab Emirates, Japan, United States, France, United Kingdom, and additional national markets in the full report |
| Key Companies Covered | The Walt Disney Company Disney Experiences, Universal Destinations & Experiences Comcast, Merlin Entertainments Limited, Six Flags Entertainment Corporation, Oriental Land Co. Ltd., and United Parks & Resorts Inc. |
| Forecast Period | 2026 to 2036 |
| Approach | Primary and secondary research with top-down and bottom-up market triangulation. |
Theme Park Tourism Market - Research Methodology
Table 10: Research Methodology for the Theme Park Tourism Market (research methods and approach), 2026 edition
| Method | Approach |
|---|---|
| Primary Research | Structured interviews with destination resort yield managers, theme park operations directors, express-queue pricing analysts, and resort hotel general managers to validate per-capita admission and ancillary attachment rates. |
| Secondary Research | Analysis of SEC Form 10-K and 8-K filings from Disney, Comcast, Six Flags, and United Parks & Resorts as well as Oriental Land Co., Merlin Entertainments, and Compagnie des Alpes financial disclosures and peer-reviewed tourism journals. |
| Market Sizing and Forecasting | Top-down attractions and resort hospitality baselines reconciled against bottom-up global theme park turnstile attendance (895.0M to 955.0M visits in 2026) and blended per-capita guest outlays from 2026 to 2036. |
| Country Forecasting Model | Econometric national projections weight multi-gate IP land additions, indoor climate-controlled park investments, on-property hotel room counts, and inbound international tourist arrivals across five core countries. |
| Operational Benchmark Traceability | Attendance and per-capita guest outlay indicators in Tables 2, 3, and 4 trace directly to audited FY2025 and FY2026 corporate segment disclosures and municipal tourism tax records. |
| Data Triangulation and Validation | Valuation estimates isolate gated theme and water park admissions, express passes, in-park food and merchandise, and on-site resort hotel packages while strictly excluding cruise lines and consumer streaming subscriptions. |
Theme Park Tourism Market by Segments
Theme Park Tourism Market segmented by Park Type:
- IP-Branded Mega Amusement and Theme Parks
- Water Parks and Indoor Resort Aquaparks
- Regional Thrill Coaster and Edutainment Parks
Theme Park Tourism Market segmented by Monetization Stream:
- Gate Admissions and Express Queue Passes
- On-Property Resort Hotels and Vacation Packages
- In-Park Dining and Licensed Merchandise
Theme Park Tourism Market segmented by Visitor Group:
- Families with Children
- Young Adults and International Tour Groups
Theme Park Tourism Market segmented by Traveler Age Cohort:
- Millennials and Gen-X 28 to 54 Years
- Affluent Boomers and Seniors 55+ Years
- Gen-Z and Young Adult Explorers
Theme Park Tourism Market by Region
- North America
- United States
- Canada
- Latin America
- Brazil
- Mexico
- Argentina
- Chile
- Western Europe
- France
- United Kingdom
- Germany
- Spain
- Italy
- Benelux
- Eastern Europe
- Poland
- Czech Republic
- Hungary
- East Asia
- Japan
- China
- South Korea
- South Asia and Pacific
- India
- ASEAN
- Australia and New Zealand
- Middle East and Africa
- United Arab Emirates
- Saudi Arabia
- South Africa
- Turkiye
Research Sources and Bibliography
- [1] The Walt Disney Company. (2026, August 5). The Walt Disney Company Reports Third Quarter and Nine Months Earnings for Fiscal 2026. The Walt Disney Company Investor Relations.
- [2] Comcast Corporation. (2026, January 29). Comcast Reports 4th Quarter and Full Year 2025 Results. Comcast Corporation Investor Relations.
- [3] Comcast Corporation. (2026, June 3). As Universal Epic Universe Marks One Year, Comcast NBCUniversal Universal Destinations and Experiences Continues Investing in U.S. Growth. Comcast Corporate Newsroom.
- [4] Merlin Entertainments Limited. (2026, March 24). Merlin Entertainments Delivers Resilient Performance In 2025 And Establishes Strong Platform For Sustainable Growth. Merlin Entertainments Official Newsroom.
- [5] Six Flags Entertainment Corporation. (2026, February 19). Six Flags Entertainment Corporation Reports 2025 Fourth Quarter and Full Year Results, Form 8-K Exhibit 99.1. U.S. Securities and Exchange Commission EDGAR.
- [6] Oriental Land Co. Ltd. (2026, April 28). Summary of Financial Results for the Fiscal Year Ended March 31, 2026. Oriental Land Co. Ltd. Investor Relations.
- [7] United Parks and Resorts Inc. (2026, February 24). Annual Report Pursuant to Section 13 or 15(d) of the Securities Exchange Act of 1934 for the Fiscal Year Ended December 31, 2025, Form 10-K. U.S. Securities and Exchange Commission EDGAR.
- [8] Miral. (2026, September 14). Miral Invests AED 12 billion to Shape the Next Phase of Yas Island Growth. Miral Official Newsroom Abu Dhabi.
- [9] The Walt Disney Company. (2025, May 7). The Walt Disney Company and Miral Announce Plans for Disney Theme Park and Resort on Yas Island, Abu Dhabi. The Walt Disney Company Official Press Releases.
- [10] Compagnie des Alpes. (2025, December 2). Financial Results 2024 to 2025, Objectives and Outlook. Compagnie des Alpes Financial Newsroom.
- [11] Guo, X., Chen, Z., & Li, Y. (2026, June 18). How do theme park attributes influence visitors positive emotions, Nonlinear effects and spatial heterogeneity in Shanghai theme parks. PLOS One, 21(6), e0344051 (PMCID PMC13278401).
- [12] Yang, H., Zhang, L., & Wu, M. (2025, October 28). How does interactional justice differentiation influence tourists revisit intention, the roles of tourism experience quality, tourist loyalty, and tourist tolerance. BMC Psychology, 13, 1184 (PMCID PMC12560474).
- [13] JTB Tourism Research and Consulting Co. (2026, January 8). Travel Trends Forecast for 2026, January to December. JTB Official Research Reports Japan.
- [14] The Walt Disney Company. (2026, February 2). Disney Q1 FY26 Earnings, Executive Commentary. The Walt Disney Company Official Newsroom.
This bibliography is provided for reader reference and is not exhaustive. The full report contains the complete citation list across all primary and secondary sources.
This Report Answers
- How large is the theme park tourism market in 2026 and what is forecast for 2036?
- Which franchise land openings and paid express-pass strategies support demand for theme park tourism?
- Why do IP-Branded Mega Amusement and Theme Parks lead the park type category?
- Why do Gate Admissions and Express Queue Passes lead the monetization stream category globally?
- How do national growth rates compare across major destination resort markets through 2036?
- Which leading operators run global multi-gate IP resorts versus regional thrill coaster chains today?
- What limits regional park margins or causes summer attendance volatility in the theme park tourism market?
- What should destination resort developers evaluate before committing capital to indoor versus outdoor theme park lands?
Frequently Asked Questions
How big is the theme park tourism market in 2026, and what is forecast for 2036?
In 2025, global theme park tourism valuation registered USD 68.2 billion before advancing to USD 72.1 billion in 2026. Total industry size is forecast to reach USD 124.3 billion by 2036.
What is the CAGR for the theme park tourism market from 2026 to 2036?
Global theme park tourism is slated to progress at a 5.6% CAGR across 2026 to 2036, creating USD 52.2 billion in additional market valuation.
Which park type segment leads the theme park tourism market?
IP-Branded Mega Amusement and Theme Parks hold 56.4% of park type demand in 2026 because proprietary movie and gaming franchises attract international multi-day resort visitors.
Which monetization stream segment leads the theme park tourism market?
Gate Admissions and Express Queue Passes represent 51.8% of the monetization stream category in 2026 through dynamic calendar ticket pricing and high-margin paid line-skipping passes.
Which country has a notable growth outlook during the assessment period?
The United Arab Emirates sits atop national growth rankings at a 7.2% CAGR to 2036, supported by Miral's AED 12 billion Yas Island investment and the planned Disney Abu Dhabi resort.
Who are the key players in the market?
The Walt Disney Company Disney Experiences and Universal Destinations & Experiences Comcast along with Merlin Entertainments Limited lead global operations. Six Flags Entertainment Corporation and Oriental Land Co. Ltd. as well as United Parks & Resorts Inc. also hold major shares.
Preview the report firsthand - request a free sample
Get SampleGet the brochure for pricing and purchase details.
Get PDFTable of Content
- Key Takeaways
- Market Size and CAGR
- Top Growth Driver
- Fastest Growing Segment
- Leading Region
- Key Companies
- Emerging Opportunities
- Executive Summary
- Global Market Outlook
- Demand-side Trends
- Supply-side Trends
- Technology Roadmap Analysis
- Analysis and Recommendations
- Analyst Perspective (What is happening? Why now? What should investors know?)
- Key Questions Answered
- How large is the market?
- What is the CAGR?
- What are key trends?
- Which region dominates?
- Who are the leaders?
- Market Overview
- Market Coverage / Taxonomy
- Market Definition / Scope / Limitations
- Research Methodology
- Chapter Orientation
- Analytical Lens and Working Hypotheses
- Market Structure, Signals, and Trend Drivers
- Benchmarking and Cross-market Comparability
- Market Sizing, Forecasting, and Opportunity Mapping
- Research Design and Evidence Framework
- Desk Research Programme (Secondary Evidence)
- Expert Input and Fieldwork (Primary Evidence)
- Tooling, Models, and Reference Databases
- Data Engineering and Model Build
- Quality Assurance and Audit Trail
- Market Background
- Market Dynamics (Drivers, Restraints, Opportunity, Trends)
- Scenario Forecast (Optimistic, Likely, Conservative)
- Impact Analysis
- AI Impact
- Sustainability Impact
- Regulatory Impact
- Technology Impact
- Consumer / Buyer Analysis
- Purchase Drivers
- Adoption Barriers
- Buyer Journey
- Opportunity Map Analysis
- Product Life Cycle Analysis
- Supply Chain Analysis
- Investment Feasibility Matrix
- Value Chain Analysis
- PESTLE and Porter's Analysis
- Regulatory Landscape
- Regional Parent Market Outlook
- Production and Consumption Statistics
- Import and Export Statistics
- Global Market Analysis and Forecast, 2021 to 2036
- Historical Market Size Value (USD Billion) Analysis, 2021 to 2025
- Current and Future Market Size Value (USD Billion) Projections, 2026 to 2036
- Y-o-Y Growth Trend Analysis
- Absolute $ Opportunity Analysis
- Global Market Pricing Analysis, 2021 to 2036
- Global Market Analysis and Forecast, By Park Type, 2021 to 2036
- Introduction / Key Findings
- Historical Market Size Value (USD Billion) Analysis By Park Type, 2021 to 2025
- Current and Future Market Size Value (USD Billion) Analysis and Forecast By Park Type, 2026 to 2036
- IP-Branded Mega Amusement and Theme Parks
- Water Parks and Indoor Resort Aquaparks
- Regional Thrill Coaster and Edutainment Parks
- Y-o-Y Growth Trend Analysis By Park Type, 2021 to 2025
- Absolute $ Opportunity Analysis By Park Type, 2026 to 2036
- Global Market Analysis and Forecast, By Monetization Stream, 2021 to 2036
- Introduction / Key Findings
- Historical Market Size Value (USD Billion) Analysis By Monetization Stream, 2021 to 2025
- Current and Future Market Size Value (USD Billion) Analysis and Forecast By Monetization Stream, 2026 to 2036
- Gate Admissions and Express Queue Passes
- On-Property Resort Hotels and Vacation Packages
- In-Park Dining and Licensed Merchandise
- Y-o-Y Growth Trend Analysis By Monetization Stream, 2021 to 2025
- Absolute $ Opportunity Analysis By Monetization Stream, 2026 to 2036
- Global Market Analysis and Forecast, By Visitor Group, 2021 to 2036
- Introduction / Key Findings
- Historical Market Size Value (USD Billion) Analysis By Visitor Group, 2021 to 2025
- Current and Future Market Size Value (USD Billion) Analysis and Forecast By Visitor Group, 2026 to 2036
- Families with Children
- Young Adults and International Tour Groups
- Y-o-Y Growth Trend Analysis By Visitor Group, 2021 to 2025
- Absolute $ Opportunity Analysis By Visitor Group, 2026 to 2036
- Global Market Analysis and Forecast, By Traveler Age Cohort, 2021 to 2036
- Introduction / Key Findings
- Historical Market Size Value (USD Billion) Analysis By Traveler Age Cohort, 2021 to 2025
- Current and Future Market Size Value (USD Billion) Analysis and Forecast By Traveler Age Cohort, 2026 to 2036
- Millennials and Gen-X 28 to 54 Years
- Affluent Boomers and Seniors 55+ Years
- Gen-Z and Young Adult Explorers
- Y-o-Y Growth Trend Analysis By Traveler Age Cohort, 2021 to 2025
- Absolute $ Opportunity Analysis By Traveler Age Cohort, 2026 to 2036
- Global Market Analysis and Forecast, By Region, 2021 to 2036
- Introduction
- Historical Market Size Value (USD Billion) Analysis By Region, 2021 to 2025
- Current Market Size Value (USD Billion) Analysis and Forecast By Region, 2026 to 2036
- North America
- Latin America
- Western Europe
- Eastern Europe
- East Asia
- South Asia and Pacific
- Middle East and Africa
- Market Attractiveness Analysis By Region
- North America Market Analysis and Forecast, By Country, 2021 to 2036
- Historical Market Size Value (USD Billion) Trend Analysis By Market Taxonomy, 2021 to 2025
- Market Size Value (USD Billion) Forecast By Market Taxonomy, 2026 to 2036
- By Country
- United States
- Canada
- By Park Type
- By Monetization Stream
- By Visitor Group
- By Traveler Age Cohort
- By Country
- Market Attractiveness Analysis
- By Country
- By Park Type
- By Monetization Stream
- By Visitor Group
- By Traveler Age Cohort
- Key Takeaways
- Latin America Market Analysis and Forecast, By Country
- Historical Market Size Value (USD Billion) Trend Analysis By Market Taxonomy, 2021 to 2025
- Market Size Value (USD Billion) Forecast By Market Taxonomy, 2026 to 2036
- By Country
- Brazil
- Mexico
- Argentina
- Chile
- By Park Type
- By Monetization Stream
- By Visitor Group
- By Traveler Age Cohort
- By Country
- Market Attractiveness Analysis
- By Country
- By Park Type
- By Monetization Stream
- By Visitor Group
- By Traveler Age Cohort
- Key Takeaways
- Western Europe Market Analysis and Forecast, By Country
- Historical Market Size Value (USD Billion) Trend Analysis By Market Taxonomy, 2021 to 2025
- Market Size Value (USD Billion) Forecast By Market Taxonomy, 2026 to 2036
- By Country
- France
- United Kingdom
- Germany
- Spain
- Italy
- Benelux
- By Park Type
- By Monetization Stream
- By Visitor Group
- By Traveler Age Cohort
- By Country
- Market Attractiveness Analysis
- By Country
- By Park Type
- By Monetization Stream
- By Visitor Group
- By Traveler Age Cohort
- Key Takeaways
- Eastern Europe Market Analysis and Forecast, By Country
- Historical Market Size Value (USD Billion) Trend Analysis By Market Taxonomy, 2021 to 2025
- Market Size Value (USD Billion) Forecast By Market Taxonomy, 2026 to 2036
- By Country
- Poland
- Czech Republic
- Hungary
- By Park Type
- By Monetization Stream
- By Visitor Group
- By Traveler Age Cohort
- By Country
- Market Attractiveness Analysis
- By Country
- By Park Type
- By Monetization Stream
- By Visitor Group
- By Traveler Age Cohort
- Key Takeaways
- East Asia Market Analysis and Forecast, By Country
- Historical Market Size Value (USD Billion) Trend Analysis By Market Taxonomy, 2021 to 2025
- Market Size Value (USD Billion) Forecast By Market Taxonomy, 2026 to 2036
- By Country
- Japan
- China
- South Korea
- By Park Type
- By Monetization Stream
- By Visitor Group
- By Traveler Age Cohort
- By Country
- Market Attractiveness Analysis
- By Country
- By Park Type
- By Monetization Stream
- By Visitor Group
- By Traveler Age Cohort
- Key Takeaways
- South Asia and Pacific Market Analysis and Forecast, By Country
- Historical Market Size Value (USD Billion) Trend Analysis By Market Taxonomy, 2021 to 2025
- Market Size Value (USD Billion) Forecast By Market Taxonomy, 2026 to 2036
- By Country
- India
- ASEAN
- Australia and New Zealand
- By Park Type
- By Monetization Stream
- By Visitor Group
- By Traveler Age Cohort
- By Country
- Market Attractiveness Analysis
- By Country
- By Park Type
- By Monetization Stream
- By Visitor Group
- By Traveler Age Cohort
- Key Takeaways
- Middle East and Africa Market Analysis and Forecast, By Country
- Historical Market Size Value (USD Billion) Trend Analysis By Market Taxonomy, 2021 to 2025
- Market Size Value (USD Billion) Forecast By Market Taxonomy, 2026 to 2036
- By Country
- United Arab Emirates
- Saudi Arabia
- South Africa
- Turkiye
- By Park Type
- By Monetization Stream
- By Visitor Group
- By Traveler Age Cohort
- By Country
- Market Attractiveness Analysis
- By Country
- By Park Type
- By Monetization Stream
- By Visitor Group
- By Traveler Age Cohort
- Key Takeaways
- Key Countries Market Analysis
- United States
- Pricing Analysis
- Market Share Analysis, 2025
- By Park Type
- By Monetization Stream
- By Visitor Group
- By Traveler Age Cohort
- Canada
- Pricing Analysis
- Market Share Analysis, 2025
- By Park Type
- By Monetization Stream
- By Visitor Group
- By Traveler Age Cohort
- Mexico
- Pricing Analysis
- Market Share Analysis, 2025
- By Park Type
- By Monetization Stream
- By Visitor Group
- By Traveler Age Cohort
- Brazil
- Pricing Analysis
- Market Share Analysis, 2025
- By Park Type
- By Monetization Stream
- By Visitor Group
- By Traveler Age Cohort
- Chile
- Pricing Analysis
- Market Share Analysis, 2025
- By Park Type
- By Monetization Stream
- By Visitor Group
- By Traveler Age Cohort
- Germany
- Pricing Analysis
- Market Share Analysis, 2025
- By Park Type
- By Monetization Stream
- By Visitor Group
- By Traveler Age Cohort
- United Kingdom
- Pricing Analysis
- Market Share Analysis, 2025
- By Park Type
- By Monetization Stream
- By Visitor Group
- By Traveler Age Cohort
- Italy
- Pricing Analysis
- Market Share Analysis, 2025
- By Park Type
- By Monetization Stream
- By Visitor Group
- By Traveler Age Cohort
- Spain
- Pricing Analysis
- Market Share Analysis, 2025
- By Park Type
- By Monetization Stream
- By Visitor Group
- By Traveler Age Cohort
- France
- Pricing Analysis
- Market Share Analysis, 2025
- By Park Type
- By Monetization Stream
- By Visitor Group
- By Traveler Age Cohort
- India
- Pricing Analysis
- Market Share Analysis, 2025
- By Park Type
- By Monetization Stream
- By Visitor Group
- By Traveler Age Cohort
- ASEAN
- Pricing Analysis
- Market Share Analysis, 2025
- By Park Type
- By Monetization Stream
- By Visitor Group
- By Traveler Age Cohort
- Australia and New Zealand
- Pricing Analysis
- Market Share Analysis, 2025
- By Park Type
- By Monetization Stream
- By Visitor Group
- By Traveler Age Cohort
- China
- Pricing Analysis
- Market Share Analysis, 2025
- By Park Type
- By Monetization Stream
- By Visitor Group
- By Traveler Age Cohort
- Japan
- Pricing Analysis
- Market Share Analysis, 2025
- By Park Type
- By Monetization Stream
- By Visitor Group
- By Traveler Age Cohort
- South Korea
- Pricing Analysis
- Market Share Analysis, 2025
- By Park Type
- By Monetization Stream
- By Visitor Group
- By Traveler Age Cohort
- Poland
- Pricing Analysis
- Market Share Analysis, 2025
- By Park Type
- By Monetization Stream
- By Visitor Group
- By Traveler Age Cohort
- Hungary
- Pricing Analysis
- Market Share Analysis, 2025
- By Park Type
- By Monetization Stream
- By Visitor Group
- By Traveler Age Cohort
- South Africa
- Pricing Analysis
- Market Share Analysis, 2025
- By Park Type
- By Monetization Stream
- By Visitor Group
- By Traveler Age Cohort
- United Arab Emirates
- Pricing Analysis
- Market Share Analysis, 2025
- By Park Type
- By Monetization Stream
- By Visitor Group
- By Traveler Age Cohort
- United States
- Market Structure Analysis
- Competition Dashboard
- Competition Benchmarking
- Market Share Analysis of Top Players
- By Regional
- By Park Type
- By Monetization Stream
- By Visitor Group
- By Traveler Age Cohort
- Emerging Startups
- Innovation Benchmarking
- Competition Analysis
- Competition Deep Dive
- The Walt Disney Company Disney Experiences
- Overview
- Product Portfolio
- Profitability by Market Segments
- Sales Footprint
- Strategy Overview
- Marketing Strategy
- Product Strategy
- Channel Strategy
- Universal Destinations & Experiences Comcast
- Merlin Entertainments Limited
- Six Flags Entertainment Corporation
- Oriental Land Co. Ltd.
- United Parks & Resorts Inc.
- The Walt Disney Company Disney Experiences
- Case Studies
- Success Stories
- Recent Developments
- Competition Deep Dive
- Assumptions & Acronyms Used


