

- Market Size (2026)
- USD 1480.6 Mn
- Forecast (2036)
- USD 2753.3 Mn
- CAGR (2026 to 2036)
- 6.4%
How big is the Tire Tackifier Resins Market in 2026?
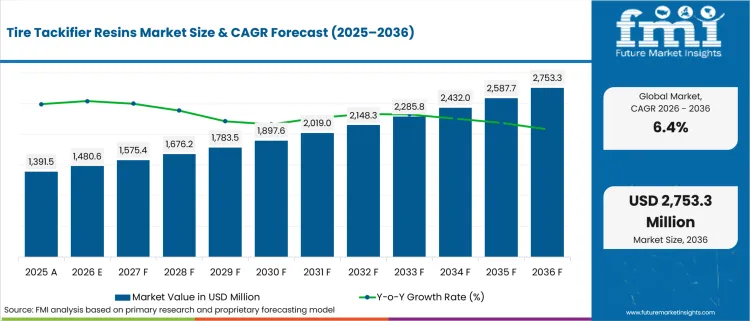
USD 1,480.6 million in 2026 and USD 2,753.3 million by 2036 at a 6.4% CAGR.
Sales of tire tackifier resins are estimated to rise at 6.4% CAGR through 2036, increasing valuation from USD 1,480.6 million in 2026 to USD 2,753.3 million by 2036. Tire producers use these resins to hold green tack during calendaring, bead assembly and tread preparation. OICA reported global vehicle production of 96,383,650 units in 2025, which keeps resin trial work tied to recurring tire output. Compound teams therefore ask resin suppliers for compatibility records across natural rubber and SBR/BR blends before wider plant use.
India and China accounts are anticipated to value local resin supply because output scale raises the number of compound trials. Japan and Germany accounts are projected to place batch consistency and material files above quick supplier switching. Tire producers compare softening point, resin identity and Mooney-viscosity behavior before an approved tackifier enters production. USTMA projected total USA tire shipments of 338.9 million units in 2026, which keeps direct technical support central to resin purchasing. The next approval discussion is expected to focus on trial data, not catalog range.
| Metric | Value |
|---|---|
| 2025 Market Size | USD 1,391.5 million |
| 2026 Market Size | USD 1,480.6 million |
| 2036 Market Size | USD 2,753.3 million |
| Forecast CAGR (2026-2036) | 6.4% |
| Sales Channel Focus | Direct to Tire OEM |
| Direct to Tire OEM Share (2026) | 59.5% |
| Tire Type Focus | Passenger Tires |
| Passenger Tires Share (2026) | 45.1% |
| Resin Type Focus | C5 Hydrocarbon Resins |
| C5 Hydrocarbon Resins Share (2026) | 38.0% |
Summary of the Tire Tackifier Resins Market
| Market Signal | Commercial Impact |
|---|---|
| Demand and Growth Drivers | Demand for tire tackifier resins is increasing as tire makers connect resin use with compound tack and repeatable manufacturing control.
|
| Product and Segment View | Segment demand is led by direct tire OEM supply and passenger tire applications requiring validated compound handling.
|
| Geography and Growth Outlook | Country demand is stronger across tire manufacturing systems with automotive output scale and compound reformulation activity.
|
| Competitive Landscape | Competition focuses on hydrocarbon resin depth and tire-compound application support.
|
| Analyst Perspective | Tire tackifier resins are developing into a performance-validation segment linked to resin compatibility and tire compound control.
|
Source: FMI's proprietary forecasting model and primary research
How is the Tire Tackifier Resins Market segmented?
The tire tackifier resins industry is segmented by resin type, application, rubber type, tire type, sales channel and region.
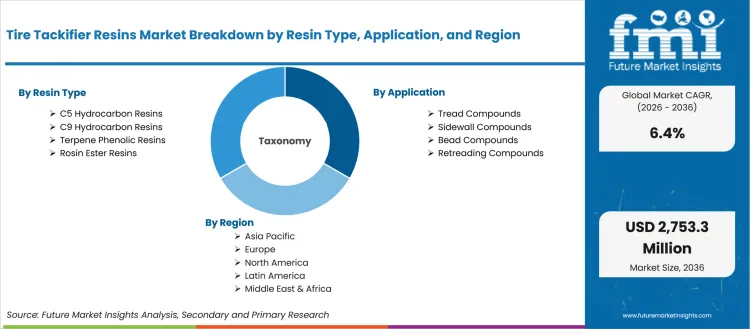
The tire tackifier resins market is segmented by resin type, application, rubber type, tire type, sales channel and region. By resin type, coverage includes C5 hydrocarbon resins, C9 hydrocarbon resins, terpene phenolic resins and rosin ester resins. By application, coverage includes tread compounds, sidewall compounds, bead compounds and retreading compounds. By rubber type, coverage includes natural rubber, SBR and BR, butyl rubber and specialty elastomers. By tire type, coverage includes passenger tires, truck and bus tires, OTR tires and two-wheeler tires. By sales channel, coverage includes direct to tire OEM, compounders and distributors, with regional coverage across North America, Latin America, Europe, East Asia, South Asia and Pacific and the Middle East and Africa.
How does direct to tire OEM influence buying within the sales channel segment?
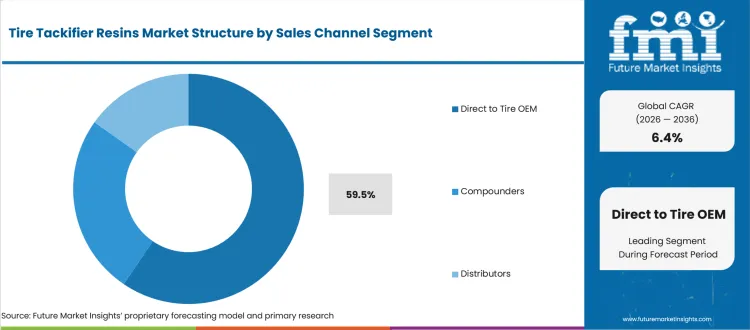
Direct to tire OEM purchasing is expected to stay close to resin approval because tire plants need accountable trial support and repeat supply. Tire makers prefer direct technical help for trial coordination and supply continuity. Tyres Europe reported consumer replacement tire sales of 58.144 million units in Q1 2026, which gives resin suppliers a measurable passenger-tire base for direct qualification programs.
- Direct to tire OEM is expected to account for 59.5% share in 2026, backed by qualification work completed before resin systems enter routine tire compound programs. Buyers prefer direct support as compound approvals require fast technical response and accountable documentation.
- Compounders and distributors remain useful for replenishment and smaller programs. Direct OEM-linked supply gains selection attention once delivery discipline and technical support are accepted by tire plant teams.
How do passenger tires create value within the tire type segment?
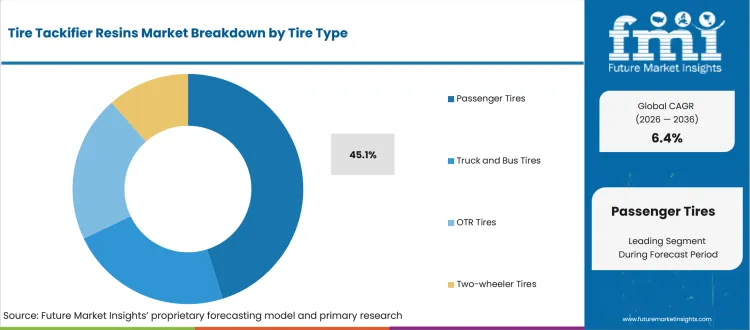
Passenger tires are expected to remain the main demand pool because tread and sidewall compounds use resin systems across repeat production cycles. Resin suppliers need to support tack retention and tire performance requirements before approval. USTMA projected replacement passenger tire shipments of 221.6 million units in 2025, which supports compound programs needing repeat resin performance across high-volume replacement tire supply.
- Passenger tires are expected to represent 45.1% share in 2026, influenced by high-volume compound programs needing resin compatibility and stable tack behavior. Suppliers gain commercial access once trials connect resin use with tread consistency and compound handling records.
- Truck and bus tires and OTR tires use more specialized resin strategies. Passenger tire operations need tighter support as tread performance and production stability affect tire program economics.
How do C5 hydrocarbon resins support resin type choices?
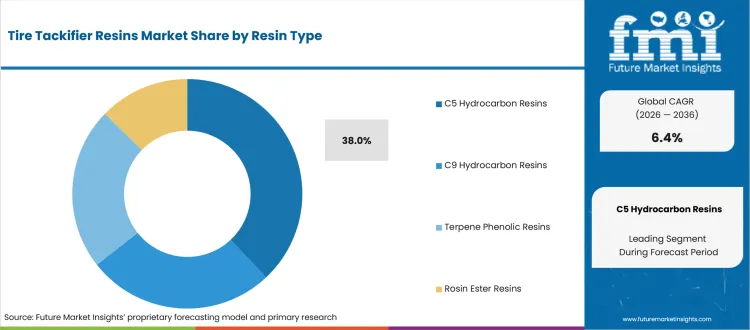
C5 hydrocarbon resins support compatibility and compound handling across tire rubber formulations. Tire compound teams use C5 resin systems in applications needing green tack without heavy formulation disruption. ANRPC reported China synthetic rubber production at 5.12 million tons from January to July 2025, up 11.1% year over year, promoting tackifier demand across rubber compounding systems.
- C5 Hydrocarbon Resins are anticipated to hold 38.0% share in 2026, led by tire programs requiring compatibility and processing control. Suppliers gain approval once resin identity and compound behavior are clear.
- C9 hydrocarbon resins, terpene phenolic resins and rosin ester resins remain useful in targeted programs. C5 options gain attention as buyers connect resin structure with green tack and production-line acceptance.
How should buyers read tread compounds within the application segment?
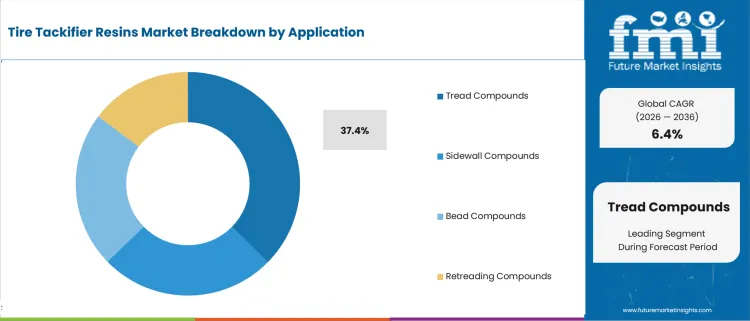
Tread compounds guide tackifier resin use as tire makers balance rolling resistance and processing control. Resin suppliers need to demonstrate how material behavior supports compound quality before formulation changes are approved. IEA reported electric car sales rose by more than 20% to 21 million units in 2025, reinforcing tire compound attention around rolling resistance and tread-performance balance.
- Tread compounds are projected to capture 37.4% share in 2026, guided by tire makers needing resin systems that support compound handling and tread performance targets. Buyers assess resin programs based on application data and service follow-up.
- Sidewall and bead compound programs remain close evaluation areas. Tread compounds gain attention once tire teams link resin compatibility with tack retention and lower avoidable compound correction.
Why does natural rubber guide rubber type decisions?
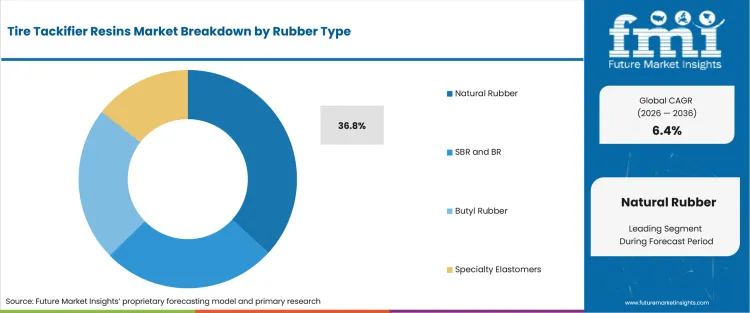
Natural rubber remains a core rubber base for tire compounds that need green strength and processing stability. Tackifier resin selection affects how resins interact with natural rubber and synthetic rubber blends during tire compound preparation. ANRPC forecast global natural rubber production at 14.9 million metric tons in 2025, keeping resin compatibility central to tire producers managing natural rubber supply and compound behavior.
- Natural rubber is projected to capture 36.8% share in 2026, guided by tire programs needing stable tack and compound handling across repeat manufacturing cycles. Buyers assess resin suppliers based on compatibility tests and batch consistency.
- Butyl rubber and specialty elastomers remain relevant in targeted tire applications. Natural rubber gains attention once compound teams compare resin interaction and approval records during production trials.
What are the drivers, restraints, and opportunities in the Tire Tackifier Resins Market?
Near-term purchases are projected to be shaped by resin validation, input-cost pressure and EV tire reformulation outlined below.
- Driver: Tire production and replacement demand are expected to raise demand for resin systems that improve compound consistency. Tire makers need tackifier programs that support tack retention and reduce avoidable compound rework across commercial tire cycles.
- Restraint: Adoption is anticipated to slow where suppliers lack resin characterization and efficacy evidence. Tire compounders require credible trial files and handling guidance before resin systems move from test batches into repeat production use.
- Opportunity: EV tire programs are projected to create room for specialty resin packages and technical service. Suppliers improve account confidence by linking tackifier chemistry with compound performance and measurable plant results.
Tire tackifier resin demand is expected to rise as compound teams treat resin systems as operating tools. Tire programs must protect processing behavior and support quality documentation before wider supplier approval. SIAM reported total vehicle production of 31,034,174 units during 2024-25, which connects tire material selection to OEM and replacement programs.
Input-cost pressure is expected to keep sourcing teams cautious during resin approval. Kraton announced a 10% to 20% global price increase across crude tall oil refinery products and derivatives in February 2026, which explains why tire compounders review resin input exposure before wider approval.
Implementation risk remains a practical constraint for tire tackifier resin programs. Compound and sourcing teams need shared success measures before wider adoption. China rubber tire casing output reached 1.17 billion units in 2024, creating room for suppliers that support high-volume tire programs through documentation and technical response.
Which country CAGRs are profiled in the Tire Tackifier Resins Market?
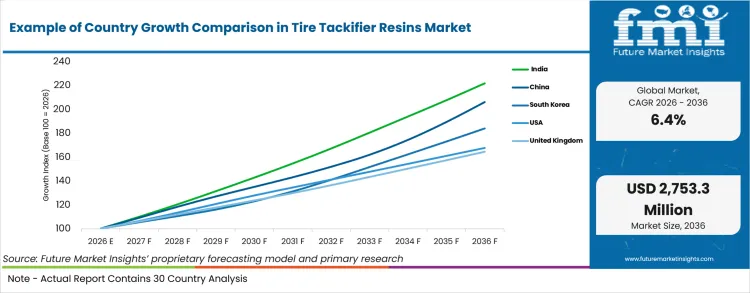
| Country | CAGR |
|---|---|
| India | 8.3% |
| China | 7.5% |
| South Korea | 6.3% |
| United States | 5.3% |
| United Kingdom | 5.1% |
| Germany | 4.9% |
| Japan | 4.8% |
Source: FMI's proprietary forecasting model and primary research
How do country-level CAGRs compare in the tire tackifier resins market?
Country demand in tire tackifier resins is expected to follow tire manufacturing intensity and compound qualification discipline. India and China are projected to link resin demand with vehicle output and tire production scale. South Korea and Japan are anticipated to connect adoption with technical validation and export-oriented tire supply. United States, United Kingdom and Germany are expected to keep demand tied to tire performance and automotive production requirements.
- India is projected to post 8.3% CAGR by 2036, driven by vehicle output expansion and tire manufacturing investment. SIAM reported total production of commercial vehicles and quadricycles at 25,371,989 units during April to December 2025, providing tackifier resin suppliers a large base for tire compound programs. Vehicle producers and tire suppliers are expected to keep resin trials focused on compound compatibility and repeat delivery discipline as output scale expands across domestic and export-oriented programs.
- China is forecast to grow at 7.5% CAGR through 2036, influenced by tire casing output and integrated automotive manufacturing. China rubber tire casing output reached 1.17 billion units in 2024, reflecting tire manufacturing scale that supports hydrocarbon resin demand across tread and sidewall compounds. Local tire producers are expected to prioritize resin systems supporting stable processing, shorter qualification cycles and dependable batch behavior across large-volume production lines.
- South Korea is expected to record 6.3% CAGR during the study period, reflected by export-linked automotive production and compact supplier relationships. Korea automobile exports reached USD 70.8 billion in 2024, providing tire and rubber material suppliers a quality-driven base connected to overseas vehicle programs. Tire compounders are expected to review tackifier suppliers through documentation quality and response speed as export exposure keeps approval discipline high.
- United States replacement channels keep resin suppliers close to tire plants and national accounts. The United States is projected to expand at 5.3% CAGR from 2026 to 2036, backed by tire replacement volume and OEM tire requirements. USTMA projected total USA tire shipments of 338.9 million units in 2026, providing tackifier resin suppliers a large base for direct technical selling and repeat supply review. Tire compound teams are expected to prefer suppliers that maintain plant-level service and consistent resin behavior across high-throughput replacement programs.
- United Kingdom is forecast to register 5.1% CAGR by 2036, shaped by automotive restructuring and resin supplier accountability. SMMT reported 764,715 cars and commercial vehicles left UK factories in 2025, keeping tire material suppliers focused on qualified customers and dependable technical support. Resin suppliers are expected to gain selection strength by supporting compounders with cleaner application data and material files suited to controlled automotive supply programs.
- Germany is anticipated to grow at 4.9% CAGR by 2036, underpinned by EV production and tire performance expectations. VDA reported German battery-electric passenger car production expanded by 15% to 1.22 million vehicles in 2025, supporting compound programs needing low rolling resistance and wear-performance support. Tire makers are expected to evaluate tackifier resins through performance balance and compatibility with materials used in EV-focused tread formulations.
- Japan is expected to post 4.8% CAGR through 2036, guided by controlled tire production and quality expectations. JATMA reported automobile tire production at 122.36 million tires in 2024, providing resin suppliers a clear base for documentation-led tackifier selection. Japanese tire accounts are expected to keep approval processes focused on resin handling and proof of compound behavior before approving wider tire plant use.
Who are the notable companies in the Tire Tackifier Resins Market?
Synthomer, ExxonMobil, Kolon Industries, Kraton, Neville Chemical, Arakawa Chemical, Yasuhara Chemical, Rain Carbon and TotalEnergies are the notable companies shaping this market.
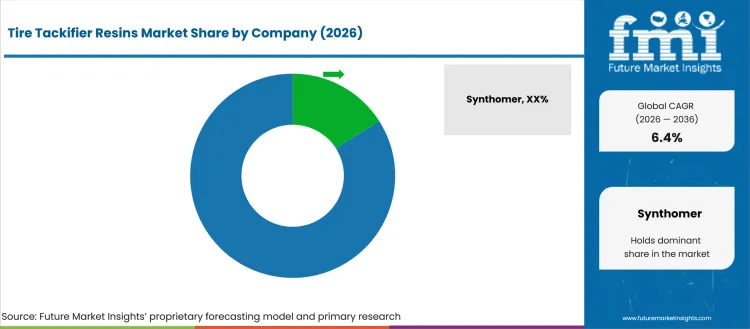
Competition in tire tackifier resins is grouped by how tire compounders test resin evidence in production. Synthomer and ExxonMobil have hydrocarbon resin portfolios that support compound and adhesive applications. Kolon Industries and Kraton support accounts through chemical and polymer material depth. Neville Chemical, Arakawa Chemical and Yasuhara Chemical strengthen competition through specialty tackifier resin chemistry. Rain Carbon and TotalEnergies support resin-adjacent and carbon-linked supply programs.
- Synthomer is expected to receive buyer attention through IMPERA tire additive coverage and hydrocarbon resin product depth. Tire compounders connect its product files with tread compound needs and tire component applications.
- Neville Chemical supports buyer review based on C5 and rubber application knowledge. Its 2026 NEVTAC T950 and NEVTAC T1000 launch provides resin users additional C5 tackifier options for rubber and adhesive use.
- Kraton and Arakawa Chemical are expected to strengthen competition through resin chemistry and specialty material supply. Tire programs use these capabilities when compound compatibility and supply continuity affect commercial approval.
- Kolon Industries, ExxonMobil, Yasuhara Chemical, Rain Carbon and TotalEnergies compete based on material reach and service coverage. Buyers compare these companies depending on resin chemistry and technical documentation.
Competitive Benchmarking: Tire Tackifier Resins Market
| Company | Material Portfolio Match | Technical Documentation | Application Support | Geographic Reach |
|---|---|---|---|---|
| Synthomer | High | High | High | Global |
| ExxonMobil | High | Medium | High | Global |
| Kolon Industries | Strong | High | Medium | Global |
| Kraton | Medium | High | Medium | Global |
| Neville Chemical | High | High | Strong | North America-led |
| Arakawa Chemical | Strong | Medium | Medium | Global |
| Yasuhara Chemical | High | Medium | Strong | Asia-led |
| Rain Carbon | Strong | High | Medium | Global |
| TotalEnergies | Medium | High | Medium | Global |
Source: Future Market Insights competitive analysis, 2026.
Key Developments in the Tire Tackifier Resins Market
- In April 2026, Neville Chemical launched NEVTAC T950 and NEVTAC T1000 as C5 hydrocarbon tackifiers. Product expansion supports buyers seeking aliphatic resin options for rubber and adhesive applications.
- In February 2026, Kraton announced a global price increase of 10% to 20% across crude tall oil refinery products and derivatives. Price action shows input pressure across bio-based chemical streams used by adhesive and tire-related material buyers.
- In September 2025, TotalEnergies Cray Valley signed an agreement to supply Continental with ISCC Plus-certified Cleartack and Ricon resins. The company stated that the mass-balance materials would support renewable content in Continental tire value chains while keeping safety and tread performance tied to specific tire formulations.
- In May 2026, Arakawa Chemical reported that Chiba Arkon Production Limited improved operation rates for hydrogenated hydrocarbon resin and increased production volume. The update links stable hydrocarbon resin supply with adhesive and tackifier demand, which gives tire resin users a clearer view of Japanese supply reliability.
Key Players in the Tire Tackifier Resins Market
Hydrocarbon Resin and Tire Additive Suppliers
- Synthomer
- ExxonMobil
- Kolon Industries
- Kraton
Specialty Tackifier Resin Suppliers
- Neville Chemical
- Arakawa Chemical
- Yasuhara Chemical
Resin-Adjacent and Carbon Material Suppliers
- Rain Carbon
- TotalEnergies
Tire Tackifier Resins Market - Report Scope
| Coverage field | Report scope |
|---|---|
| Market breakdown | Tire tackifier resins market breakdown by resin type, application, rubber type, tire type, sales channel and region |
| Market Definition | Hydrocarbon, terpene phenolic and rosin-based tackifier resin systems used in tire compounds to support tack, green strength, processing behavior and tread performance needs |
| Regions Covered | North America, Latin America, Europe, East Asia, South Asia and Pacific, Middle East and Africa |
| Countries Covered | United States, China, India, Germany, United Kingdom, Japan, South Korea and 30+ countries |
| Key Companies Profiled | Synthomer, ExxonMobil, Kolon Industries, Kraton, Neville Chemical, Arakawa Chemical, Yasuhara Chemical, Rain Carbon, TotalEnergies |
| Forecast Period | 2026 to 2036 |
| Approach | Hybrid bottom-up and top-down methodology using tire output indicators, resin adoption, compound application intensity, sales-channel structure, supplier portfolios and country-level automotive demand signals |
Source: Future Market Insights - analysis driven by proprietary forecasting models and primary research
Tire Tackifier Resins Market - Research Methodology
| Method | Approach |
|---|---|
| Primary Research | FMI analysts reviewed inputs from tire compounders, OEM tire buyers, rubber processors, resin suppliers, distributors and technical service teams. Discussions focused on compound approval, tack behavior, supplier selection, sourcing barriers and measurable operating value. |
| Desk Research | Desk research covered official automotive production sources, tire industry bodies, company technical sheets, product information, chemical supplier releases and public tire production datasets. Product coverage was checked against resin type, application, rubber type, tire type, sales-channel route and commercial use. |
| Market Sizing and Forecasting | Model inputs combined 2026 baseline value, tire production signals, resin inclusion intensity, application demand, channel structure and country CAGR assumptions. Forecast assumptions were adjusted for passenger tire volume, EV tire compound needs and supplier qualification requirements. |
| Data Validation | Forecasts were checked against tire shipment indicators, automotive output signals, company portfolio activity and supplier qualification patterns. Company portfolios were reviewed to avoid counting adjacent materials without direct tire tackifier resin use. |
Source: Future Market Insights (FMI) analysis, based on proprietary forecasting model and primary research
Tire Tackifier Resins Market by Segments
Tire Tackifier Resins Market segmented by Resin Type:
- C5 hydrocarbon resins
- C9 hydrocarbon resins
- Terpene phenolic resins
- Rosin ester resins
Tire Tackifier Resins Market segmented by Application:
- Tread compounds
- Sidewall compounds
- Bead compounds
- Retreading compounds
Tire Tackifier Resins Market segmented by Rubber Type:
- Natural rubber
- SBR and BR
- Butyl rubber
- Specialty elastomers
Tire Tackifier Resins Market segmented by Tire Type:
- Passenger tires
- Truck and bus tires
- OTR tires
- Two-wheeler tires
Tire Tackifier Resins Market segmented by Sales Channel:
- Direct to tire OEM
- Compounders
- Distributors
Tire Tackifier Resins Market by Region:
- North America
- United States
- Canada
- Mexico
- Latin America
- Brazil
- Chile
- Rest of Latin America
- Western Europe
- Germany
- United Kingdom
- Italy
- Spain
- France
- Nordic
- BENELUX
- Rest of Western Europe
- Eastern Europe
- Poland
- Hungary
- Balkan and Baltic
- Rest of Eastern Europe
- East Asia
- China
- Japan
- South Korea
- South Asia and Pacific
- India
- ASEAN
- Australia and New Zealand
- Rest of South Asia and Pacific
- Middle East and Africa
- Kingdom of Saudi Arabia
- Other GCC Countries
- Turkiye
- South Africa
- Other African Union
- Rest of Middle East and Africa
Research Sources and Bibliography
- Association of Natural Rubber Producing Countries. (2025, August 20). SunSirs: China’s tire casing and synthetic rubber production growth in July 2025. Association of Natural Rubber Producing Countries.
- Association of Natural Rubber Producing Countries. (2025, March 5). Global rubber production faces continued challenges in 2025. Association of Natural Rubber Producing Countries.
- International Energy Agency. (2026). Global Energy Review 2026: Electric vehicles. International Energy Agency.
- International Organization of Motor Vehicle Manufacturers. (2026). Production statistics. International Organization of Motor Vehicle Manufacturers.
- Japan Automobile Tyre Manufacturers Association. (2025). Trends in production and sales: Tyre industry of Japan. Japan Automobile Tyre Manufacturers Association.
- Kraton Corporation. (2026, February 24). Kraton Corporation announces global price increase for CTO refinery products and derivatives. Kraton Corporation.
- Ministry of Trade, Industry and Energy, Republic of Korea. (2025, January 16). Automobile exports hit record high in 2024. Ministry of Trade, Industry and Energy, Republic of Korea.
- Neville Chemical. (2026, April 29). Novel C5 resins: NEVTAC T950 and NEVTAC T1000. Neville Chemical.
- Society of Indian Automobile Manufacturers. (2025, April 15). Auto industry performance of March 2025 and FY 2024-25. Society of Indian Automobile Manufacturers.
- Society of Indian Automobile Manufacturers. (2026). Auto industry performance of December 2025 and Q3 October-December 2025. Society of Indian Automobile Manufacturers.
- Society of Motor Manufacturers and Traders. (2026, January 29). Tough year for auto as new models and Industrial Strategy support growth. Society of Motor Manufacturers and Traders.
- Cray Valley. (2025, September 9). More sustainable tires: TotalEnergies' Cray Valley affiliate supplies resins Cleartack and Ricon derived from used cooking oil for synthetic rubber production. Cray Valley.
- Synthomer. (2026). Tyre additives. Synthomer.
- Tyres Europe. (2026, May 7). Quarterly replacement tyre market review Q1 2026. Tyres Europe.
- USA Tire Manufacturers Association. (2026, March 4). USTMA February 2026 Forecast Predicts Slightly Higher 2026 Tire Shipments for USA Tire Market. USA Tire Manufacturers Association.
- Verband der Automobilindustrie. (2026, February 3). Production and market in January 2026. Verband der Automobilindustrie.
This bibliography is provided for reader reference and uses primary government, standards-body, official trade body, and company sources.
This Report Answers
- What is the expected global value of the tire tackifier resins market in 2026 and 2036?
- What CAGR is forecast for the tire tackifier resins market during the 2026 to 2036 period?
- Which resin type segment is used to assess C5 hydrocarbon resin demand in 2026?
- Why do tire OEMs buy controlled tackifier resin systems?
- How do tread compounds and natural rubber shape tire resin choices?
- Which countries are compared in the tire tackifier resins forecast?
- Which companies compete across hydrocarbon resin and tire additive pathways?
- What resin systems and applications are included within the tire tackifier resins definition?
- How does FMI size and forecast tire tackifier resin demand across segments and countries?
- What implementation and supplier-selection factors should executives assess?
Frequently Asked Questions
What is driving growth in the tire tackifier resins market?
Demand is driven by tire producers seeking green strength and compound consistency across repeated production cycles. Passenger tire programs strengthen demand led by tread performance needs and resin compatibility evidence.
Why should executives track the tire tackifier resins market?
Executives are expected to track this segment since resin approval affects supplier accountability and tire production continuity. Supplier selection influences plant qualification and repeat production confidence.
What business problem does the tire tackifier resins market address?
Tire tackifier resins help compounders and tire manufacturers reduce uncertainty around rubber compatibility and compound approval. Resin systems also support buyers needing clearer links between formulation decisions and operating control.
What should sourcing leaders evaluate before selecting suppliers?
Sourcing leaders are likely to compare product documentation and compound trial evidence before supplier approval. Application support and resin compatibility records should guide supplier review.
What limits return on investment for buyers?
Return on investment is expected to be delayed if trial evidence is weak or resin handling requires plant changes. Buyers reduce such risk by setting acceptance criteria before wider line use.
How do suppliers build executive confidence?
Suppliers build confidence based on verified product data and accountable support during tire compound approval. Clear technical files and consistent batch documentation strengthen buyer approval.
Which companies lead tire tackifier resins market?
Competition is based on Synthomer and ExxonMobil, led by hydrocarbon resin portfolios and tire application support. Neville Chemical, Kraton and Kolon Industries gain position depending on specialty tackifier chemistry and regional service continuity.
What demand driver supports tire tackifier resins market?
Tire producers seek resins improving compound stability amid changing rubber blends and tire performance targets. Passenger tire programs strengthen demand based on tread compound evidence and manufacturing control.
Preview the report firsthand - request a free sample
Get SampleGet the brochure for pricing and purchase details.
Get PDFTable of Content
- Key Takeaways
- Market Size and CAGR
- Top Growth Driver
- Fastest Growing Segment
- Leading Region
- Key Companies
- Emerging Opportunities
- Executive Summary
- Global Market Outlook
- Demand-side Trends
- Supply-side Trends
- Technology Roadmap Analysis
- Analysis and Recommendations
- Analyst Perspective (What is happening? Why now? What should investors know?)
- Key Questions Answered
- How large is the market?
- What is the CAGR?
- What are key trends?
- Which region dominates?
- Who are the leaders?
- Market Overview
- Market Coverage / Taxonomy
- Market Definition / Scope / Limitations
- Research Methodology
- Chapter Orientation
- Analytical Lens and Working Hypotheses
- Market Structure, Signals, and Trend Drivers
- Benchmarking and Cross-market Comparability
- Market Sizing, Forecasting, and Opportunity Mapping
- Research Design and Evidence Framework
- Desk Research Programme (Secondary Evidence)
- Expert Input and Fieldwork (Primary Evidence)
- Tooling, Models, and Reference Databases
- Data Engineering and Model Build
- Quality Assurance and Audit Trail
- Market Background
- Market Dynamics (Drivers, Restraints, Opportunity, Trends)
- Scenario Forecast (Optimistic, Likely, Conservative)
- Impact Analysis
- AI Impact
- Sustainability Impact
- Regulatory Impact
- Technology Impact
- Consumer / Buyer Analysis
- Purchase Drivers
- Adoption Barriers
- Buyer Journey
- Opportunity Map Analysis
- Product Life Cycle Analysis
- Supply Chain Analysis
- Investment Feasibility Matrix
- Value Chain Analysis
- PESTLE and Porter's Analysis
- Regulatory Landscape
- Regional Parent Market Outlook
- Production and Consumption Statistics
- Import and Export Statistics
- Global Market Analysis and Forecast, 2021 to 2036
- Historical Market Size Value (USD Million) Analysis, 2021 to 2025
- Current and Future Market Size Value (USD Million) Projections, 2026 to 2036
- Y-o-Y Growth Trend Analysis
- Absolute $ Opportunity Analysis
- Global Market Pricing Analysis, 2021 to 2036
- Global Market Analysis and Forecast, By Resin Type, 2021 to 2036
- Introduction / Key Findings
- Historical Market Size Value (USD Million) Analysis By Resin Type, 2021 to 2025
- Current and Future Market Size Value (USD Million) Analysis and Forecast By Resin Type, 2026 to 2036
- C5 Hydrocarbon Resins
- C9 Hydrocarbon Resins
- Terpene Phenolic Resins
- Rosin Ester Resins
- C5 Hydrocarbon Resins
- Y-o-Y Growth Trend Analysis By Resin Type, 2021 to 2025
- Absolute $ Opportunity Analysis By Resin Type, 2026 to 2036
- Global Market Analysis and Forecast, By Application, 2021 to 2036
- Introduction / Key Findings
- Historical Market Size Value (USD Million) Analysis By Application, 2021 to 2025
- Current and Future Market Size Value (USD Million) Analysis and Forecast By Application, 2026 to 2036
- Tread Compounds
- Sidewall Compounds
- Bead Compounds
- Retreading Compounds
- Tread Compounds
- Y-o-Y Growth Trend Analysis By Application, 2021 to 2025
- Absolute $ Opportunity Analysis By Application, 2026 to 2036
- Global Market Analysis and Forecast, By Rubber Type, 2021 to 2036
- Introduction / Key Findings
- Historical Market Size Value (USD Million) Analysis By Rubber Type, 2021 to 2025
- Current and Future Market Size Value (USD Million) Analysis and Forecast By Rubber Type, 2026 to 2036
- Natural Rubber
- SBR and BR
- Butyl Rubber
- Specialty Elastomers
- Natural Rubber
- Y-o-Y Growth Trend Analysis By Rubber Type, 2021 to 2025
- Absolute $ Opportunity Analysis By Rubber Type, 2026 to 2036
- Global Market Analysis and Forecast, By Tire Type, 2021 to 2036
- Introduction / Key Findings
- Historical Market Size Value (USD Million) Analysis By Tire Type, 2021 to 2025
- Current and Future Market Size Value (USD Million) Analysis and Forecast By Tire Type, 2026 to 2036
- Passenger Tires
- Truck and Bus Tires
- OTR Tires
- Two-wheeler Tires
- Passenger Tires
- Y-o-Y Growth Trend Analysis By Tire Type, 2021 to 2025
- Absolute $ Opportunity Analysis By Tire Type, 2026 to 2036
- Global Market Analysis and Forecast, By Sales Channel, 2021 to 2036
- Introduction / Key Findings
- Historical Market Size Value (USD Million) Analysis By Sales Channel, 2021 to 2025
- Current and Future Market Size Value (USD Million) Analysis and Forecast By Sales Channel, 2026 to 2036
- Direct to Tire OEM
- Compounders
- Distributors
- Direct to Tire OEM
- Y-o-Y Growth Trend Analysis By Sales Channel, 2021 to 2025
- Absolute $ Opportunity Analysis By Sales Channel, 2026 to 2036
- Global Market Analysis and Forecast, By Region, 2021 to 2036
- Introduction
- Historical Market Size Value (USD Million) Analysis By Region, 2021 to 2025
- Current Market Size Value (USD Million) Analysis and Forecast By Region, 2026 to 2036
- North America
- Latin America
- Western Europe
- Eastern Europe
- East Asia
- South Asia and Pacific
- Middle East & Africa
- Market Attractiveness Analysis By Region
- North America Market Analysis and Forecast, By Country, 2021 to 2036
- Historical Market Size Value (USD Million) Trend Analysis By Market Taxonomy, 2021 to 2025
- Market Size Value (USD Million) Forecast By Market Taxonomy, 2026 to 2036
- By Country
- USA
- Canada
- By Resin Type
- By Application
- By Rubber Type
- By Tire Type
- By Sales Channel
- By Country
- Market Attractiveness Analysis
- By Country
- By Resin Type
- By Application
- By Rubber Type
- By Tire Type
- By Sales Channel
- Key Takeaways
- Latin America Market Analysis and Forecast, By Country
- Historical Market Size Value (USD Million) Trend Analysis By Market Taxonomy, 2021 to 2025
- Market Size Value (USD Million) Forecast By Market Taxonomy, 2026 to 2036
- By Country
- Brazil
- Mexico
- Chile
- Rest of Latin America
- By Resin Type
- By Application
- By Rubber Type
- By Tire Type
- By Sales Channel
- By Country
- Market Attractiveness Analysis
- By Country
- By Resin Type
- By Application
- By Rubber Type
- By Tire Type
- By Sales Channel
- Key Takeaways
- Western Europe Market Analysis and Forecast, By Country
- Historical Market Size Value (USD Million) Trend Analysis By Market Taxonomy, 2021 to 2025
- Market Size Value (USD Million) Forecast By Market Taxonomy, 2026 to 2036
- By Country
- Germany
- UK
- Italy
- Spain
- France
- Nordic
- BENELUX
- Rest of Western Europe
- By Resin Type
- By Application
- By Rubber Type
- By Tire Type
- By Sales Channel
- By Country
- Market Attractiveness Analysis
- By Country
- By Resin Type
- By Application
- By Rubber Type
- By Tire Type
- By Sales Channel
- Key Takeaways
- Eastern Europe Market Analysis and Forecast, By Country
- Historical Market Size Value (USD Million) Trend Analysis By Market Taxonomy, 2021 to 2025
- Market Size Value (USD Million) Forecast By Market Taxonomy, 2026 to 2036
- By Country
- Russia
- Poland
- Hungary
- Balkan & Baltic
- Rest of Eastern Europe
- By Resin Type
- By Application
- By Rubber Type
- By Tire Type
- By Sales Channel
- By Country
- Market Attractiveness Analysis
- By Country
- By Resin Type
- By Application
- By Rubber Type
- By Tire Type
- By Sales Channel
- Key Takeaways
- East Asia Market Analysis and Forecast, By Country
- Historical Market Size Value (USD Million) Trend Analysis By Market Taxonomy, 2021 to 2025
- Market Size Value (USD Million) Forecast By Market Taxonomy, 2026 to 2036
- By Country
- China
- Japan
- South Korea
- By Resin Type
- By Application
- By Rubber Type
- By Tire Type
- By Sales Channel
- By Country
- Market Attractiveness Analysis
- By Country
- By Resin Type
- By Application
- By Rubber Type
- By Tire Type
- By Sales Channel
- Key Takeaways
- South Asia and Pacific Market Analysis and Forecast, By Country
- Historical Market Size Value (USD Million) Trend Analysis By Market Taxonomy, 2021 to 2025
- Market Size Value (USD Million) Forecast By Market Taxonomy, 2026 to 2036
- By Country
- India
- ASEAN
- Australia & New Zealand
- Rest of South Asia and Pacific
- By Resin Type
- By Application
- By Rubber Type
- By Tire Type
- By Sales Channel
- By Country
- Market Attractiveness Analysis
- By Country
- By Resin Type
- By Application
- By Rubber Type
- By Tire Type
- By Sales Channel
- Key Takeaways
- Middle East & Africa Market Analysis and Forecast, By Country
- Historical Market Size Value (USD Million) Trend Analysis By Market Taxonomy, 2021 to 2025
- Market Size Value (USD Million) Forecast By Market Taxonomy, 2026 to 2036
- By Country
- Kingdom of Saudi Arabia
- Other GCC Countries
- Türkiye
- South Africa
- Other African Union
- Rest of Middle East & Africa
- By Resin Type
- By Application
- By Rubber Type
- By Tire Type
- By Sales Channel
- By Country
- Market Attractiveness Analysis
- By Country
- By Resin Type
- By Application
- By Rubber Type
- By Tire Type
- By Sales Channel
- Key Takeaways
- Key Countries Market Analysis
- USA
- Pricing Analysis
- Market Share Analysis, 2025
- By Resin Type
- By Application
- By Rubber Type
- By Tire Type
- By Sales Channel
- Canada
- Pricing Analysis
- Market Share Analysis, 2025
- By Resin Type
- By Application
- By Rubber Type
- By Tire Type
- By Sales Channel
- Mexico
- Pricing Analysis
- Market Share Analysis, 2025
- By Resin Type
- By Application
- By Rubber Type
- By Tire Type
- By Sales Channel
- Brazil
- Pricing Analysis
- Market Share Analysis, 2025
- By Resin Type
- By Application
- By Rubber Type
- By Tire Type
- By Sales Channel
- Chile
- Pricing Analysis
- Market Share Analysis, 2025
- By Resin Type
- By Application
- By Rubber Type
- By Tire Type
- By Sales Channel
- Germany
- Pricing Analysis
- Market Share Analysis, 2025
- By Resin Type
- By Application
- By Rubber Type
- By Tire Type
- By Sales Channel
- UK
- Pricing Analysis
- Market Share Analysis, 2025
- By Resin Type
- By Application
- By Rubber Type
- By Tire Type
- By Sales Channel
- Italy
- Pricing Analysis
- Market Share Analysis, 2025
- By Resin Type
- By Application
- By Rubber Type
- By Tire Type
- By Sales Channel
- Spain
- Pricing Analysis
- Market Share Analysis, 2025
- By Resin Type
- By Application
- By Rubber Type
- By Tire Type
- By Sales Channel
- France
- Pricing Analysis
- Market Share Analysis, 2025
- By Resin Type
- By Application
- By Rubber Type
- By Tire Type
- By Sales Channel
- India
- Pricing Analysis
- Market Share Analysis, 2025
- By Resin Type
- By Application
- By Rubber Type
- By Tire Type
- By Sales Channel
- ASEAN
- Pricing Analysis
- Market Share Analysis, 2025
- By Resin Type
- By Application
- By Rubber Type
- By Tire Type
- By Sales Channel
- Australia & New Zealand
- Pricing Analysis
- Market Share Analysis, 2025
- By Resin Type
- By Application
- By Rubber Type
- By Tire Type
- By Sales Channel
- China
- Pricing Analysis
- Market Share Analysis, 2025
- By Resin Type
- By Application
- By Rubber Type
- By Tire Type
- By Sales Channel
- Japan
- Pricing Analysis
- Market Share Analysis, 2025
- By Resin Type
- By Application
- By Rubber Type
- By Tire Type
- By Sales Channel
- South Korea
- Pricing Analysis
- Market Share Analysis, 2025
- By Resin Type
- By Application
- By Rubber Type
- By Tire Type
- By Sales Channel
- Russia
- Pricing Analysis
- Market Share Analysis, 2025
- By Resin Type
- By Application
- By Rubber Type
- By Tire Type
- By Sales Channel
- Poland
- Pricing Analysis
- Market Share Analysis, 2025
- By Resin Type
- By Application
- By Rubber Type
- By Tire Type
- By Sales Channel
- Hungary
- Pricing Analysis
- Market Share Analysis, 2025
- By Resin Type
- By Application
- By Rubber Type
- By Tire Type
- By Sales Channel
- Kingdom of Saudi Arabia
- Pricing Analysis
- Market Share Analysis, 2025
- By Resin Type
- By Application
- By Rubber Type
- By Tire Type
- By Sales Channel
- Türkiye
- Pricing Analysis
- Market Share Analysis, 2025
- By Resin Type
- By Application
- By Rubber Type
- By Tire Type
- By Sales Channel
- South Africa
- Pricing Analysis
- Market Share Analysis, 2025
- By Resin Type
- By Application
- By Rubber Type
- By Tire Type
- By Sales Channel
- USA
- Market Structure Analysis
- Competition Dashboard
- Competition Benchmarking
- Market Share Analysis of Top Players
- By Regional
- By Resin Type
- By Application
- By Rubber Type
- By Tire Type
- By Sales Channel
- Emerging Startups
- Innovation Benchmarking
- Competition Analysis
- Competition Deep Dive
- Synthomer
- Overview
- Product Portfolio
- Profitability by Market Segments
- Sales Footprint
- Strategy Overview
- Marketing Strategy
- Product Strategy
- Channel Strategy
- ExxonMobil
- Kolon Industries
- Kraton
- Neville Chemical
- Arakawa Chemical
- Yasuhara Chemical
- Synthomer
- Case Studies
- Success Stories
- Recent Developments
- Competition Deep Dive
- Assumptions & Acronyms Used


