

- Market Size (2026)
- USD 131.3 Mn
- Forecast (2036)
- USD 258.3 Mn
- CAGR (2026 to 2036)
- 7.0%
How Big is the Toffee & Honeycomb Pieces Market in 2026?
The toffee & honeycomb pieces market is estimated at USD 131.3 million in 2026.
The global toffee and honeycomb pieces market was valued at USD 122.7 million in 2025 and is estimated to reach USD 131.3 million in 2026. The market is projected to reach USD 258.3 million by 2036, expanding at a compound annual growth rate (CAGR) of 7.0% between 2026 and 2036. Standard grade accounted for the largest share of the market, contributing 45.0% of total revenue in 2026. Demand is supported by bakeries that use toffee and honeycomb pieces to add caramel flavour and crunch to cookies, cakes and breads. Sugar is the main raw material, and supply is tightening. According to UkrAgroConsult, the International Sugar Organization (ISO) cut its forecast for the 2025/26 global sugar surplus to 1.1 million tonnes in 2026, half the level projected in May, and expects a deficit of 0.2 million tonnes in 2026/27[5]. The Food and Agriculture Organization of the United Nations (FAO) Sugar Price Index stood 14.7% above its year-earlier level in September 2026[6]. Coated formats help manage moisture. For instance, Barry Callebaut offers cocoa-butter-coated honeycomb granules[3].
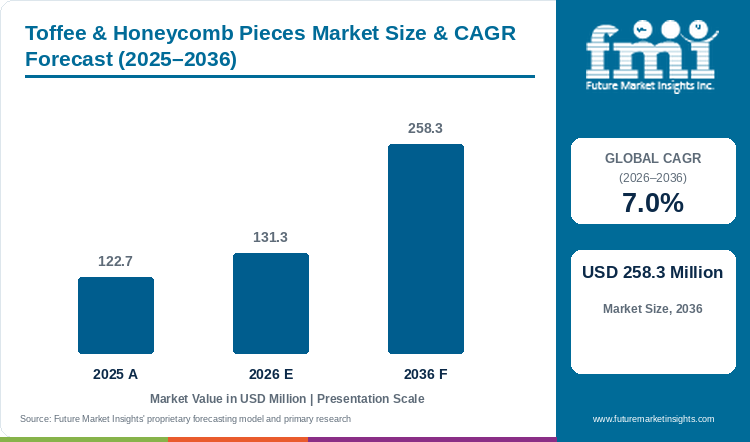
Table 1: Toffee & Honeycomb Pieces Market Size and Forecast (USD million), 2025 to 2036
| Market size and forecast | Value |
|---|---|
| 2025 market size | USD 122.7 million |
| Estimated market size in 2026 | USD 131.3 million |
| Projected market size by 2036 | USD 258.3 million |
| CAGR (2026-2036) | 7.0% |
| Added revenue, 2026 to 2036 | USD 127.0 million |
Key Market Trends & Insights
- By Product Type: The Standard grade segment accounted for the largest share of the toffee and honeycomb pieces market in 2026, representing 45.0% of total market revenue.
- By Form: Powder / dry products held the leading market position with a share of 48.0% in 2026, making dry handling and exposure control key production requirements.
- By Application: Bread & rolls remained the largest application segment, accounting for 28.0% of the market in 2026.
Regional Highlights
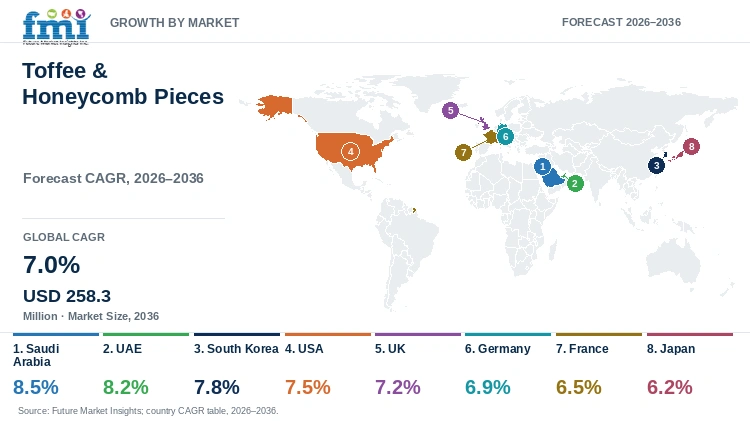
- Fastest-growing country: Saudi Arabia is expected to record the highest growth rate among the eight profiled countries, with a projected CAGR of 8.5% between 2026 and 2036.
- Growth across other countries: The UAE is projected to expand at a CAGR of 8.2%, followed by South Korea at 7.8% and the USA at 7.5%. Japan is expected to register comparatively slower growth, with a CAGR of 6.2% during the forecast period.
Sugar costs remain the most important factor influencing toffee and honeycomb prices. Raw sugar prices rallied in August 2026, with the ISA daily price averaging 17.4 cents per pound, and the ISO identified El Niño as the main risk to its forecast[5]. In the United States, prices for sugar and sweets are forecast to rise by 6.6% in 2026[7]. Dairy costs, relevant to butter toffee, moved the other way, with the FAO Dairy Price Index 19.1% lower than a year earlier, although butter prices were little changed in September 2026[6]. Product performance also matters. A 2025 review by Nugrahedi and colleagues examines moisture migration between components of bakery products[2], which is a key constraint when dry honeycomb contacts a moister cake or filling.
Coatings provide one route for managing that contact. Barry Callebaut's cocoa-butter-coated honeycomb granules are a documented example of a protective layer around an aerated caramel inclusion[3]. Confectionery coatings affect contact between the piece and its surrounding recipe, while particle size influences distribution and breakage. Cocoa-based coatings have become more expensive, as Barry Callebaut reported that its revenue rose by 49.0% in its 2024/25 financial year on higher cocoa-related pricing[8]. Bakeries may therefore weigh the cost of a cocoa butter coating against the shelf-life benefit it provides.
Suppliers offer a range of formats. Meadow's 2026 brochure includes coated and uncoated honeycomb and toffee, giving manufacturers several ways to deliver caramel flavour and texture[4]. Range breadth increases the importance of identifying which recipe and processing conditions each format can accommodate. Composition records accompany that selection, as the US Food and Drug Administration's (FDA) January 2025 food allergen labelling guidance is relevant when coating ingredients change the finished product's allergen information[1]. Approved dimensions, ingredient details and change notification help keep recurring purchases aligned with production requirements.
Table 2: Supporting Industry Indicators for the Toffee & Honeycomb Pieces Market, 2025 to 2026
| Indicator | Data point | Why it matters | Source |
|---|---|---|---|
| Sugar balance | The ISO cut its 2025/26 global sugar surplus forecast to 1.1 million tonnes and expects a 0.2 million tonne deficit in 2026/27. | Tighter sugar supply raises toffee and honeycomb costs. | [5] |
| Raw sugar price | The ISA daily raw sugar price averaged 17.4 cents per pound in August 2026. | Sugar is the main ingredient in caramel inclusions. | [5] |
| FAO sugar prices | The FAO Sugar Price Index stood 14.7% above its year-earlier level in September 2026. | International prices confirm the upward trend in sugar costs. | [6] |
| US retail prices | US prices for sugar and sweets are forecast to rise by 6.6% in 2026. | Higher retail prices reflect rising sugar costs. | [7] |
| Dairy prices | The FAO Dairy Price Index stood 19.1% below its year-earlier level, with butter little changed. | Butter is used in toffee recipes. | [6] |
| Cocoa coating costs | Barry Callebaut's revenue rose by 49.0% in 2024/25 on higher cocoa-related pricing. | Cocoa butter coatings have become more expensive. | [8] |
| Moisture migration | An October 2025 review examined moisture migration and prevention in multi-domain bakery products. | Contact with moister components affects retained crunch. | [2] |
| Coated inclusion | Barry Callebaut lists cocoa-butter-coated honeycomb granules. | Coating becomes part of the application specification. | [3] |
| Supplier range | Meadow's 2026 brochure includes coated and uncoated honeycomb and toffee. | Manufacturers can select formats for processing conditions. | [4] |
| Allergen labelling | FDA issued Edition 5 of its food allergen labelling guidance in January 2025. | Coating changes can alter ingredient information. | [1] |
Demand Intensity Analysis
A comparison of FMI's market estimate with the sugar market provides a measure of the scale of toffee and honeycomb use. At the August 2026 average raw sugar price of 17.4 cents per pound, or approximately USD 384.0 per tonne[5], FMI's 2025 market value of USD 122.7 million corresponds to the cost of approximately 320,000 tonnes of raw sugar. This is equivalent to less than 0.2% of global sugar consumption of approximately 179.6 million tonnes[5], which shows that bakery caramel inclusions are a small and specialised outlet for sugar.
The sugar balance provides another reference point. The ISO's 2025/26 surplus of 1.1 million tonnes represents only about 0.6% of global consumption[5], and the expected 2026/27 deficit suggests that sugar costs may continue to rise. Since sugar accounts for most of the weight of toffee and honeycomb, higher prices are likely to be passed on to bakery buyers.
A similar comparison can be made between projected market growth and input costs. FMI expects the market to grow at a CAGR of 7.0% between 2026 and 2036, while the FAO Sugar Price Index rose by 14.7% in the year to September 2026[6] and US sugar and sweets prices are forecast to rise by 6.6% in 2026[7]. Part of the market's near-term value growth may therefore reflect higher prices rather than higher volumes.
Segment values show where demand is concentrated. Standard grade represented USD 59.1 million of the 2026 market, while Powder / dry accounted for USD 63.0 million in the separate Form dimension. Bread & rolls accounted for USD 36.8 million, and Direct to industrial bakeries represented USD 67.0 million across the Sales Channel dimension. FMI projects USD 127.0 million in added market revenue between 2026 and 2036, with the market reaching 2.0 times its 2026 value.
Table 3: Demand Intensity Metrics for the Toffee & Honeycomb Pieces Market, 2025/26 Sugar Data Against 2025 and 2026 Market Values
| Demand intensity metric | Value | Basis |
|---|---|---|
| FMI market value, 2025 | USD 122.7 million | FMI estimate of toffee and honeycomb piece revenue. |
| Raw sugar price, August 2026 | Approximately USD 384.0 per tonne | 17.4 cents per pound multiplied by 2,204.6 pounds per tonne. |
| Raw sugar equivalent of FMI 2025 value | Approximately 320,000 tonnes | USD 122.7 million divided by USD 384.0 per tonne. |
| Global sugar consumption, 2025/26 | Approximately 179.6 million tonnes | ISO. |
| Equivalent share of global consumption | Less than 0.2% | 320,000 tonnes divided by 179.6 million tonnes. |
| ISO sugar surplus as a share of consumption | Approximately 0.6% | 1.1 million tonnes divided by 179.6 million tonnes. |
| FAO Sugar Price Index, year-on-year change | +14.7% | September 2026. |
| FMI value CAGR, 2026 to 2036 | 7.0% | FMI market forecast. |
| Standard grade revenue, 2026 | USD 59.1 million | 45.0% of the market. |
| Direct industrial bakery revenue, 2026 | USD 67.0 million | 51.0% of the market. |
| Market expansion multiple | 2.0 times | Projected 2036 market value relative to 2026. |
Analyst Perspective
"Sugar is getting more expensive, so a honeycomb piece that loses its crunch before the cake is sold is wasted money; the coated, size-controlled grades will win the repeat orders."
- Nandini Roy Choudhury, Principal Analyst at Future Market Insights
How is the toffee & honeycomb pieces market segmented?
The toffee and honeycomb pieces market is segmented by product type, form, application, claim and sales channel. Product Type separates standard specifications from specialty choices, Form describes the delivered ingredient, and Application identifies the bread, cake, cookie or pastry around it. Claim requirements can restrict the recipe or coating, while Sales Channel reflects whether a customer needs small trial quantities, reliable replenishment or direct technical help.
Why does Standard grade lead Product Type in industrial bakery purchasing?
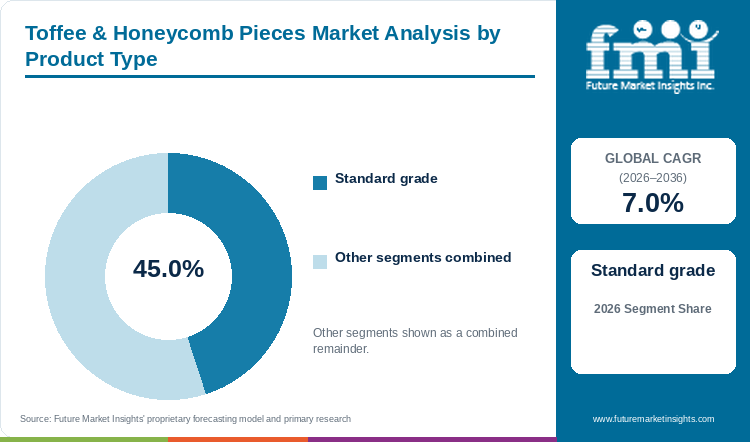
Standard grade holds 45.0% of Product Type in 2026.
Industrial bakery recipes need a repeatable caramel strength and particle distribution, which Standard grade provides, generating approximately USD 59.1 million in 2026. A common specification can serve several products with similar flavour and handling needs, which limits the number of materials in stock. Hard toffee and aerated honeycomb still require different texture assessments, even at comparable dimensions. With sugar costs rising[5][6], purchasing value depends on the usable quantity delivered through production, so fewer broken fragments improve the case for retaining an approved grade.
- Standard grade holds 45.0% of Product Type in 2026.
- The size specification should describe the piece after handling and baking, as well as when it leaves the pack.
What makes Powder / dry the primary Form for production lines?
Powder / dry accounts for 48.0% of Form in 2026.
Dry formats accounted for approximately USD 63.0 million in 2026, as they fit established weighing and addition routines, although their performance depends on exposure during use. Humid conditions can encourage clumping, while fine particles distribute sweetness differently from larger granules. The timing of addition determines how long the ingredient is in contact with moisture, as material dispersed through dough faces longer contact than a topping applied near the end of production. Pack size and closure influence the condition of material used in later batches.
- Powder / dry accounts for 48.0% of Form in 2026.
- An opened pack should be included in the trial so that exposure to normal bakery conditions is reflected in the result.
How do Bread & rolls support the largest Application position?
Bread & rolls represent 28.0% of Application in 2026.
Enriched rolls carry concentrated caramel sweetness well, and Bread & rolls accounted for approximately USD 36.8 million in 2026. Even inclusion distribution is important to portion consistency, as hard spots or sticky areas affect slicing and texture. Mixing pieces into dough exposes them to more stress than applying them after baking, so the two uses should be assessed separately. A moist centre adds another consideration, as bakery fillings can affect the texture of neighbouring pieces during storage.
- Bread & rolls represent 28.0% of Application in 2026.
- The point at which pieces enter the process should be decided before setting their size and addition rate.
Why do Conventional claims remain the most widely purchased?
Conventional holds 55.0% of Claim in 2026.
Conventional products held 55.0% of the Claim segment in 2026, as they leave room to adjust sugars, fats and coatings while the desired texture is developed. A more restrictive claim may rule out some of those choices or require additional documentation. A coating can also introduce milk, nuts or another allergen even when the core toffee or honeycomb is unchanged, and FDA food allergen labelling guidance is relevant to that assessment[1]. The bakery can then consider the physical result and the label together.
- Conventional holds 55.0% of Claim in 2026.
- Coating ingredients should be reviewed whenever a recipe change affects the finished product's allergen declaration.
What keeps Direct to industrial bakeries ahead among Sales Channels?
Direct to industrial bakeries accounts for 51.0% of Sales Channel in 2026.
Industrial bakeries buying directly can agree particle dimensions, coating and performance before regular production begins, and direct supply accounted for approximately USD 67.0 million in 2026. Qualification against the intended mixing and storage conditions establishes a common specification for later deliveries, which is especially useful when a change of fat or coating would require the bakery to repeat its application work. Smaller customers may prefer a distributor's local stock and lower order quantities.
- Direct to industrial bakeries accounts for 51.0% of Sales Channel in 2026.
- An agreed change-notification procedure helps identify when a new texture or storage trial is needed.
What are the drivers, restraints and opportunities in the toffee & honeycomb pieces market?
Contrasting texture gives familiar bakery recipes another role, while rising sugar costs and moisture contact restrain the market and coated, size-controlled pieces can open demanding applications.
Contrasting texture gives familiar bakery recipes another role
Toffee and honeycomb offer a way to change the eating experience of an established bakery item without replacing its recipe. Harder caramel fragments and lighter aerated pieces create different texture effects in cookies, cakes and related products, and Meadow's 2026 brochure describes both among its confectionery ingredients[4]. With chocolate costs elevated after Barry Callebaut's 49.0% revenue increase on cocoa pricing[8], caramel inclusions offer bakeries an indulgent alternative that does not depend on cocoa. Their usefulness depends on how easily they fit the existing mixing, depositing and packing sequence.
Rising sugar costs and moisture contact restrain the market
Sugar supply is tightening, with the ISO expecting a global deficit of 0.2 million tonnes in 2026/27[5], which may raise the cost of toffee and honeycomb. Texture loss is a further restraint. The crunch that makes honeycomb attractive can disappear when it sits beside a moist cake or filling, and a dry sample gives little indication of that change. Nugrahedi and colleagues' 2025 review examines moisture movement and ways to limit it in bakery products[2]. Breakage creates a separate problem, as fines change sweetness distribution even when the ingredient still tastes right.
Coated and size-controlled pieces can open demanding applications
Coating specifications and controlled particle sizes extend the range of recipes in which an inclusion can keep its texture. Barry Callebaut's cocoa-butter-coated honeycomb granules are a specific example[3], but the bakery still needs to see how they behave in its own product. A surface decoration may need a different size from a piece dispersed through a moist layer, and work with the wider bakery ingredient formulation establishes where to add it. Suppliers that develop lower-cost coatings may gain an advantage while cocoa prices remain high[8].
Which country CAGRs are profiled in the toffee & honeycomb pieces market?
Table 4: Country growth outlook for the toffee & honeycomb pieces market
| Country | CAGR |
|---|---|
| Saudi Arabia | 8.5% |
| UAE | 8.2% |
| South Korea | 7.8% |
| USA | 7.5% |
| UK | 7.2% |
| Germany | 6.9% |
| France | 6.5% |
| Japan | 6.2% |
Saudi Arabia
- Saudi Arabia is the fastest-growing market among the profiled countries, with a forecast CAGR of 8.5% from 2026 to 2036. In Saudi sweet-bread and dessert applications, texture retention through holding and service is central to inclusion selection, as warm holding or chilled storage can make a coated piece behave differently from an uncoated one. Choosing a pack that suits the rate of use limits exposure between batches, and trials across the intended preparation and delivery sequence establish whether the crunch is repeatable.
UAE
- UAE demand spans production bakeries and pastry kitchens, where storage duration and the timing of decoration create different requirements. An inclusion mixed into a product needs to retain texture over time, while a decoration added near service may be chosen mainly for appearance. The UAE is forecast to grow at a CAGR of 8.2% from 2026 to 2036. Keeping a few clearly differentiated formats makes both uses easier to manage.
South Korea
- With a forecast CAGR of 7.8% from 2026 to 2036, South Korea ranks third among the profiled countries. Small pastry formats make particle distribution an important part of the specification, as large fragments dominate the bite while excessive fines lose their texture. A piece within a filled layer may need a different specification from a visible decoration, and comparing the immediate result with the product after display helps identify that difference.
USA
- In US industrial bakery production, breakage during mixing and conveying affects the usable yield of caramel inclusions, so the purchasing comparison must include acceptable yield and distribution. The USA is forecast to grow at a CAGR of 7.5% from 2026 to 2036. US sugar and sweets prices are forecast to rise by 6.6% in 2026[7], which makes yield even more important. Coatings and flavour additions also bring ingredient declaration questions under FDA allergen guidance[1].
UK
- UK bakeries use honeycomb and toffee for crisp texture, chewy caramel character or visible decoration, and each creates a different brief. The UK is forecast to grow at a CAGR of 7.2% from 2026 to 2036. Selecting the intended effect first makes it easier to compare coatings and particle sizes in cakes, cookies or dessert components, and development quantities need to be manageable before a regular order is placed.
Germany
- Germany is forecast to grow at a CAGR of 6.9% from 2026 to 2036. In German packaged bakery products, storage performance shapes the specification of caramel pieces, as material that looks suitable on arrival can change after contact with dough, cream or a moist cake layer. Checking the complete product over its intended life allows comparison of sweetness, distribution and the share of intact pieces. Consistent size grades and an explicit coating description make trials repeatable.
France
- In French pastry, the position of a caramel inclusion determines its moisture exposure and handling needs, as a crisp layer beneath cream faces different conditions from a surface decoration. France is forecast to grow at a CAGR of 6.5% from 2026 to 2036. Defining that position first avoids asking one specification to do every job, and the bakery can then compare sizes and coatings with attention to cutting and holding.
Japan
- Japan is expected to register the slowest growth among the profiled countries, with a forecast CAGR of 6.2% from 2026 to 2036. In small packaged cakes and sweet breads sold in Japan, portion consistency depends on inclusion distribution, so a size specification should be assessed in the finished portion, including cutting and wrapping. Protective packaging and a well-defined grade help control differences before production begins.
Who are the notable companies in the toffee & honeycomb pieces market?
Barry Callebaut; Meadow; Shoebury Confectionery; Pecan Deluxe; OV Group
Barry Callebaut's coated honeycomb granules sit alongside the honeycomb and toffee formats offered by Meadow, Shoebury Confectionery, Pecan Deluxe and OV Group[3][4]. The group brings together broad ingredient suppliers and specialist confectionery manufacturers. Barry Callebaut, the largest of these suppliers, reported 2024/25 revenue of CHF 14.8 billion[8]. All face rising sugar costs in 2026[5][6], which may favour suppliers with efficient production and good yield.
Application conditions provide the basis for comparing these portfolios. A decoration added immediately before service faces a different storage requirement from a piece enclosed in a moist product, and size tolerances and coating descriptions connect each offer with the conditions it is meant to meet.
Competitive Benchmarking: Toffee & Honeycomb Pieces Market
Table 5: Company capabilities in the toffee & honeycomb pieces market
| Company | Product capability | Application emphasis |
|---|---|---|
| Barry Callebaut | Coated honeycomb granules and toffee pieces | Bakery and confectionery inclusions |
| Meadow | Honeycomb, hard toffee and related inclusions | Texture additions for food manufacturers |
| Shoebury Confectionery | Honeycomb chunks and inclusion products | Bulk decoration and ingredient supply |
| Pecan Deluxe | Honeycomb pieces with coating options | Cake decoration and topping applications |
| OV Group | Honeycomb pieces and coated honeycomb | Bakery, chocolate and dessert products |
Key Developments in the Toffee & Honeycomb Pieces Market
- In January 2025, FDA updated its food allergen labelling guidance to Edition 5, which is relevant when a toffee recipe or honeycomb coating changes[1].
- In October 2025, a review in Food Reviews International examined moisture migration and prevention in multi-domain bakery products[2].
- In November 2025, Barry Callebaut reported a 49.0% rise in revenue for 2024/25, driven by cocoa-related pricing[8].
- In September 2026, the ISO cut its 2025/26 global sugar surplus forecast to 1.1 million tonnes and projected a deficit for 2026/27[5].
- In October 2026, the FAO reported that its Sugar Price Index was 14.7% higher than a year earlier[6].
- Meadow's 2026 product brochure describes a portfolio that includes honeycomb and toffee inclusions, with coated and uncoated choices. The documented range gives manufacturers practical formats to compare against their own texture and handling requirements. [4]
Key Players in the Toffee & Honeycomb Pieces Market
- Barry Callebaut
- Meadow
- Shoebury Confectionery
- Pecan Deluxe
- OV Group
Toffee & Honeycomb Pieces Market - Report Scope
Table 6: Report scope for the toffee & honeycomb pieces market
| Coverage field | Report scope |
|---|---|
| Market breakdown | Product Type; Form; Application; Claim; Sales Channel |
| Quantitative Units | USD Million |
| Market Definition | Revenue from supplied toffee or honeycomb pieces and eligible named-ingredient preparations sold within the defined product, form, application, claim and channel categories. Excludes finished baked goods, plain caramel without the named ingredient, substitute crunchy inclusions and unrelated fillings; only the eligible ingredient portion of mixed offerings qualifies. |
| Regions Covered | North America, Latin America, Western Europe, Eastern Europe, East Asia, South Asia and Pacific, Middle East and Africa |
| Countries Covered | Saudi Arabia; UAE; South Korea; USA; UK; Germany; France; Japan |
| Key Companies Profiled | Barry Callebaut; Meadow; Shoebury Confectionery; Pecan Deluxe; OV Group |
| Forecast Period | 2026 to 2036 |
| Approach | Market assessment supported by official technical and regulatory publications, company product information and country operating conditions. |
Toffee & Honeycomb Pieces Market - Research Methodology
Table 7: Research approach for the toffee & honeycomb pieces market
| Method | Approach |
|---|---|
| Market definition | The assessment covers separately supplied toffee and honeycomb pieces and qualifying named-ingredient preparations for bakery applications. |
| Desk research | Government and regulatory publications, technical literature and official product information establish the application and supply context. |
| Commercial assessment | The commercial review considers particle dimensions, breakage, coatings, moisture contact and the texture required after manufacturing and storage. |
| Comparability | Market values, segment allocations and country growth rates use consistent units and the stated 2026 to 2036 forecast period. Company comparisons describe product roles and purchasing relevance. |
Toffee & Honeycomb Pieces Market by Segments
Product Type
- Standard grade
- Premium / specialty grade
- Organic certified
- Clean label grade
Form
- Powder / dry
- Liquid
- Paste / semi-solid
- Granules / pieces
Application
- Bread & rolls
- Cakes & muffins
- Biscuits & cookies
- Viennoiserie & pastry
- Other bakery & snacks
Claim
- Conventional
- Clean label
- Organic
- Non-GMO / identity preserved
Sales Channel
- Direct to industrial bakeries
- Ingredient distributors
- Foodservice & artisan supply
- Online B2B
Toffee & Honeycomb Pieces Market by Region
- North America
- United States
- Canada
- Latin America
- Brazil
- Mexico
- Argentina
- Chile
- Western Europe
- Germany
- France
- United Kingdom
- Italy
- Spain
- Benelux
- Nordics
- Eastern Europe
- Poland
- Czech Republic
- Romania
- Hungary
- East Asia
- China
- Japan
- South Korea
- South Asia and Pacific
- India
- ASEAN
- Australia and New Zealand
- Middle East and Africa
- GCC Countries
- South Africa
- Türkiye
- Israel
Research Sources and Bibliography
- [1] U.S. Food and Drug Administration. (2025, January). Guidance for industry: Questions and answers regarding food allergen labeling (Edition 5).
- [2] Nugrahedi et al. (2025, October 4). Moisture Migration and Its Prevention in Multi-Domain Bakery Products: A Review.
- [3] Barry Callebaut. (n.d.). Salted honeycomb granules cocoa butter coated.
- [4] Meadow. (2026). Meadow product brochure 2026.
- [5] UkrAgroConsult. (2026, September 3). ISO halves global sugar surplus estimate.
- [6] Food and Agriculture Organization of the United Nations. (2026, October 2). FAO Food Price Index.
- [7] USDA Economic Research Service. (2026, September 25). Food price outlook: Summary findings.
- [8] Eastlake, D. (2025, November 5). ConfectioneryNews. Barry Callebaut revenue up 49% but sales down, as cocoa price hikes hit industry leader.
Future Market Insights. (2026). Toffee & Honeycomb Pieces Market: Global Industry Analysis and Opportunity Assessment 2036.
This Report Answers
- What is the size of the toffee & honeycomb pieces market in 2026 and its forecast size in 2036?
- Which bakery differentiation and processing pressures support demand for toffee & honeycomb pieces?
- Why does Standard grade lead the Product Type axis?
- Why does Powder / dry remain the leading Form?
- How do the profiled country CAGRs vary between Saudi Arabia and Japan?
- Which companies supply toffee and honeycomb pieces for bakery use?
Frequently Asked Questions
How big is the toffee & honeycomb pieces market in 2026, and what is forecast for 2036?
The market is valued at USD 131.3 million in 2026 and is forecast to reach USD 258.3 million by 2036.
What is the projected CAGR for the toffee & honeycomb pieces market from 2026 to 2036?
The market is projected to grow at a CAGR of 7.0% from 2026 to 2036.
Which Product Type leads the toffee & honeycomb pieces market?
Standard grade leads Product Type with 45.0% in 2026.
Which Form holds the largest share of the toffee & honeycomb pieces market?
Powder / dry leads Form with 48.0% in 2026.
Which profiled countries have the fastest expected growth?
Saudi Arabia leads at 8.5%, followed by the UAE at 8.2% and South Korea at 7.8% from 2026 to 2036.
Which companies participate in the toffee & honeycomb pieces market?
The report profiles Barry Callebaut, Meadow, Shoebury Confectionery, Pecan Deluxe and OV Group, which offer toffee or honeycomb products used as inclusions, toppings or decorations.
Preview the report firsthand - request a free sample
Get SampleGet the brochure for pricing and purchase details.
Get PDFTable of Content
- Key Takeaways
- Market Size and CAGR
- Top Growth Driver
- Fastest Growing Segment
- Leading Region
- Key Companies
- Emerging Opportunities
- Executive Summary
- Global Market Outlook
- Demand-side Trends
- Supply-side Trends
- Technology Roadmap Analysis
- Analysis and Recommendations
- Analyst Perspective (What is happening? Why now? What should investors know?)
- Key Questions Answered
- How large is the market?
- What is the CAGR?
- What are key trends?
- Which region dominates?
- Who are the leaders?
- Market Overview
- Market Coverage / Taxonomy
- Market Definition / Scope / Limitations
- Research Methodology
- Chapter Orientation
- Analytical Lens and Working Hypotheses
- Market Structure, Signals, and Trend Drivers
- Benchmarking and Cross-market Comparability
- Market Sizing, Forecasting, and Opportunity Mapping
- Research Design and Evidence Framework
- Desk Research Programme (Secondary Evidence)
- Expert Input and Fieldwork (Primary Evidence)
- Tooling, Models, and Reference Databases
- Data Engineering and Model Build
- Quality Assurance and Audit Trail
- Market Background
- Market Dynamics (Drivers, Restraints, Opportunity, Trends)
- Scenario Forecast (Optimistic, Likely, Conservative)
- Impact Analysis
- AI Impact
- Sustainability Impact
- Regulatory Impact
- Technology Impact
- Consumer / Buyer Analysis
- Purchase Drivers
- Adoption Barriers
- Buyer Journey
- Opportunity Map Analysis
- Product Life Cycle Analysis
- Supply Chain Analysis
- Investment Feasibility Matrix
- Value Chain Analysis
- PESTLE and Porter's Analysis
- Regulatory Landscape
- Regional Parent Market Outlook
- Production and Consumption Statistics
- Import and Export Statistics
- Global Market Analysis and Forecast, 2021 to 2036
- Historical Market Size Value (USD Million) Analysis, 2021 to 2025
- Current and Future Market Size Value (USD Million) Projections, 2026 to 2036
- Y-o-Y Growth Trend Analysis
- Absolute $ Opportunity Analysis
- Global Market Pricing Analysis, 2021 to 2036
- Global Market Analysis and Forecast, By Product Type, 2021 to 2036
- Introduction / Key Findings
- Historical Market Size Value (USD Million) Analysis By Product Type, 2021 to 2025
- Current and Future Market Size Value (USD Million) Analysis and Forecast By Product Type, 2026 to 2036
- Standard grade
- Premium / specialty grade
- Organic certified
- Clean label grade
- Y-o-Y Growth Trend Analysis By Product Type, 2021 to 2025
- Absolute $ Opportunity Analysis By Product Type, 2026 to 2036
- Global Market Analysis and Forecast, By Form, 2021 to 2036
- Introduction / Key Findings
- Historical Market Size Value (USD Million) Analysis By Form, 2021 to 2025
- Current and Future Market Size Value (USD Million) Analysis and Forecast By Form, 2026 to 2036
- Powder / dry
- Liquid
- Paste / semi-solid
- Granules / pieces
- Y-o-Y Growth Trend Analysis By Form, 2021 to 2025
- Absolute $ Opportunity Analysis By Form, 2026 to 2036
- Global Market Analysis and Forecast, By Application, 2021 to 2036
- Introduction / Key Findings
- Historical Market Size Value (USD Million) Analysis By Application, 2021 to 2025
- Current and Future Market Size Value (USD Million) Analysis and Forecast By Application, 2026 to 2036
- Bread & rolls
- Cakes & muffins
- Biscuits & cookies
- Viennoiserie & pastry
- Other bakery & snacks
- Y-o-Y Growth Trend Analysis By Application, 2021 to 2025
- Absolute $ Opportunity Analysis By Application, 2026 to 2036
- Global Market Analysis and Forecast, By Claim, 2021 to 2036
- Introduction / Key Findings
- Historical Market Size Value (USD Million) Analysis By Claim, 2021 to 2025
- Current and Future Market Size Value (USD Million) Analysis and Forecast By Claim, 2026 to 2036
- Conventional
- Clean label
- Organic
- Non-GMO / identity preserved
- Y-o-Y Growth Trend Analysis By Claim, 2021 to 2025
- Absolute $ Opportunity Analysis By Claim, 2026 to 2036
- Global Market Analysis and Forecast, By Sales Channel, 2021 to 2036
- Introduction / Key Findings
- Historical Market Size Value (USD Million) Analysis By Sales Channel, 2021 to 2025
- Current and Future Market Size Value (USD Million) Analysis and Forecast By Sales Channel, 2026 to 2036
- Direct to industrial bakeries
- Ingredient distributors
- Foodservice & artisan supply
- Online B2B
- Y-o-Y Growth Trend Analysis By Sales Channel, 2021 to 2025
- Absolute $ Opportunity Analysis By Sales Channel, 2026 to 2036
- Global Market Analysis and Forecast, By Region, 2021 to 2036
- Introduction
- Historical Market Size Value (USD Million) Analysis By Region, 2021 to 2025
- Current Market Size Value (USD Million) Analysis and Forecast By Region, 2026 to 2036
- North America
- Latin America
- Western Europe
- Eastern Europe
- East Asia
- South Asia and Pacific
- Middle East and Africa
- Market Attractiveness Analysis By Region
- North America Market Analysis and Forecast, By Country, 2021 to 2036
- Historical Market Size Value (USD Million) Trend Analysis By Market Taxonomy, 2021 to 2025
- Market Size Value (USD Million) Forecast By Market Taxonomy, 2026 to 2036
- By Country
- United States
- Canada
- By Product Type
- By Form
- By Application
- By Claim
- By Sales Channel
- By Country
- Market Attractiveness Analysis
- By Country
- By Product Type
- By Form
- By Application
- By Claim
- By Sales Channel
- Key Takeaways
- Latin America Market Analysis and Forecast, By Country
- Historical Market Size Value (USD Million) Trend Analysis By Market Taxonomy, 2021 to 2025
- Market Size Value (USD Million) Forecast By Market Taxonomy, 2026 to 2036
- By Country
- Brazil
- Mexico
- Argentina
- Chile
- By Product Type
- By Form
- By Application
- By Claim
- By Sales Channel
- By Country
- Market Attractiveness Analysis
- By Country
- By Product Type
- By Form
- By Application
- By Claim
- By Sales Channel
- Key Takeaways
- Western Europe Market Analysis and Forecast, By Country
- Historical Market Size Value (USD Million) Trend Analysis By Market Taxonomy, 2021 to 2025
- Market Size Value (USD Million) Forecast By Market Taxonomy, 2026 to 2036
- By Country
- Germany
- France
- United Kingdom
- Italy
- Spain
- Benelux
- Nordics
- By Product Type
- By Form
- By Application
- By Claim
- By Sales Channel
- By Country
- Market Attractiveness Analysis
- By Country
- By Product Type
- By Form
- By Application
- By Claim
- By Sales Channel
- Key Takeaways
- Eastern Europe Market Analysis and Forecast, By Country
- Historical Market Size Value (USD Million) Trend Analysis By Market Taxonomy, 2021 to 2025
- Market Size Value (USD Million) Forecast By Market Taxonomy, 2026 to 2036
- By Country
- Poland
- Czech Republic
- Romania
- Hungary
- By Product Type
- By Form
- By Application
- By Claim
- By Sales Channel
- By Country
- Market Attractiveness Analysis
- By Country
- By Product Type
- By Form
- By Application
- By Claim
- By Sales Channel
- Key Takeaways
- East Asia Market Analysis and Forecast, By Country
- Historical Market Size Value (USD Million) Trend Analysis By Market Taxonomy, 2021 to 2025
- Market Size Value (USD Million) Forecast By Market Taxonomy, 2026 to 2036
- By Country
- China
- Japan
- South Korea
- By Product Type
- By Form
- By Application
- By Claim
- By Sales Channel
- By Country
- Market Attractiveness Analysis
- By Country
- By Product Type
- By Form
- By Application
- By Claim
- By Sales Channel
- Key Takeaways
- South Asia and Pacific Market Analysis and Forecast, By Country
- Historical Market Size Value (USD Million) Trend Analysis By Market Taxonomy, 2021 to 2025
- Market Size Value (USD Million) Forecast By Market Taxonomy, 2026 to 2036
- By Country
- India
- ASEAN
- Australia and New Zealand
- By Product Type
- By Form
- By Application
- By Claim
- By Sales Channel
- By Country
- Market Attractiveness Analysis
- By Country
- By Product Type
- By Form
- By Application
- By Claim
- By Sales Channel
- Key Takeaways
- Middle East and Africa Market Analysis and Forecast, By Country
- Historical Market Size Value (USD Million) Trend Analysis By Market Taxonomy, 2021 to 2025
- Market Size Value (USD Million) Forecast By Market Taxonomy, 2026 to 2036
- By Country
- GCC Countries
- South Africa
- Türkiye
- Israel
- By Product Type
- By Form
- By Application
- By Claim
- By Sales Channel
- By Country
- Market Attractiveness Analysis
- By Country
- By Product Type
- By Form
- By Application
- By Claim
- By Sales Channel
- Key Takeaways
- Key Countries Market Analysis
- United States
- Pricing Analysis
- Market Share Analysis, 2025
- By Product Type
- By Form
- By Application
- By Claim
- By Sales Channel
- Canada
- Pricing Analysis
- Market Share Analysis, 2025
- By Product Type
- By Form
- By Application
- By Claim
- By Sales Channel
- Mexico
- Pricing Analysis
- Market Share Analysis, 2025
- By Product Type
- By Form
- By Application
- By Claim
- By Sales Channel
- Brazil
- Pricing Analysis
- Market Share Analysis, 2025
- By Product Type
- By Form
- By Application
- By Claim
- By Sales Channel
- Chile
- Pricing Analysis
- Market Share Analysis, 2025
- By Product Type
- By Form
- By Application
- By Claim
- By Sales Channel
- Germany
- Pricing Analysis
- Market Share Analysis, 2025
- By Product Type
- By Form
- By Application
- By Claim
- By Sales Channel
- United Kingdom
- Pricing Analysis
- Market Share Analysis, 2025
- By Product Type
- By Form
- By Application
- By Claim
- By Sales Channel
- Italy
- Pricing Analysis
- Market Share Analysis, 2025
- By Product Type
- By Form
- By Application
- By Claim
- By Sales Channel
- Spain
- Pricing Analysis
- Market Share Analysis, 2025
- By Product Type
- By Form
- By Application
- By Claim
- By Sales Channel
- France
- Pricing Analysis
- Market Share Analysis, 2025
- By Product Type
- By Form
- By Application
- By Claim
- By Sales Channel
- India
- Pricing Analysis
- Market Share Analysis, 2025
- By Product Type
- By Form
- By Application
- By Claim
- By Sales Channel
- ASEAN
- Pricing Analysis
- Market Share Analysis, 2025
- By Product Type
- By Form
- By Application
- By Claim
- By Sales Channel
- Australia and New Zealand
- Pricing Analysis
- Market Share Analysis, 2025
- By Product Type
- By Form
- By Application
- By Claim
- By Sales Channel
- China
- Pricing Analysis
- Market Share Analysis, 2025
- By Product Type
- By Form
- By Application
- By Claim
- By Sales Channel
- Japan
- Pricing Analysis
- Market Share Analysis, 2025
- By Product Type
- By Form
- By Application
- By Claim
- By Sales Channel
- South Korea
- Pricing Analysis
- Market Share Analysis, 2025
- By Product Type
- By Form
- By Application
- By Claim
- By Sales Channel
- Poland
- Pricing Analysis
- Market Share Analysis, 2025
- By Product Type
- By Form
- By Application
- By Claim
- By Sales Channel
- Hungary
- Pricing Analysis
- Market Share Analysis, 2025
- By Product Type
- By Form
- By Application
- By Claim
- By Sales Channel
- Türkiye
- Pricing Analysis
- Market Share Analysis, 2025
- By Product Type
- By Form
- By Application
- By Claim
- By Sales Channel
- South Africa
- Pricing Analysis
- Market Share Analysis, 2025
- By Product Type
- By Form
- By Application
- By Claim
- By Sales Channel
- Saudi Arabia
- Pricing Analysis
- Market Share Analysis, 2025
- By Product Type
- By Form
- By Application
- By Claim
- By Sales Channel
- UAE
- Pricing Analysis
- Market Share Analysis, 2025
- By Product Type
- By Form
- By Application
- By Claim
- By Sales Channel
- United States
- Market Structure Analysis
- Competition Dashboard
- Competition Benchmarking
- Market Share Analysis of Top Players
- By Regional
- By Product Type
- By Form
- By Application
- By Claim
- By Sales Channel
- Emerging Startups
- Innovation Benchmarking
- Competition Analysis
- Competition Deep Dive
- Barry Callebaut
- Overview
- Product Portfolio
- Profitability by Market Segments
- Sales Footprint
- Strategy Overview
- Marketing Strategy
- Product Strategy
- Channel Strategy
- Meadow
- Shoebury Confectionery
- Pecan Deluxe
- OV Group
- Barry Callebaut
- Case Studies
- Success Stories
- Recent Developments
- Competition Deep Dive
- Assumptions & Acronyms Used


