

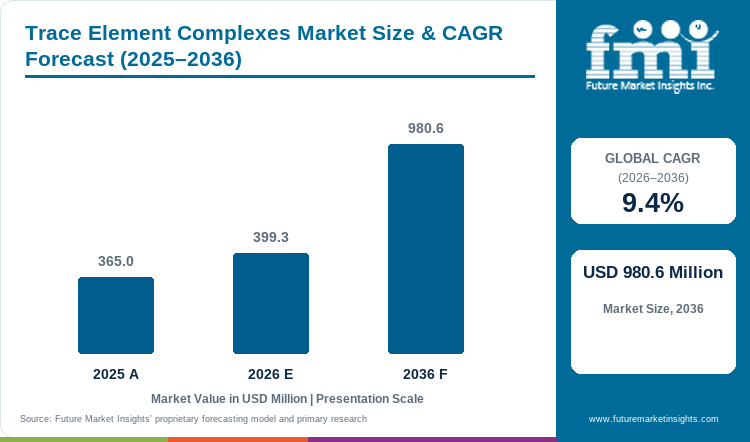
- Market Size (2026)
- USD 399.3 Mn
- Forecast (2036)
- USD 980.6 Mn
- CAGR (2026 to 2036)
- 9.4%
How big is the Trace Element Complexes Market in 2026?
USD 399.3 million in 2026 and USD 980.6 million by 2036, expanding at 9.4% CAGR.
Demand for trace element complexes is projected to expand at 9.4% CAGR from 2026 to 2036. Valuation grows from USD 365.0 million in 2025 to USD 399.3 million in 2026 and reaches USD 980.6 million by 2036. Farmers use these products to keep metallic nutrients available for root uptake during planned crop feeding. In September 2026, FAO reported that irrigation covered 23% of cropland and produced 48% of global crop value. Irrigated crop programs use planned water and fertilizer doses, which makes nutrient delivery easier to control. Poor dose control raises costs when nutrients become unavailable or farms apply more than crops can use. Managed irrigation programs use water-soluble fertilizers because farms can deliver measured nutrients through existing water systems.
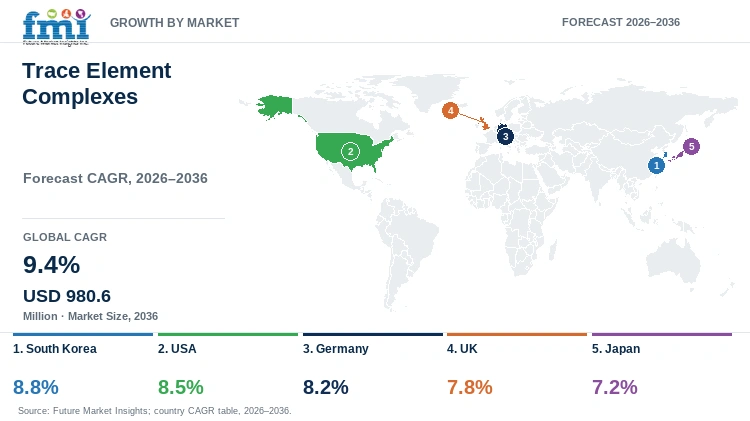
South Korea is projected to grow at 8.8% CAGR through 2036, supported by its national smart-farming expansion plan. Japan is projected at 7.2% CAGR, shaped by an approval route that governs commercial smart-farming systems. In February 2025, MAFRA set a five-year smart-farm plan for South Korea. The plan targets smart systems across 35% of 55,000 greenhouse hectares and 20% of major field-crop areas. Japan follows a separate approval route for commercial smart-farming systems under its national farm framework. South Korea's plan and Japan's approval route make precision agriculture more useful for planned dosing and routine nutrient management. Local dealers translate smart-farm systems into product choices by matching chelate grade with water pH and the existing feed plan.
Key Takeaways
- Soil tests and irrigation raise demand for trace nutrients that stay available across difficult pH and water conditions.
- EDTA - synthetic chelates are projected to hold 39.8% of chelating-agent revenue in 2026, supported by their use across several metals.
- Iron is expected to lead nutrient revenue with 44.5% share in 2026, driven by high-pH conditions that restrict plant uptake.
- Cereals and grains are forecast at 44.7% of crop-type demand in 2026, enabled by established fertilizer application passes.
- A basic salt that meets the crop need makes the chelation premium harder to defend.
- Key players include Yara International, ICL Group, Haifa Group, Syngenta Biologicals, COMPO EXPERT, Van Iperen International, ADOB, and Aries Agro.
Analyst Perspective
"The clearest adoption route is test-guided dosing through existing irrigation and fertilizer programs that already manage water pH. Regular purchasing depends on proving that a premium complex solves a measured nutrient problem better than a lower-cost basic salt."
- Nandini Roy Choudhury, Principal Consultant, Future Market Insights
How is the trace element complexes market segmented?
The trace element complexes market is segmented by Chelating - Complexing Agent, Nutrient, Crop Type, Application Method, Sales Channel, and Region.
Chelating - complexing agent includes EDTA - synthetic chelates, amino acid complexes, organic acid complexes, and lignosulfonates and others. Nutrient includes iron, zinc, manganese and copper, boron - moly and multi-nutrient, and others. The remaining primary axes are Crop Type, Application Method, Sales Channel, and Region.
How does EDTA help formulators choose one chelate for several metals?
EDTA gives formulators one familiar chelate that works with both zinc and manganese products. In January 2025, Van Iperen listed zinc-EDTA and manganese-EDTA in its nutrition archive. The company supports both grades for foliar feeding and fertigation, giving formulators one ligand across several crop programs. The common EDTA chemistry simplifies chelated micronutrient blends when more than one metal is required. EDTA loses stability as soil or water moves into harder alkaline pH ranges. DTPA and EDDHA cover more demanding pH conditions, while HBED provides another route for high-pH iron chelation.
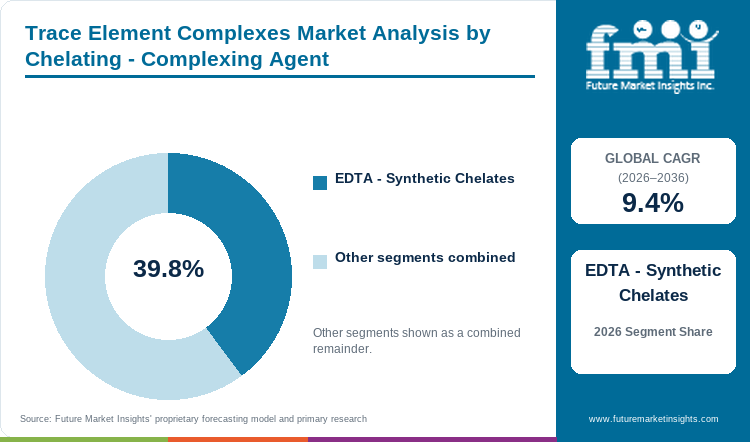
- Within chelating - complexing agents, EDTA - synthetic chelates are estimated at 39.8% in 2026 owing to their use across several metals.
- Formulators check how well the chelate holds up at the farm's pH to choose a soluble grade.
How does alkaline soil make stable iron chelation more valuable?
Alkaline soil can reduce iron availability before roots can absorb the nutrient efficiently. In October 2025, Nouryon described its HBED iron chelate for high-pH crop use. HBED keeps iron soluble under conditions that can weaken simpler nutrient forms. Stable iron supply makes ligand choice more important for crop micronutrients used on alkaline soils. Visible chlorosis and high pH can justify a more stable chelate despite the added cost. Basic iron sources remain practical when soil conditions are less alkaline and nutrient lockup is lower.
- Iron is expected to represent 44.5% of nutrient revenue in 2026, shaped by alkaline conditions that limit plant uptake.
- Advisers check pH and chelate stability to compare iron content and cost.
How do field tests support trace nutrient use in cereals and grains?
Cereal farms can apply trace nutrients through seed treatments and starter fertilizers, with scheduled foliar passes available later in crop development. Field testing helps determine whether those existing routes need an added trace nutrient treatment. In October 2025, Yara doubled soil-test capacity at its Pocklington laboratory. The added capacity helps farms identify fields that require targeted nutrient correction before broad-acre application. Similar testing also guides fertilizer additives used across crop programs with several fertilizer passes. Large fields raise treatment costs when testing does not confirm a clear nutrient need.
- Cereals and grains are forecast to hold 44.7% of crop-type demand in 2026, supported by established fertilizer passes that simplify application.
- Continued use depends on a test that shows a real nutrient need in the field.
How does irrigation compatibility make fertigation a practical application route?
Fertigation moves dissolved nutrients through irrigation lines that already support planned crop feeding. Farmers select grades by comparing solubility with the farm's water pH and tank conditions. In February 2025, Haifa introduced Haifa Soluble DUO for fertigation programs. The product uses existing irrigation infrastructure to deliver soluble crop nutrition during scheduled feeding. Trace element complexes face the same mixing and pH checks before regular dosing. Fertigation monitoring helps farms schedule smaller nutrient doses across the irrigation program.
- Fertigation is set to lead application method with 47.5% share in 2026, enabled by soluble grades that move through irrigation lines.
- Growers check tank mixing and how well the chelate holds the nutrient at the farm's pH.
How does local product advice strengthen sales through agri-input distributors?
Trace element complexes require more product matching than basic nutrient salts because chelate performance depends on crop conditions. Dealers match crop stage and water pH with the appropriate chelate and dose. In January 2025, Haifa opened its India unit to move crop nutrition closer to local farms. Haifa's local presence supports specialty fertilizers that need application guidance during product selection. Direct sales remain more practical for growers who already know the exact grade they need.
- Agri-input distributors are likely to capture 40.6% share in 2026, tied to local advice that helps farms choose suitable grades.
- Dealers match a known crop need with a grade that works on the farm.
What are the drivers, restraints and opportunities in the Trace Element Complexes Market?
Test-guided correction supports demand while premium pricing limits routine use, leaving room for pH-matched chemistry.
- Driver: Soil tests and irrigation raise demand for soluble trace nutrients that plants can use during crop feeding.
- Restraint: Premium chelate costs slow use on fields that do not need a complexed form.
- Opportunity: A wider pH range and farm dosing systems can open more uses for trace nutrients with proven crop results.
Irrigation and testing make trace nutrient needs easier to prove
Irrigated farms use water in crop feeding, so nutrient delivery can follow a controlled schedule. In September 2026, FAO reported that 23% of cropland used irrigation and produced 48% of global crop value. Soil and water chemistry can still reduce metal availability before crops absorb the applied nutrients. Growers compare pH and solubility with the planned tank or spray route before choosing a complexed grade. Agricultural secondary nutrients can enter the same program when testing identifies another nutrient gap. Irrigation alone does not prove demand because the field still needs a measured deficiency. Sales depend on a nutrient gap that the chosen application route can address. Field tests help dealers explain both the required dose and the added cost.
Premium cost and fertilizer rules raise the proof needed for use
Complexed nutrients cost more than basic salts, so regular use needs a clear technical reason. In June 2025, Germany's farm ministry said fertilizers need European or national approval. The ministry links fertilizer type and timing to plant and soil needs under current rules. Approval requirements raise the proof needed for field advice without measuring product sales. Dealers must explain why a chelate suits the crop and the local pH condition. Premium pricing becomes harder to defend when a basic salt produces the required result. Labels and use directions also need review before each grade reaches the field. Together, cost and qualification requirements can slow repeat orders across specialty crop programs.
Wider pH coverage and dose systems can open more uses
New ligands can serve pH ranges that weaken common EDTA grades and limit nutrient stability. Automated irrigation gives soluble grades a planned route for smaller crop-feeding doses. In March 2026, ICL opened a specialty fertilizer plant in Maharashtra. The plant expands local water-soluble fertilizer output within a major import market. Trace element suppliers can use the same route when their grades pass tank and pH checks. Fertigation skids help farms deliver smaller doses through automated water systems with less manual handling. Suppliers still need crop-response evidence and clear mixing instructions before regular use becomes practical. Grades that solve a measured field problem can expand through the existing feed system without adding new handling steps.
Which country CAGRs are profiled in the Trace Element Complexes Market?
| Country | CAGR |
|---|---|
| South Korea | 8.8% |
| USA | 8.5% |
| Germany | 8.2% |
| UK | 7.8% |
| Japan | 7.2% |
How do country-level CAGRs compare in the Trace Element Complexes Market?
South Korea and the USA have the faster CAGRs in this five-country set. Germany follows them with an 8.2% forecast rate through 2036. The UK and Japan have lower forecast rates over the same period. The 1.6-point spread compares forecast speed rather than current sales. Farm systems and local rules shape how crop needs become orders in each country.
- South Korea's large greenhouse base gives soluble trace products a defined route through planned water and nutrient management.
- Large U.S. crop programs provide several fertilizer application routes that can carry specialty micronutrients when a measured need exists.
- Germany's distributor reviews favor clear pH guidance and use instructions that help match specialty grades with local crop conditions.
- UK arable programs favor trace products with clear dose guidance that fits existing fertilizer and spray schedules.
- Japanese distributors can favor soluble grades that fit existing nutrient tanks without adding a separate handling step.
Similar CAGRs can create different sales paths because farm rules and service needs vary. Each country needs support that matches its local buying process. The full report provides country-level CAGR analysis across North America and Latin America. Western Europe and Eastern Europe are also covered alongside East Asia. The analysis also includes South Asia and Pacific plus the Middle East and Africa.
Country-wise Analysis
- U.S. farms use crop tests and fertilizer records to plan micronutrient applications. The USA is estimated to post 8.5% CAGR through 2036, linked to several application routes in large crop programs. In May 2026, USDA NASS reported that its potato survey covered 91.9% of planted acres. Nitrogen reached 99% of planted acres and phosphate reached 88% in the same survey. The reported nutrient rates describe an intensive crop-feed base rather than direct trace element complex sales. A chelated grade still needs a measured nutrient gap before farms pay the added premium. Advisers connect pH tests with crop response and select a practical application route. Regular orders depend on field proof that converts the chosen grade into a clear dose plan.
- Trace element complex demand in the UK is forecast to rise at 7.8% CAGR through 2036, influenced by nutrient-efficiency reviews. UK arable farms weigh input cost against measured crop response during each nutrient-plan review. In April 2026, AHDB released RB209 2026 after receiving feedback from more than 900 people. The review identified nutrient use efficiency as its main work area. The efficiency focus raises the proof required before farms adopt a premium trace product. Dealers must explain the crop need and connect the grade with a practical application route. Wider use depends on a farm plan that can recover the added product cost. Clear dose guidance helps farms judge that trade-off before regular purchasing begins.
- German fertilizer programs operate under firm rules for product approval and labeling. Germany is projected to grow at 8.2% CAGR through 2036, constrained by approval rules that raise qualification requirements. In June 2025, Germany's farm ministry said fertilizers need European or national approval. The ministry also linked fertilizer type and timing to plant and soil needs. Complexed micronutrients need accurate claims and a clear field use case before purchase. Field proof matters alongside price during distributor review and product selection. Clear labels and pH guidance can shorten the review for suitable specialty grades. Product documentation connects regulatory requirements with crop-specific use and local pH conditions.
- Trace element complex demand in Japan is predicted to advance at 7.2% CAGR through 2036, enabled by approved smart-farming tools for managed dosing. Commercial farms are adding approved smart tools to established crop-management plans. In September 2026, MAFF reported 226 certified production-method plans for farm automation and data use. The certified plans measure approved automation activity rather than trace element complex sales. Soluble complexes must work with existing nutrient tanks and the farm's feeding routine. Local advisers can reduce dose and mixing errors during initial product trials. Automation does not prove that every farm has a trace nutrient need. Trial results give farms a clearer basis for deciding whether regular use is justified.
- South Korea is deploying smart-farm systems that meter water and crop inputs across production. Trace element complex demand is projected to grow at 8.8% CAGR through 2036, reinforced by national plans for controlled input systems. In February 2025, MAFRA announced its 2025-2029 master plan for smart farming. Smart conversion targets cover 35% of 55,000 greenhouse hectares under the plan. MAFRA also targets smart tools across 20% of major field-crop areas. Smart-farm systems make soluble nutrient dosing easier to schedule across managed farms. MAFRA also reported gaps in specialist firms and trained staff. Dealer training and clear dose guides become more important as the equipment base expands. Local service helps farms operate smart-farm systems correctly and supports regular product use.
Who are the notable companies in the Trace Element Complexes Market?
Yara International, ICL Group, Haifa Group, Syngenta Biologicals, COMPO EXPERT, Van Iperen International, ADOB, and Aries Agro are active within the defined trace element complexes supply boundary.
Competition spans established crop-nutrition groups and specialized agricultural chemistry firms. Entry depends on grades that match crop needs and local pH conditions. Aries Agro supports Indian production through local plants and established dealer reach. The wider fertilizer sector rewards local stock that remains close to farming regions.
- Yara International, ICL Group, and Haifa Group combine trace nutrients with soluble crop feed. Their broader crop-nutrition platforms serve the same farm programs and application routes.
- Syngenta Biologicals, COMPO EXPERT, and ADOB focus on crop chelation systems that support different formulation and application routes.
- Van Iperen International and Aries Agro use dealer networks or local plants to improve access to specialist crop nutrition programs.
Competitive Benchmarking: Trace Element Complexes Market
| Company | Complexing Chemistry Breadth | Soluble Application Coverage | Micronutrient Portfolio Depth | Geographic Reach |
|---|---|---|---|---|
| Yara International | Medium | High | High | Global |
| ICL Group | Medium | High | High | Global |
| Haifa Group | High | High | High | Global |
| Syngenta Biologicals | High | High | High | Global |
| COMPO EXPERT | Medium | High | High | Europe, Americas, Asia and Africa |
| Van Iperen International | High | High | High | Global |
| ADOB | High | High | High | Europe and export markets |
| Aries Agro | Medium | Medium | High | India and selected exports |
Scoring reviews chemistry breadth and soluble application coverage across each company. The benchmark also compares micronutrient portfolio depth with the geographic reach of each supplier. High chemistry breadth means three chelate systems or a distinct in-house route. Medium chemistry breadth covers companies that remain below that threshold. High application coverage requires both fertigation and foliar use within the product range. Medium coverage applies when the range supports only one of those routes. High portfolio depth means four trace nutrients or multi-element coverage. Medium depth applies when fewer nutrients fall inside the documented portfolio.
Key Developments in the Trace Element Complexes Market
- In October 2025, Yara International expanded soil-analysis capacity at its Pocklington laboratory. The expansion doubled the number of soil and leaf tests the laboratory can handle.
- In April 2025, COMPO EXPERT introduced its Basfoliar Premium SL foliar nutrition line. The products include pH buffering and tank-mix features for foliar crop programs.
- In February 2025, Haifa North West Europe introduced Haifa Soluble DUO for fertigation programs. The water-soluble product supports crop feeding through existing irrigation systems.
Key Players in the Trace Element Complexes Market
Integrated Crop-Nutrition Platforms
- Yara International
- ICL Group
- Haifa Group
Specialty Chemistry and Formulation
- Syngenta Biologicals
- COMPO EXPERT
- ADOB
International and Crop-Specific Specialists
- Van Iperen International
- Aries Agro
Trace Element Complexes Market - Report Scope
| Coverage field | Report scope |
|---|---|
| Market breakdown | By chelating - complexing agent, nutrient, crop type, application method, sales channel, and region. |
| Quantitative Units | USD million. |
| Market Definition | Commercial crop-nutrition products that supply metallic trace nutrients in chelated or complexed forms within the stated segment universe. |
| Regions Covered | North America, Latin America, Western Europe, Eastern Europe, East Asia, South Asia and Pacific, and Middle East and Africa. |
| Countries Covered | South Korea, USA, Germany, UK, Japan, and 20+ countries included in the full report. |
| Key Companies Profiled | Yara International, ICL Group, Haifa Group, Syngenta Biologicals, COMPO EXPERT, Van Iperen International, ADOB, Aries Agro. |
| Forecast Period | 2026 to 2036. |
| Approach | Primary and secondary research with market triangulation. |
Trace Element Complexes Market - Research Methodology
| Method | Approach |
|---|---|
| Primary Research | FMI analysts gathered input from manufacturers, service providers, technology developers, distributors, end users, procurement teams, and subject-matter experts. Interviews examined purchasing decisions, product or service evaluation, adoption barriers, approval requirements, pricing considerations, and expectations for technical or commercial support. Respondents were also asked what evidence is required before a trial, pilot, or initial order develops into regular purchasing. |
| Desk Research | Desk research covered government statistics, regulatory publications, trade data, industry associations, technical literature, standards, company filings, product information, and official corporate announcements. Sources were reviewed for relevance, publication date, geographic coverage, and consistency with the defined market scope. Claims relating to performance, applications, approvals, capacity, investment, and commercial activity were retained only when supported by credible public evidence. |
| Market Sizing and Forecasting | The market model combined the baseline value with historical performance, segment structure, pricing and volume indicators, adoption levels, company participation, and country-level demand conditions. Forecast assumptions considered economic activity, investment trends, regulatory developments, technology adoption, purchasing cycles, supply availability, and barriers to wider market use. Segment and regional estimates were reconciled before the final market total was calculated. |
| Data Validation | Estimates were checked against multiple independent indicators, including public data, company activity, trade patterns, industry developments, and findings from primary interviews. Validation also tested whether products, services, applications, and company revenues fell within the defined market boundaries. Adjacent categories, unsupported claims, overlapping revenues, and activities without direct market relevance were excluded to reduce double counting and maintain consistency across segments and countries. |
Trace Element Complexes Market by Segments
Trace Element Complexes Market segmented by Chelating - Complexing Agent:
- EDTA - Synthetic Chelates
- Amino Acid Complexes
- Organic Acid Complexes
- Lignosulfonates & Others
Trace Element Complexes Market segmented by Nutrient:
- Iron
- Zinc
- Manganese & Copper
- Boron - Moly & Multi-Nutrient
- Others
Trace Element Complexes Market segmented by Crop Type:
- Cereals & Grains
- Fruits & Vegetables
- Oilseeds & Pulses
- Turf & Ornamentals
- Others
Trace Element Complexes Market segmented by Application Method:
- Fertigation
- Foliar
- Soil
- Others
Trace Element Complexes Market segmented by Sales Channel:
- Agri-Input Distributors
- Cooperatives
- Agri-Retail Chains
- Online - Direct-to-Farm
- Others
Trace Element Complexes Market by Region:
- North America
- United States
- Canada
- Latin America
- Brazil
- Mexico
- Chile
- Rest of Latin America
- Western Europe
- Germany
- United Kingdom
- Italy
- Spain
- France
- Nordics
- Benelux
- Rest of Western Europe
- Eastern Europe
- Russia
- Poland
- Hungary
- Balkan and Baltic States
- Rest of Eastern Europe
- East Asia
- China
- Japan
- South Korea
- South Asia and Pacific
- India
- ASEAN
- Australia and New Zealand
- Rest of South Asia and Pacific
- Middle East and Africa
- Kingdom of Saudi Arabia
- Other GCC Countries
- Türkiye
- South Africa
- Other African Union Countries
- Rest of Middle East and Africa
Research Sources and Bibliography
- Food and Agriculture Organization of the United Nations. (2026). Irrigation management. Retrieved September 22, 2026.
- Ministry of Agriculture, Food and Rural Affairs, Republic of Korea. (2025, February 26). First master plan for promotion of the smart-farming industry, 2025-2029.
- Van Iperen International. (2025, January 16). Nutrition archive: Oligo Zinc-EDTA 15% and Oligo Manganese-EDTA 13%.
- Nouryon. (2025, October). Celebrating World Fertilizer Day with innovation: HBED iron chelate.
- Yara International. (2025, October 28). Yara expands soil analysis capacity to meet growing demand.
- Haifa Group. (2025, February 17). Haifa North West Europe launches water-soluble fertilizer Haifa Soluble DUO.
- Haifa Group. (2025, January 23). Haifa Group launches its 18th international subsidiary in India.
- Federal Ministry of Agriculture, Food and Regional Identity, Germany. (2025, June 17). Fertilization.
- ICL Group. (2026, March 18). ICL Group opens specialty fertilizer manufacturing facility in India.
- USDA National Agricultural Statistics Service. (2026, May). 2025 Agricultural Chemical Use Survey: Potatoes.
- Agriculture and Horticulture Development Board. (2026, April 1). Latest edition of Nutrient Management Guide RB209 now available.
- Ministry of Agriculture, Forestry and Fisheries, Japan. (2026, September 3). Status of certified production-method innovation plans.
- Yara International. (2026, January). Capital Markets Day 2026 presentation.
- COMPO EXPERT. (2025, April 2). Introducing the Basfoliar Premium SL line: Powered by Leaf Care Technology.
- Syngenta. (2025, June 30). Syngenta expands biological solutions and manufacturing capacity.
- Aries Agro Limited. (2026, February 12). Inauguration of manufacturing unit at GIDC Sayakha Industrial Estate.
- ADOB. (2025, October 22). ADOB and Hazera collaboration in action! [English translation].
- ICL Group. (2026, February). Fourth quarter and full year 2025 results.
- Haifa Group. (2025, August 10). Haifa India inaugurates new headquarters in Hyderabad.
- Syngenta. (2025, January 9). Artificial intelligence is speeding up development of the next generation of biostimulants.
- COMPO EXPERT. (2025, June 10). Next low-carbon raw material.
- Van Iperen International. (2025, October 10). IPE Technology is now CE biostimulant certified.
- Aries Agro Limited. (2026, March 5). Inauguration of relocated manufacturing unit in Unnao, Uttar Pradesh.
The bibliography gives readers a concise list of supporting research sources. The full report contains the complete reference list and detailed citations.
This Report Answers
- How large is the trace element complexes market in 2026 and 2036?
- What factors support demand for complexed crop micronutrients across farming programs?
- Why do EDTA - synthetic chelates hold 39.8% of chelating-agent revenue?
- Why does iron hold 44.5% of trace element nutrient revenue?
- Why do cereals and grains hold 44.7% of crop-type demand?
- Why does fertigation hold 47.5% of application-method revenue in 2026?
- How do demand conditions differ across the five profiled countries?
- Which companies serve both integrated nutrition and specialty chemistry programs?
- Which cost and qualification issues can delay regular product orders?
Frequently Asked Questions
How big is the trace element complexes market in 2026?
The trace element complexes market is valued at USD 399.3 million in 2026 and is forecast at USD 980.6 million by 2036. Trace element complexes help keep metallic nutrients available under soil or water conditions that can reduce plant uptake.
What is the CAGR of the trace element complexes market from 2026 to 2036?
The trace element complexes market is projected to grow at 9.4% CAGR between 2026 and 2036. Soil tests and irrigation support the forecast because complexed nutrients can stay available for measured crop needs through a suitable use route.
Which chelating - complexing agent segment leads the trace element complexes market in 2026?
The EDTA - synthetic chelates segment is estimated to hold 39.8% of chelating - complexing agent revenue in 2026. Formulators use EDTA with several metals and choose it for programs inside its stable pH range.
Which nutrient segment leads the trace element complexes market in 2026?
The iron segment is projected to account for 44.5% of nutrient revenue in 2026. High pH can reduce plant uptake of iron, so formulators check chelate stability before choosing a soil or fertigation grade.
Which crop type leads the trace element complexes market in 2026?
The cereals and grains segment is set to hold 44.7% of crop-type demand in 2026. Field use depends on test results that support the higher cost and place the trace nutrient inside an existing fertilizer pass.
Which application method leads the trace element complexes market in 2026?
Fertigation is forecast to represent 47.5% of application-method revenue in 2026. Growers check solubility and tank mixing for the dose and use water pH to set the farm's irrigation plan.
Which profiled countries have the higher forecast growth rates in the trace element complexes market?
South Korea is projected at 8.8% CAGR through 2036 and the USA at 8.5%. Germany is projected at 8.2% as local farm systems and rules shape how measured nutrient needs become product orders in each country.
Which companies are active in the trace element complexes market?
Key companies include Yara International, ICL Group, Haifa Group, Syngenta Biologicals, COMPO EXPERT, Van Iperen International, ADOB, and Aries Agro. Chelate range and crop support shape product choice across different application routes. Local stock and regional supply also influence regular farm orders.
Preview the report firsthand - request a free sample
Get SampleGet the brochure for pricing and purchase details.
Get PDFTable of Content
- Key Takeaways
- Market Size and CAGR
- Top Growth Driver
- Fastest Growing Segment
- Leading Region
- Key Companies
- Emerging Opportunities
- Executive Summary
- Global Market Outlook
- Demand-side Trends
- Supply-side Trends
- Technology Roadmap Analysis
- Analysis and Recommendations
- Analyst Perspective (What is happening? Why now? What should investors know?)
- Key Questions Answered
- How large is the market?
- What is the CAGR?
- What are key trends?
- Which region dominates?
- Who are the leaders?
- Market Overview
- Market Coverage / Taxonomy
- Market Definition / Scope / Limitations
- Research Methodology
- Chapter Orientation
- Analytical Lens and Working Hypotheses
- Market Structure, Signals, and Trend Drivers
- Benchmarking and Cross-market Comparability
- Market Sizing, Forecasting, and Opportunity Mapping
- Research Design and Evidence Framework
- Desk Research Programme (Secondary Evidence)
- Expert Input and Fieldwork (Primary Evidence)
- Tooling, Models, and Reference Databases
- Data Engineering and Model Build
- Quality Assurance and Audit Trail
- Market Background
- Market Dynamics (Drivers, Restraints, Opportunity, Trends)
- Scenario Forecast (Optimistic, Likely, Conservative)
- Impact Analysis
- AI Impact
- Sustainability Impact
- Regulatory Impact
- Technology Impact
- Consumer / Buyer Analysis
- Purchase Drivers
- Adoption Barriers
- Buyer Journey
- Opportunity Map Analysis
- Product Life Cycle Analysis
- Supply Chain Analysis
- Investment Feasibility Matrix
- Value Chain Analysis
- PESTLE and Porter's Analysis
- Regulatory Landscape
- Regional Parent Market Outlook
- Production and Consumption Statistics
- Import and Export Statistics
- Global Market Analysis and Forecast, 2021 to 2036
- Historical Market Size Value (USD Million) Analysis, 2021 to 2025
- Current and Future Market Size Value (USD Million) Projections, 2026 to 2036
- Y-o-Y Growth Trend Analysis
- Absolute $ Opportunity Analysis
- Global Market Pricing Analysis, 2021 to 2036
- Global Market Analysis and Forecast, By Chelating - Complexing Agent, 2021 to 2036
- Introduction / Key Findings
- Historical Market Size Value (USD Million) Analysis By Chelating - Complexing Agent, 2021 to 2025
- Current and Future Market Size Value (USD Million) Analysis and Forecast By Chelating - Complexing Agent, 2026 to 2036
- EDTA - Synthetic Chelates
- Amino Acid Complexes
- Organic Acid Complexes
- Lignosulfonates & Others
- Y-o-Y Growth Trend Analysis By Chelating - Complexing Agent, 2021 to 2025
- Absolute $ Opportunity Analysis By Chelating - Complexing Agent, 2026 to 2036
- Global Market Analysis and Forecast, By Nutrient, 2021 to 2036
- Introduction / Key Findings
- Historical Market Size Value (USD Million) Analysis By Nutrient, 2021 to 2025
- Current and Future Market Size Value (USD Million) Analysis and Forecast By Nutrient, 2026 to 2036
- Iron
- Zinc
- Manganese & Copper
- Boron - Moly & Multi-Nutrient
- Others
- Y-o-Y Growth Trend Analysis By Nutrient, 2021 to 2025
- Absolute $ Opportunity Analysis By Nutrient, 2026 to 2036
- Global Market Analysis and Forecast, By Crop Type, 2021 to 2036
- Introduction / Key Findings
- Historical Market Size Value (USD Million) Analysis By Crop Type, 2021 to 2025
- Current and Future Market Size Value (USD Million) Analysis and Forecast By Crop Type, 2026 to 2036
- Cereals & Grains
- Fruits & Vegetables
- Oilseeds & Pulses
- Turf & Ornamentals
- Others
- Y-o-Y Growth Trend Analysis By Crop Type, 2021 to 2025
- Absolute $ Opportunity Analysis By Crop Type, 2026 to 2036
- Global Market Analysis and Forecast, By Application Method, 2021 to 2036
- Introduction / Key Findings
- Historical Market Size Value (USD Million) Analysis By Application Method, 2021 to 2025
- Current and Future Market Size Value (USD Million) Analysis and Forecast By Application Method, 2026 to 2036
- Fertigation
- Foliar
- Soil
- Others
- Y-o-Y Growth Trend Analysis By Application Method, 2021 to 2025
- Absolute $ Opportunity Analysis By Application Method, 2026 to 2036
- Global Market Analysis and Forecast, By Sales Channel, 2021 to 2036
- Introduction / Key Findings
- Historical Market Size Value (USD Million) Analysis By Sales Channel, 2021 to 2025
- Current and Future Market Size Value (USD Million) Analysis and Forecast By Sales Channel, 2026 to 2036
- Agri-Input Distributors
- Cooperatives
- Agri-Retail Chains
- Online - Direct-to-Farm
- Others
- Y-o-Y Growth Trend Analysis By Sales Channel, 2021 to 2025
- Absolute $ Opportunity Analysis By Sales Channel, 2026 to 2036
- Global Market Analysis and Forecast, By Region, 2021 to 2036
- Introduction
- Historical Market Size Value (USD Million) Analysis By Region, 2021 to 2025
- Current Market Size Value (USD Million) Analysis and Forecast By Region, 2026 to 2036
- North America
- Latin America
- Western Europe
- Eastern Europe
- East Asia
- South Asia and Pacific
- Middle East and Africa
- Market Attractiveness Analysis By Region
- North America Market Analysis and Forecast, By Country, 2021 to 2036
- Historical Market Size Value (USD Million) Trend Analysis By Market Taxonomy, 2021 to 2025
- Market Size Value (USD Million) Forecast By Market Taxonomy, 2026 to 2036
- By Country
- United States
- Canada
- By Chelating - Complexing Agent
- By Nutrient
- By Crop Type
- By Application Method
- By Sales Channel
- By Country
- Market Attractiveness Analysis
- By Country
- By Chelating - Complexing Agent
- By Nutrient
- By Crop Type
- By Application Method
- By Sales Channel
- Key Takeaways
- Latin America Market Analysis and Forecast, By Country
- Historical Market Size Value (USD Million) Trend Analysis By Market Taxonomy, 2021 to 2025
- Market Size Value (USD Million) Forecast By Market Taxonomy, 2026 to 2036
- By Country
- Brazil
- Mexico
- Chile
- Rest of Latin America
- By Chelating - Complexing Agent
- By Nutrient
- By Crop Type
- By Application Method
- By Sales Channel
- By Country
- Market Attractiveness Analysis
- By Country
- By Chelating - Complexing Agent
- By Nutrient
- By Crop Type
- By Application Method
- By Sales Channel
- Key Takeaways
- Western Europe Market Analysis and Forecast, By Country
- Historical Market Size Value (USD Million) Trend Analysis By Market Taxonomy, 2021 to 2025
- Market Size Value (USD Million) Forecast By Market Taxonomy, 2026 to 2036
- By Country
- Germany
- United Kingdom
- Italy
- Spain
- France
- Nordics
- Benelux
- Rest of Western Europe
- By Chelating - Complexing Agent
- By Nutrient
- By Crop Type
- By Application Method
- By Sales Channel
- By Country
- Market Attractiveness Analysis
- By Country
- By Chelating - Complexing Agent
- By Nutrient
- By Crop Type
- By Application Method
- By Sales Channel
- Key Takeaways
- Eastern Europe Market Analysis and Forecast, By Country
- Historical Market Size Value (USD Million) Trend Analysis By Market Taxonomy, 2021 to 2025
- Market Size Value (USD Million) Forecast By Market Taxonomy, 2026 to 2036
- By Country
- Russia
- Poland
- Hungary
- Balkan and Baltic States
- Rest of Eastern Europe
- By Chelating - Complexing Agent
- By Nutrient
- By Crop Type
- By Application Method
- By Sales Channel
- By Country
- Market Attractiveness Analysis
- By Country
- By Chelating - Complexing Agent
- By Nutrient
- By Crop Type
- By Application Method
- By Sales Channel
- Key Takeaways
- East Asia Market Analysis and Forecast, By Country
- Historical Market Size Value (USD Million) Trend Analysis By Market Taxonomy, 2021 to 2025
- Market Size Value (USD Million) Forecast By Market Taxonomy, 2026 to 2036
- By Country
- China
- Japan
- South Korea
- By Chelating - Complexing Agent
- By Nutrient
- By Crop Type
- By Application Method
- By Sales Channel
- By Country
- Market Attractiveness Analysis
- By Country
- By Chelating - Complexing Agent
- By Nutrient
- By Crop Type
- By Application Method
- By Sales Channel
- Key Takeaways
- South Asia and Pacific Market Analysis and Forecast, By Country
- Historical Market Size Value (USD Million) Trend Analysis By Market Taxonomy, 2021 to 2025
- Market Size Value (USD Million) Forecast By Market Taxonomy, 2026 to 2036
- By Country
- India
- ASEAN
- Australia and New Zealand
- Rest of South Asia and Pacific
- By Chelating - Complexing Agent
- By Nutrient
- By Crop Type
- By Application Method
- By Sales Channel
- By Country
- Market Attractiveness Analysis
- By Country
- By Chelating - Complexing Agent
- By Nutrient
- By Crop Type
- By Application Method
- By Sales Channel
- Key Takeaways
- Middle East and Africa Market Analysis and Forecast, By Country
- Historical Market Size Value (USD Million) Trend Analysis By Market Taxonomy, 2021 to 2025
- Market Size Value (USD Million) Forecast By Market Taxonomy, 2026 to 2036
- By Country
- Kingdom of Saudi Arabia
- Other GCC Countries
- Türkiye
- South Africa
- Other African Union Countries
- Rest of Middle East and Africa
- By Chelating - Complexing Agent
- By Nutrient
- By Crop Type
- By Application Method
- By Sales Channel
- By Country
- Market Attractiveness Analysis
- By Country
- By Chelating - Complexing Agent
- By Nutrient
- By Crop Type
- By Application Method
- By Sales Channel
- Key Takeaways
- Key Countries Market Analysis
- United States
- Pricing Analysis
- Market Share Analysis, 2025
- By Chelating - Complexing Agent
- By Nutrient
- By Crop Type
- By Application Method
- By Sales Channel
- Canada
- Pricing Analysis
- Market Share Analysis, 2025
- By Chelating - Complexing Agent
- By Nutrient
- By Crop Type
- By Application Method
- By Sales Channel
- Mexico
- Pricing Analysis
- Market Share Analysis, 2025
- By Chelating - Complexing Agent
- By Nutrient
- By Crop Type
- By Application Method
- By Sales Channel
- Brazil
- Pricing Analysis
- Market Share Analysis, 2025
- By Chelating - Complexing Agent
- By Nutrient
- By Crop Type
- By Application Method
- By Sales Channel
- Chile
- Pricing Analysis
- Market Share Analysis, 2025
- By Chelating - Complexing Agent
- By Nutrient
- By Crop Type
- By Application Method
- By Sales Channel
- Germany
- Pricing Analysis
- Market Share Analysis, 2025
- By Chelating - Complexing Agent
- By Nutrient
- By Crop Type
- By Application Method
- By Sales Channel
- United Kingdom
- Pricing Analysis
- Market Share Analysis, 2025
- By Chelating - Complexing Agent
- By Nutrient
- By Crop Type
- By Application Method
- By Sales Channel
- Italy
- Pricing Analysis
- Market Share Analysis, 2025
- By Chelating - Complexing Agent
- By Nutrient
- By Crop Type
- By Application Method
- By Sales Channel
- Spain
- Pricing Analysis
- Market Share Analysis, 2025
- By Chelating - Complexing Agent
- By Nutrient
- By Crop Type
- By Application Method
- By Sales Channel
- France
- Pricing Analysis
- Market Share Analysis, 2025
- By Chelating - Complexing Agent
- By Nutrient
- By Crop Type
- By Application Method
- By Sales Channel
- India
- Pricing Analysis
- Market Share Analysis, 2025
- By Chelating - Complexing Agent
- By Nutrient
- By Crop Type
- By Application Method
- By Sales Channel
- ASEAN
- Pricing Analysis
- Market Share Analysis, 2025
- By Chelating - Complexing Agent
- By Nutrient
- By Crop Type
- By Application Method
- By Sales Channel
- Australia and New Zealand
- Pricing Analysis
- Market Share Analysis, 2025
- By Chelating - Complexing Agent
- By Nutrient
- By Crop Type
- By Application Method
- By Sales Channel
- China
- Pricing Analysis
- Market Share Analysis, 2025
- By Chelating - Complexing Agent
- By Nutrient
- By Crop Type
- By Application Method
- By Sales Channel
- Japan
- Pricing Analysis
- Market Share Analysis, 2025
- By Chelating - Complexing Agent
- By Nutrient
- By Crop Type
- By Application Method
- By Sales Channel
- South Korea
- Pricing Analysis
- Market Share Analysis, 2025
- By Chelating - Complexing Agent
- By Nutrient
- By Crop Type
- By Application Method
- By Sales Channel
- Russia
- Pricing Analysis
- Market Share Analysis, 2025
- By Chelating - Complexing Agent
- By Nutrient
- By Crop Type
- By Application Method
- By Sales Channel
- Poland
- Pricing Analysis
- Market Share Analysis, 2025
- By Chelating - Complexing Agent
- By Nutrient
- By Crop Type
- By Application Method
- By Sales Channel
- Hungary
- Pricing Analysis
- Market Share Analysis, 2025
- By Chelating - Complexing Agent
- By Nutrient
- By Crop Type
- By Application Method
- By Sales Channel
- Kingdom of Saudi Arabia
- Pricing Analysis
- Market Share Analysis, 2025
- By Chelating - Complexing Agent
- By Nutrient
- By Crop Type
- By Application Method
- By Sales Channel
- Türkiye
- Pricing Analysis
- Market Share Analysis, 2025
- By Chelating - Complexing Agent
- By Nutrient
- By Crop Type
- By Application Method
- By Sales Channel
- South Africa
- Pricing Analysis
- Market Share Analysis, 2025
- By Chelating - Complexing Agent
- By Nutrient
- By Crop Type
- By Application Method
- By Sales Channel
- United States
- Market Structure Analysis
- Competition Dashboard
- Competition Benchmarking
- Market Share Analysis of Top Players
- By Regional
- By Chelating - Complexing Agent
- By Nutrient
- By Crop Type
- By Application Method
- By Sales Channel
- Emerging Startups
- Innovation Benchmarking
- Competition Analysis
- Competition Deep Dive
- Yara International
- Overview
- Product Portfolio
- Profitability by Market Segments
- Sales Footprint
- Strategy Overview
- Marketing Strategy
- Product Strategy
- Channel Strategy
- ICL Group
- Haifa Group
- Syngenta Biologicals
- COMPO EXPERT
- Van Iperen International
- ADOB
- Aries Agro
- Yara International
- Case Studies
- Success Stories
- Recent Developments
- Competition Deep Dive
- Assumptions & Acronyms Used


