

- Market Size (2026)
- USD 720.6 Mn
- Forecast (2036)
- USD 1444.2 Mn
- CAGR (2026 to 2036)
- 7.2%
How big is the Trench Gas Detectors Market in 2026?
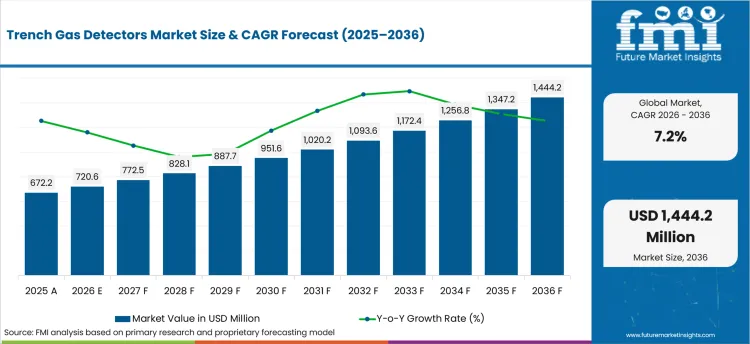
USD 720.6 million in 2026 and USD 1,444.2 million by 2036 at a 7.2% CAGR.
Demand for trench gas detectors is projected to expand at 7.2% CAGR between 2026 and 2036, increasing valuation from USD 720.6 million in 2026 to USD 1,444.2 million by 2036. Utility crews use portable monitors before manhole or trench entry because oxygen loss or a combustible atmosphere is expected to develop without visible warning. OSHA published a 5-step confined-space safety sequence in September 2025 that begins with continuous air testing before entry. The sequence ties detector choice to repeatable entry checks and is projected to support related gas detection equipment purchases around sewer and utility work.
China and India are projected to favor portable multi-gas fleets that include local calibration support because sewer and utility programs are widening field workloads. United States and Germany safety teams are expected to place greater weight on bump-test records and service traceability before recurring fleet purchases. Field teams compare sensor ranges and pump options before entry procedures are approved. Procurement teams review dock compatibility and rental turnaround because detector downtime disrupts crew scheduling. China’s State Council reported in June 2026 that about 770,000 km of urban underground pipelines are planned for construction or upgrade during 2026-2030. The work pipeline is expected to widen demand for reliable pre-entry screening and buried leak detection workflows. Approval is forecast to hinge on calibration evidence that survives crew handovers.
| Metric | Value |
|---|---|
| 2025 Market Size | USD 672.2 million |
| 2026 Market Size | USD 720.6 million |
| 2036 Market Size | USD 1,444.2 million |
| Forecast CAGR (2026-2036) | 7.2% |
| Detector Type Focus | Portable Multi-gas Detectors |
| Portable Multi-gas Detectors Share (2026) | 44.0% |
| Gas Detected Focus | Combustible Gases |
| Combustible Gases Share (2026) | 27.0% |
| Sensor Technology Focus | Electrochemical |
| Electrochemical Share (2026) | 36.0% |
| Fastest-growing Country | India |
| India CAGR by 2036 | 9.0% |
Summary of the Trench Gas Detectors Market
| Market Signal | Commercial Impact |
|---|---|
| Demand and Growth Drivers | Field entry rules make detector readiness part of the work plan instead of a stand-alone equipment choice. Utility crews are expected to value fast proof that each monitor is ready before a trench or manhole opens across recurring municipal maintenance programs.
|
| Product and Segment View | Portable multi-gas detectors are expected to remain central because trench hazards often need several measurements before entry. Sensor choice is projected to follow gases named in each site risk assessment.
|
| Geography and Growth Outlook | Country demand is expected to split between infrastructure scale and service discipline. India and China are projected to create more field opportunities while established systems are anticipated to screen vendors through calibration records and local response.
|
| Competitive Landscape | Competition is expected to turn on detector uptime and the ability to prove instrument readiness across many crews. Connected alarm visibility is anticipated to carry more weight where contractors supervise dispersed work fronts.
|
| Analyst Perspective | A trench crew does not get value from a detector that is unavailable when a manhole opens. The commercial edge is expected to come from fleet readiness that keeps bump tests and sensor replacements from delaying entry.
- Nikhil Kaitwade, Principal Consultant at Future Market Insights |
Source: FMI's proprietary forecasting model and primary research
How is the trench gas detectors market segmented?
The trench gas detectors industry is segmented by detector type, gas detected, sensor technology, application, sales channel, and region.
The trench gas detectors market is segmented by detector type, gas detected, sensor technology, application, sales channel, and region. Detector type covers portable multi-gas detectors and area monitors alongside fixed trench sensors and wireless kits. Gas detected covers combustible gases and hydrogen sulfide alongside carbon monoxide, oxygen deficiency or enrichment, and VOC hazards. Sensor technology covers electrochemical and catalytic bead designs alongside infrared, PID, and metal oxide options. Application covers sewer works and utility trenches alongside confined excavations, pipeline repair, and emergency response. Sales channels cover safety distributors and direct OEM routes alongside rental or calibration service. Regional coverage spans seven areas and related gas sensor demand categories.
What supports demand for portable multi-gas detectors within the detector type category?
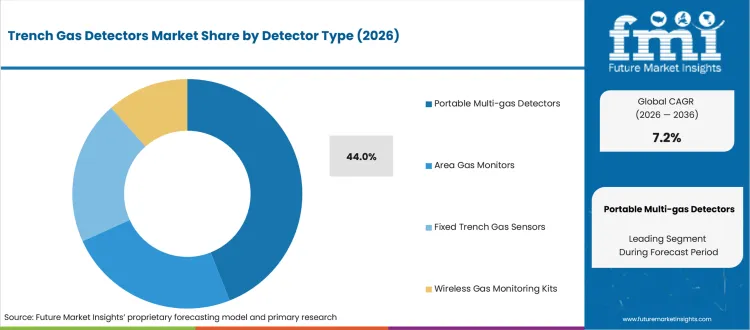
Trench entry often begins before a worker is below grade because crews first sample the atmosphere from the opening or an access point. RKI Instruments introduced the GX-6100 sample-draw monitor in March 2026. The launch keeps pumped multi-gas sampling active in utility and confined-space portfolios. Safety managers are expected to compare pump reach and sensor mix alongside docking support before standardizing a fleet.
- In 2026, portable multi-gas detectors are expected to lead detector type with 44.0% share because one instrument is expected to cover several entry hazards. Honeywell published an updated BW Flex user manual in February 2025 to support dual and exotic toxic gas sensors. The update is expected to reinforce demand for portable units that move from pre-entry checks to crew monitoring.
- Portable multi-gas detectors are drawing demand from sewer crews and utility contractors because work fronts move faster than fixed monitoring points. GfG published a March 2025 gas detection presentation for construction workers and contractors. The presentation ties detector practice directly to field crews. Broader construction worker safety programs are expected to keep detector fleet readiness visible during contractor prequalification.
How is combustible gas monitoring positioned within the gas detected category?
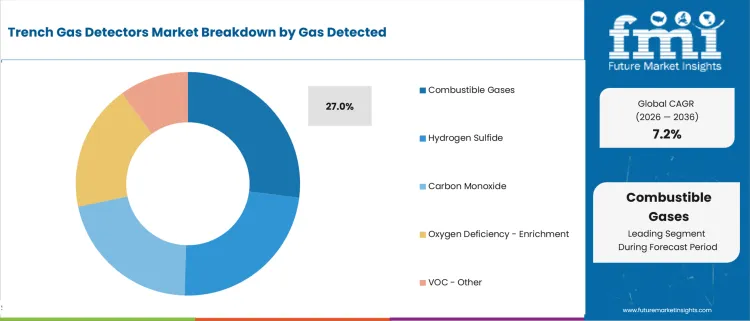
A trench near gas lines or decaying wastewater needs a direct flammability check before workers enter or begin hot work. Industrial Scientific added the MPS LEL sensor to its Radius BZ1 portfolio in January 2026. The addition keeps multi-gas combustible sensing under active product development. Utility safety teams are expected to review response behavior and sensor resistance before approving devices for mixed-gas sites.
- By gas detected, combustible gases are estimated to hold 27.0% share in 2026 due to methane and fuel-gas exposure around buried utilities. Crowcon received FM approval for the XgardIQ fixed gas detector in May 2026. The certification is expected to keep maintenance access and hazardous-location approval visible during detector selection for mixed utility sites.
- Demand for combustible gas detection is expected to grow among pipeline crews and sewer contractors because flammable atmospheres require a clear entry decision. Northumbrian Water selected Blackline Safety connected personal and area monitoring in February 2025 for work at two treatment sites. Enclosed-work planning in tunnel visibility monitoring is projected to keep continuous site awareness visible when teams choose equipment for temporary work zones.
What drives electrochemical sensor demand within the sensor technology category?
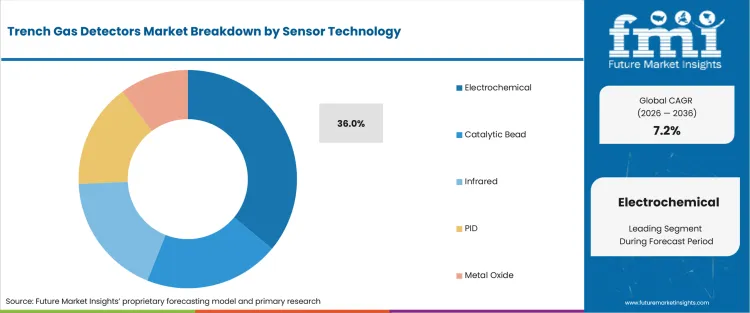
Toxic gas exposure and oxygen balance are checked repeatedly in sewer and telecommunications manholes where air conditions change during daily work. A May 2025 NIOSH health evaluation covered 3 garages and documented use of a 4-gas meter before telecommunications manhole entry. The field procedure is expected to keep compact electrochemical sensing central when crews need carbon monoxide or hydrogen sulfide readings beside other entry checks.
- Electrochemical sensors are projected to lead the sensor technology category with 36.0% share in 2026 due to routine toxic-gas measurement needs. Dräger extended a portable gas detection service contract with INEOS in February 2025. The service scope is expected to keep sensor maintenance and fleet availability tied to purchasing decisions for safety teams that run repeated checks.
- Utility safety teams are expected to favor electrochemical sensing for targeted toxic-gas channels because familiar alarm thresholds simplify field instruction. Teledyne Gas & Flame Detection expanded local manufacturing in Saudi Arabia in June 2025 and included the electrochemical DM-700 detector in the program. Field use of industrial CO sensors is expected to keep electrochemical response and maintenance intervals under review for enclosed infrastructure work.
What are the drivers, restraints, and opportunities in the trench gas detectors market?
Near-term purchases are projected to be shaped by pre-entry air testing and incomplete calibration records. Connected fleet service is anticipated to create the clearest recurring opportunity.
- Driver: Utility and sewer crews are expected to expand portable detector use when entry procedures require atmospheric checks before work begins.
- Restraint: Fleet purchases are projected to slow where calibration ownership is unclear and replacement sensors are unavailable near the job site.
- Opportunity: Connected monitoring and rental calibration programs are anticipated to open recurring service routes for contractors that manage dispersed crews.
Utility crews often move from one excavation to another so detector readiness is expected to become part of daily dispatch planning. Blackline Safety introduced the G8 wearable in January 2026 with multi-gas detection and direct cloud connectivity. The product direction is expected to reinforce demand for equipment that connects field alarms with fleet records. Municipal contractors are projected to place greater weight on devices that prove readiness before a crew loses working time at an open trench.
Calibration gaps create a practical restraint because an alarm is useful only when the instrument has been tested and maintained correctly. OSHA recorded a January 2025 fatal confined-space incident involving a 23,737-gallon rail tank car where atmospheric monitoring was insufficient. The incident record gives safety teams a direct reason to review monitoring procedures and rescue planning together. Purchasing is projected to slow when service responsibility remains unclear between contractors and rental providers.
Connected service models are anticipated to turn fleet records into a commercial opening for manufacturers and rental partners. Industrial Scientific announced a May 2025 rental expansion with Code Red Safety that added 300 Ventis MX4 units and 150 Radius BZ1 monitors. The rental expansion is expected to give contractors faster access to personal and area monitoring during temporary work. Construction wearable technology is projected to widen interest in location context that helps supervisors interpret gas alarms across dispersed crews.
Which country CAGRs are profiled in the trench gas detectors market?
.webp "Top Country Growth Comparison Trench Gas Detectors Market Cagr (2026 2036)")
| Country | CAGR |
|---|---|
| United States | 6.1% |
| China | 8.2% |
| India | 9.0% |
| Germany | 5.7% |
| United Kingdom | 6.4% |
| Japan | 5.3% |
| Australia | 6.7% |
Source: FMI's proprietary forecasting model and primary research
How do country-level CAGRs compare in the trench gas detectors market?
Country outlooks are expected to separate markets where underground utility work is expanding from those where service records shape fleet renewal. India and China are projected to create field opportunities through sewer and pipeline programs. United States and European accounts are anticipated to screen vendors through calibration history and local response. Blackline Safety reported in April 2026 that its fire and hazmat customer base had grown 42% and passed 500 departments worldwide. Australia and Japan are forecast to favor portable equipment for dispersed crews or aging buried infrastructure. Planning for geotechnical monitoring systems is expected to intersect with trench work when ground conditions and worker entry risks are reviewed together.
- OSHA guidance keeps confined-space air testing visible for contractors working around manholes and excavations in the United States. United States demand is projected to grow at 6.1% CAGR through 2036 driven by replacement infrastructure work and formal contractor safety programs. The USA Bureau of Labor Statistics reported in February 2026 that 1,032 construction and extraction workers died on the job in 2024. The toll keeps pre-entry screening and rescue readiness under review for EHS teams. OSHA and municipal utility owners are expected to press rental fleets for calibration records and fast replacement units. Dräger and MSA Safety are anticipated to compete where national service access supports multi-state contractors. The next procurement question is expected to center on how quickly failed monitors return to a ready fleet.
- China’s urban renewal program is moving underground pipeline work into a national infrastructure cycle that creates repeated excavation activity. Municipal utility contractors are expected to need portable monitoring beside gas and sewage network work. Trench gas detector demand in China is forecast to rise at 8.2% CAGR over the forecast period driven by pipeline renewal and local service capacity. The State Council reported in January 2026 that 156,000 km of underground pipelines were built or renovated in 2025. The work volume is expected to widen opportunities for domestic distributors and calibration providers. Ministry of Housing and Urban-Rural Development programs are anticipated to keep documentation tied to urban safety upgrades. Local service depth is forecast to separate manufacturers that only ship instruments from those that support field fleets.
- AMRUT 2.0 is putting sewerage and septage projects into city-level work programs where crews enter manholes and treatment networks. Adoption of trench gas detectors in India is estimated to expand at 9.0% CAGR through 2036 supported by sewer upgrades and formal contractor safety procedures. The Press Information Bureau reported 592 approved sewerage or septage projects under AMRUT 2.0 in March 2025. The project base is expected to create more recurring entry checks for municipal contractors. Urban Local Bodies and EPC contractors are anticipated to compare distributor coverage alongside calibration turnaround. Honeywell and Industrial Scientific are expected to compete where national channel access meets project-based service needs. Fleet availability is forecast to remain the practical test during peak construction periods.
- German wastewater networks place field equipment inside a strict operating environment where municipal utilities document work methods and instrument service. BG BAU and local utility operators are expected to keep contractor safety evidence close to tender review. The Federal Environment Ministry reported in February 2026 that Germany generates more than 5 billion cubic metres of wastewater each year. Trench gas detector demand in Germany is anticipated to advance at 5.7% CAGR over the assessment period driven by wastewater maintenance and documented fleet control. Municipal Stadtwerke are projected to value calibration traceability and support near worksites. Dräger and GfG Instrumentation are expected to benefit from familiar regional service structures. Renewal decisions are forecast to depend on records that remain usable across crews and subcontractors.
- Great Britain’s safety regulator keeps worker fatalities and confined-space guidance visible during contractor planning for utility work. Water utilities and framework contractors are expected to treat detector records as part of job readiness. The United Kingdom trench gas detector sector is projected to record 6.4% CAGR during the assessment period supported by water-network maintenance and rental access. The Health and Safety Executive reported in July 2025 that 124 workers died in work-related incidents during 2024/25. The record is expected to keep safety governance active across outsourced field work. HSE oversight and utility framework contracts are anticipated to favor service partners that document calibration and training. Crowcon and Dräger are expected to compete where local support and portable product depth carry commercial weight. Rental access is forecast to remain useful for short-duration repair campaigns.
- Trench gas detector demand in Japan is forecast to expand at 5.3% CAGR by 2036 driven by aging pipe renewal and methodical equipment approval. Japan’s sewer network is aging beneath dense cities where repair crews often work inside constrained access points and traffic windows. Municipal sewer bureaus are expected to favor compact portable equipment that fits staged entry procedures. MLIT’s January 2026 budget overview reported about 40,000 km of sewer pipes beyond the standard service life. Aging infrastructure is expected to keep inspection and repair work active around confined access points. RKI Instruments and local distribution partners are anticipated to compete on compact sampling tools and dependable service.
- Adoption of trench gas detectors in Australia is estimated to expand at 6.7% CAGR through 2036 supported by utility renewal and mobile contractor fleets. Australia’s dispersed civil work sites create a service challenge because contractor crews often move between cities and remote utility projects. State utilities and civil contractors are expected to value portable fleets with local replacement support. Safe Work Australia reported in October 2025 that 188 workers died from traumatic injuries during 2024. The safety record is expected to keep field risk controls visible during contractor review.
Who are the notable companies in the trench gas detectors market?
Dräger, MSA Safety, Honeywell, Industrial Scientific, RKI Instruments, Teledyne Gas & Flame Detection, Blackline Safety, GfG Instrumentation, Crowcon, and R.C. Systems are the notable companies shaping this market.
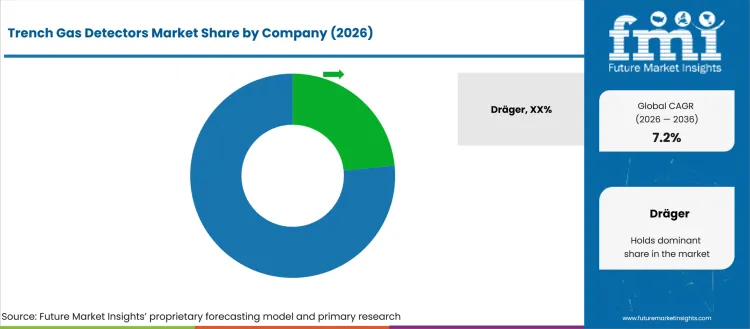
Competition is expected to center on fleet uptime and proof that instruments are ready before a crew enters a trench or manhole. Portable range depth is projected to influence short lists where contractors need toxic gas and combustible gas coverage in one workflow. Service reach is anticipated to carry equal weight because calibration or sensor replacement often removes a unit from daily dispatch. Connected alarm visibility is expected to carry greater weight for dispersed contractors that supervise several work fronts. Selection of respiratory protective equipment is projected to reinforce the same pre-entry focus when crews face gas and oxygen hazards together.
- Calibration and fleet uptime separate Dräger and MSA Safety in accounts that run repeated pre-entry checks. Both pair portable instruments with docking or data systems so safety teams are expected to keep bump-test records and alarms attached to individual devices.
- Industrial Scientific pairs personal and area monitors with the iNet service platform. Blackline Safety links wearable alarms to live cloud services. Utility contractors are projected to compare those workflows when supervisors need remote visibility across several excavation crews and temporary repair sites.
- Honeywell and Teledyne Gas & Flame Detection bring broad gas-sensing portfolios into industrial accounts. Honeywell offers portable multi-gas instruments for confined-space sampling. Teledyne adds personal safety monitors and utility-focused leak detection. Their route is estimated to depend on certification fit and integration with existing detection systems.
- RKI Instruments and GfG Instrumentation compete where access shapes equipment short lists. RKI offers pumped sample-draw tools for pre-entry checks. GfG publishes guidance for construction crews where portable monitoring procedures shape equipment decisions. Crowcon and R.C. Systems are expected to gain review through technical support for utility contractors.
Competitive Benchmarking: Trench Gas Detectors Market
| Company | Portable Multi-gas Fit | Area Monitoring | Calibration Support | Specification Support | Service Reach |
|---|---|---|---|---|---|
| Dräger | High | High | High | High | Global |
| MSA Safety | High | High | High | High | Global |
| Honeywell | High | Medium | High | High | Global |
| Industrial Scientific | High | High | High | High | Global |
| RKI Instruments | High | Medium | High | High | Global |
| Teledyne Gas & Flame Detection | High | Medium | High | High | Global |
| Blackline Safety | Medium | High | High | High | Global |
| GfG Instrumentation | High | Medium | High | High | Global |
| Crowcon | High | High | High | High | Global |
| R.C. Systems | Medium | High | High | Medium | Regional; North America |
Source: Future Market Insights competitive analysis, 2026. Ratings reflect relative portfolio relevance and workflow fit. Service capability and geographic reach shape the remaining comparison.
Key Developments in the Trench Gas Detectors Market
- In September 2025, MSA Safety debuted the ALTAIR io 6 Multigas Detector during the National Safety Congress. The device was presented as a six-gas sampling tool with an integrated pump and cellular connectivity for confined-space work. MSA placed it within the Connected Work Platform beside its wearable detector range.
- In July 2025, Industrial Scientific announced a connected gas monitoring partnership with Gerdau. The program linked Ventis Pro5 personal monitors and Radius BZ1 area monitors to the iNet platform across Gerdau sites. Industrial Scientific reported that detector maintenance time fell from 45 days to 24 working hours.
- In May 2025, Blackline Safety announced that its EXO 8 area monitor was shipping with gamma detection after receiving four product awards. The monitor combines direct-to-cloud area monitoring with detection of up to eight gases and gamma radiation. Blackline positioned the device for multi-threat response settings and industrial work.
- In May 2025, Dräger launched a joint portable gas detection and lone-worker solution with ANT Telecom and Isle Systems in the United Kingdom. The arrangement links Bluetooth-enabled Dräger detectors with a lone-worker application and communications support. ANT Telecom was named as the distribution partner for the UK offering.
Key Players in the Trench Gas Detectors Market
Portable and Connected Gas Detection Manufacturers
- Dräger
- MSA Safety
- Honeywell
- Industrial Scientific
- Blackline Safety
Specialist Gas Detection Manufacturers
- RKI Instruments
- Teledyne Gas & Flame Detection
- GfG Instrumentation
- Crowcon
- R.C. Systems
Trench Gas Detectors Market - Report Scope
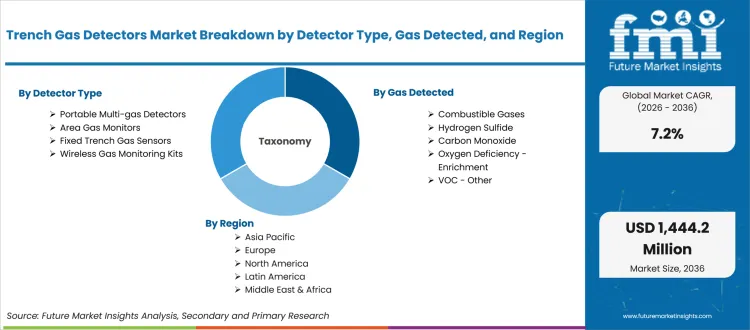
| Coverage field | Report scope |
|---|---|
| Market breakdown | By Detector Type, Gas Detected, Sensor Technology, Application, Sales Channel, and Region |
| Quantitative Units | Revenue in USD Million, CAGR in % |
| Market Definition | Portable and area gas detection equipment used to test trench, manhole, sewer, utility excavation, pipeline repair, and confined excavation atmospheres before or during field work. |
| Regions Covered | North America, Latin America, Europe, East Asia, South Asia, Oceania, and Middle East and Africa |
| Countries Covered | United States, Canada, Brazil, Mexico, Argentina, Germany, United Kingdom, France, Italy, Spain, China, Japan, South Korea, India, Thailand, Indonesia, Australia, New Zealand, GCC countries, South Africa, and Turkey |
| Key Companies Profiled | Dräger, MSA Safety, Honeywell, Industrial Scientific, RKI Instruments, Teledyne Gas & Flame Detection, Blackline Safety, GfG Instrumentation, Crowcon, and R.C. Systems |
| Forecast Period | 2026 to 2036 |
| Approach | Hybrid methodology using bottom-up supplier and channel evidence with top-down checks against infrastructure activity and primary research. |
Source: Future Market Insights - analysis driven by proprietary forecasting models and primary research
Trench Gas Detectors Market - Research Methodology
| Method | Approach |
|---|---|
| Primary Research | Primary interviews cover EHS managers and utility operations teams alongside confined-space contractors and rental fleet managers. Interview guides examine pre-entry sampling and bump-test routines before moving to brand choice. Researchers compare service expectations across owners and users so purchasing behavior reflects field routines. Distributor feedback helps test replacement needs and the practical value of local calibration support. |
| Desk Research | Desk research reviews safety guidance and infrastructure programs alongside product portfolios and service-channel information. Researchers check whether each application creates a direct atmospheric monitoring need before it enters the forecast. Adjacent categories are included only when the operating mechanism supports trench or confined-space gas detection. Evidence is organized by application and country before it is compared with interview findings. |
| Market Sizing and Forecasting | Market sizing starts with relevant detector portfolios and channel activity before estimates are reconciled against application workloads and infrastructure programs. Segment shares are cross-checked against detector use and gas-hazard coverage. Country growth assumptions are triangulated with excavation activity and service-channel depth. |
| Data Validation | Data validation compares interview findings with product availability and work-program evidence before estimates are accepted. Company relevance is checked against current product portfolios and active service coverage. Forecast outputs are reviewed for value consistency and segment alignment before the article is formatted. |
Source: Future Market Insights (FMI) analysis, based on proprietary forecasting model and primary research
Trench Gas Detectors Market by Segments
Trench Gas Detectors Market segmented by Detector Type:
- Portable Multi-gas Detectors
- Area Gas Monitors
- Fixed Trench Gas Sensors
- Wireless Gas Monitoring Kits
Trench Gas Detectors Market segmented by Gas Detected:
- Combustible Gases
- Hydrogen Sulfide
- Carbon Monoxide
- Oxygen Deficiency / Enrichment
- VOC / Other
Trench Gas Detectors Market segmented by Sensor Technology:
- Electrochemical
- Catalytic Bead
- Infrared
- PID
- Metal Oxide
Trench Gas Detectors Market segmented by Application:
- Sewer Works
- Utility Trenches
- Confined Excavations
- Pipeline Repair
- Emergency Response
Trench Gas Detectors Market segmented by Sales Channel:
- Safety Equipment Distributors
- Direct OEM
- Rental / Calibration Service
Trench Gas Detectors Market by Region:
- North America
- United States
- Canada
- Latin America
- Brazil
- Mexico
- Argentina
- Europe
- Germany
- United Kingdom
- France
- Italy
- Spain
- East Asia
- China
- Japan
- South Korea
- South Asia
- India
- Thailand
- Indonesia
- Oceania
- Australia
- New Zealand
- Middle East and Africa
- GCC countries
- South Africa
- Turkey
Research Sources and Bibliography
- USA Bureau of Labor Statistics. (2026, February). Census of Fatal Occupational Injuries Summary, 2024. USA Department of Labor.
- State Council of the People’s Republic of China. (2026, June). China to build, upgrade 770,000 km of urban underground pipelines during 2026-2030. The State Council.
- State Council of the People’s Republic of China. (2026, January). China spends big on urban renewal in 2025. The State Council.
- Press Information Bureau. (2025, March). UPGRADATION OF STPs. Government of India.
- Federal Ministry for the Environment, Climate Action, Nature Conservation and Nuclear Safety. (2026, February). Waste water. Federal Ministry for the Environment, Climate Action, Nature Conservation and Nuclear Safety.
- Health and Safety Executive. (2025, July). Latest annual work-related fatalities published. Health and Safety Executive.
- Safe Work Australia. (2025, October). Key Work Health and Safety Statistics Australia 2025 now available. Safe Work Australia.
- National Institute for Occupational Safety and Health. (2025, May). Health Hazard Evaluation Report 2024-0046-3413. Centers for Disease Control and Prevention.
- Occupational Safety and Health Administration. (2025, September). September 22, 2025. USA Department of Labor.
- Occupational Safety and Health Administration. (2025, January). Accident Report Detail. USA Department of Labor.
- MSA Safety. (2025, September). MSA Safety Debuts Two New Safety Solutions at National Safety Congress. MSA Safety.
- Industrial Scientific. (2026, January). Industrial Scientific Expands Area Monitoring Portfolio with MPS™ LEL Sensor. Industrial Scientific.
- Industrial Scientific. (2025, July). Industrial Scientific and Gerdau Forge Safety-Focused Partnership with Connected Gas Monitoring Solutions. Industrial Scientific.
- Blackline Safety. (2025, May). Blackline Safety Wins Four Prestigious Awards for New Area Monitor. Blackline Safety.
- Dräger. (2025, February). Draeger UK secures contract extension with INEOS O&P UK, Grangemouth. Dräger.
- Dräger. (2025, May). Draeger Safety UK partners with ANT Telecom and Isle Systems to launch a lone worker portable gas detection solution. Dräger.
- RKI Instruments. (2026, March). Announcing the GX-6100 - Six Gas Sample Draw Monitor. RKI Instruments.
- Blackline Safety. (2026, February). Italian Fire Brigade Chooses Blackline Safety to Keep Athletes, Public Safe During Winter Olympics. Blackline Safety.
- Blackline Safety. (2025, September). Blackline Safety Secures $1.8M Contract with Major Californian Water Utility. Blackline Safety.
- Crowcon Detection Instruments. (2025, September). Crowcon launches new IQ range of connected portable gas detectors. Crowcon.
- Det-Tronics. (2025, June). Det-Tronics Acquires Texas based R.C. Systems. Det-Tronics.
- Honeywell. (2025, February). Honeywell BW™ Flex - User Manual. Honeywell.
- GfG Instrumentation. (2025, March). Gas Detection for Construction Workers and Contractors. GfG Gas Detection.
- Crowcon Detection Instruments. (2026, May). Crowcon’s XgardIQ fixed gas detector now FM approved. Crowcon.
- Blackline Safety. (2025, February). Northumbrian Water Selects Blackline Safety to Safeguard Workers, Identify Risks. Blackline Safety.
- Teledyne Gas & Flame Detection. (2025, June). Teledyne GFD Partners with Industrial Detection Solutions to Establish Manufacturing in KSA. Teledyne Gas & Flame Detection.
- Blackline Safety. (2026, January). Blackline Safety Introduces G8-The Most Connected Safety Wearable Ever Made. Blackline Safety.
- Industrial Scientific. (2025, May). Code Red Safety to Expand Rental Offerings with Industrial Scientific in $1 Million Deal. Industrial Scientific.
- Blackline Safety. (2026, April). Blackline Safety Fire-Hazmat Customer Base Grows 42%, Surpassing 500 Departments Globally. Blackline Safety.
- Pipeline and Hazardous Materials Safety Administration. (2025, January). USDOT Advances Rule to Modernize Gas Pipeline Methane Emissions Detection Requirements. USA Department of Transportation.
- Industrial Scientific. (2025, September). Industrial Scientific, Total Safety Continue Partnership with $1.6 Million Deal. Industrial Scientific.
- Crowcon Detection Instruments. (2026, February). Crowcon Strengthens North American Coverage with MES Life Safety Partnership. Crowcon.
- Occupational Safety and Health Administration. (2026, April). US Department of Labor cites construction contractor with 7 willful, 33 repeat violations after fatal Yarmouth cave-in. USA Department of Labor.
- Crowcon Detection Instruments. (2026, April). Crowcon’s DuoIQ wins Internationally recognised Red Dot Award. Crowcon.
This bibliography is provided for reader reference and uses primary government, standards-body, official trade body, and company sources.
This Report Answers
- What is the trench gas detectors market estimated to be worth in 2026 and forecast to reach by 2036?
- What CAGR is the trench gas detectors market projected to record from 2026 to 2036?
- Which segments are expected to shape demand across detector type and the other profiled parent categories?
- Which worksite pressures are projected to support trench gas detector adoption and recurring fleet purchases?
- How are country CAGRs expected to differ across the seven profiled national markets?
- Which companies compete on portable fit and service reach across the profiled competitive set?
- What should safety managers and utility operations teams address before wider fleet expansion or a longer sourcing commitment?
- How are calibration records and entry procedures expected to affect vendor selection under current safety rules?
Frequently Asked Questions
What is driving growth in the Trench Gas Detectors Market?
Growth is expected to be driven by stricter confined-space entry checks and expanded sewer or utility work. Connected monitoring is projected to support fleet renewal.
Who are the key players in the Trench Gas Detectors Market?
Notable companies include Dräger, MSA Safety, Honeywell, Industrial Scientific, and Blackline Safety. Competition is projected to center on calibration support and connected monitoring.
What is a significant restraint in the Trench Gas Detectors Market?
A significant restraint is incomplete calibration records and unclear service ownership. Adoption is anticipated to slow when safety teams cannot verify detector readiness.
Why should executives track the Trench Gas Detectors Market?
Executives should track the market because detector readiness affects work scheduling and safety accountability. Fleet service quality is expected to influence recurring purchase decisions.
What business problem does the Trench Gas Detectors Market address?
The market addresses the need to identify hazardous atmospheres before and during trench entry. Detectors help crews verify oxygen and gas conditions before work proceeds.
What should procurement leaders evaluate before selecting suppliers?
Procurement leaders should evaluate sensor coverage and calibration support before selecting suppliers. Service response and replacement availability are expected to shape fleet continuity.
What limits return on investment for purchasers?
Return on investment is estimated to weaken when detectors remain unavailable during calibration or repair. Poor fleet records are anticipated to increase downtime and replacement uncertainty.
How do suppliers build long-term account confidence?
Suppliers build account confidence through dependable calibration support and clear detector readiness records. Fast replacement service is expected to support repeat purchasing across dispersed crews.
Preview the report firsthand - request a free sample
Get SampleGet the brochure for pricing and purchase details.
Get PDFTable of Content
- Key Takeaways
- Market Size and CAGR
- Top Growth Driver
- Fastest Growing Segment
- Leading Region
- Key Companies
- Emerging Opportunities
- Executive Summary
- Global Market Outlook
- Demand-side Trends
- Supply-side Trends
- Technology Roadmap Analysis
- Analysis and Recommendations
- Analyst Perspective (What is happening? Why now? What should investors know?)
- Key Questions Answered
- How large is the market?
- What is the CAGR?
- What are key trends?
- Which region dominates?
- Who are the leaders?
- Market Overview
- Market Coverage / Taxonomy
- Market Definition / Scope / Limitations
- Research Methodology
- Chapter Orientation
- Analytical Lens and Working Hypotheses
- Market Structure, Signals, and Trend Drivers
- Benchmarking and Cross-market Comparability
- Market Sizing, Forecasting, and Opportunity Mapping
- Research Design and Evidence Framework
- Desk Research Programme (Secondary Evidence)
- Expert Input and Fieldwork (Primary Evidence)
- Tooling, Models, and Reference Databases
- Data Engineering and Model Build
- Quality Assurance and Audit Trail
- Market Background
- Market Dynamics (Drivers, Restraints, Opportunity, Trends)
- Scenario Forecast (Optimistic, Likely, Conservative)
- Impact Analysis
- AI Impact
- Sustainability Impact
- Regulatory Impact
- Technology Impact
- Consumer / Buyer Analysis
- Purchase Drivers
- Adoption Barriers
- Buyer Journey
- Opportunity Map Analysis
- Product Life Cycle Analysis
- Supply Chain Analysis
- Investment Feasibility Matrix
- Value Chain Analysis
- PESTLE and Porter's Analysis
- Regulatory Landscape
- Regional Parent Market Outlook
- Production and Consumption Statistics
- Import and Export Statistics
- Global Market Analysis and Forecast, 2021 to 2036
- Historical Market Size Value (USD Million) & Volume (Units) Analysis, 2021 to 2025
- Current and Future Market Size Value (USD Million) & Volume (Units) Projections, 2026 to 2036
- Y-o-Y Growth Trend Analysis
- Absolute $ Opportunity Analysis
- Global Market Pricing Analysis, 2021 to 2036
- Global Market Analysis and Forecast, By Detector Type, 2021 to 2036
- Introduction / Key Findings
- Historical Market Size Value (USD Million) & Volume (Units) Analysis By Detector Type, 2021 to 2025
- Current and Future Market Size Value (USD Million) & Volume (Units) Analysis and Forecast By Detector Type, 2026 to 2036
- Portable Multi-gas Detectors
- Area Gas Monitors
- Fixed Trench Gas Sensors
- Wireless Gas Monitoring Kits
- Portable Multi-gas Detectors
- Y-o-Y Growth Trend Analysis By Detector Type, 2021 to 2025
- Absolute $ Opportunity Analysis By Detector Type, 2026 to 2036
- Global Market Analysis and Forecast, By Gas Detected, 2021 to 2036
- Introduction / Key Findings
- Historical Market Size Value (USD Million) & Volume (Units) Analysis By Gas Detected, 2021 to 2025
- Current and Future Market Size Value (USD Million) & Volume (Units) Analysis and Forecast By Gas Detected, 2026 to 2036
- Combustible Gases
- Hydrogen Sulfide
- Carbon Monoxide
- Oxygen Deficiency - Enrichment
- VOC - Other
- Combustible Gases
- Y-o-Y Growth Trend Analysis By Gas Detected, 2021 to 2025
- Absolute $ Opportunity Analysis By Gas Detected, 2026 to 2036
- Global Market Analysis and Forecast, By Sensor Technology, 2021 to 2036
- Introduction / Key Findings
- Historical Market Size Value (USD Million) & Volume (Units) Analysis By Sensor Technology, 2021 to 2025
- Current and Future Market Size Value (USD Million) & Volume (Units) Analysis and Forecast By Sensor Technology, 2026 to 2036
- Electrochemical
- Catalytic Bead
- Infrared
- PID
- Metal Oxide
- Electrochemical
- Y-o-Y Growth Trend Analysis By Sensor Technology, 2021 to 2025
- Absolute $ Opportunity Analysis By Sensor Technology, 2026 to 2036
- Global Market Analysis and Forecast, By Application, 2021 to 2036
- Introduction / Key Findings
- Historical Market Size Value (USD Million) & Volume (Units) Analysis By Application, 2021 to 2025
- Current and Future Market Size Value (USD Million) & Volume (Units) Analysis and Forecast By Application, 2026 to 2036
- Sewer Works
- Utility Trenches
- Confined Excavations
- Pipeline Repair
- Emergency Response
- Sewer Works
- Y-o-Y Growth Trend Analysis By Application, 2021 to 2025
- Absolute $ Opportunity Analysis By Application, 2026 to 2036
- Global Market Analysis and Forecast, By Sales Channel, 2021 to 2036
- Introduction / Key Findings
- Historical Market Size Value (USD Million) & Volume (Units) Analysis By Sales Channel, 2021 to 2025
- Current and Future Market Size Value (USD Million) & Volume (Units) Analysis and Forecast By Sales Channel, 2026 to 2036
- Safety Equipment Distributors
- Direct OEM
- Rental - Calibration Service
- Safety Equipment Distributors
- Y-o-Y Growth Trend Analysis By Sales Channel, 2021 to 2025
- Absolute $ Opportunity Analysis By Sales Channel, 2026 to 2036
- Global Market Analysis and Forecast, By Region, 2021 to 2036
- Introduction
- Historical Market Size Value (USD Million) & Volume (Units) Analysis By Region, 2021 to 2025
- Current Market Size Value (USD Million) & Volume (Units) Analysis and Forecast By Region, 2026 to 2036
- North America
- Latin America
- Europe
- East Asia
- South Asia
- Oceania
- Middle East and Africa
- Market Attractiveness Analysis By Region
- North America Market Analysis and Forecast, By Country, 2021 to 2036
- Historical Market Size Value (USD Million) & Volume (Units) Trend Analysis By Market Taxonomy, 2021 to 2025
- Market Size Value (USD Million) & Volume (Units) Forecast By Market Taxonomy, 2026 to 2036
- By Country
- United States
- Canada
- By Detector Type
- By Gas Detected
- By Sensor Technology
- By Application
- By Sales Channel
- By Country
- Market Attractiveness Analysis
- By Country
- By Detector Type
- By Gas Detected
- By Sensor Technology
- By Application
- By Sales Channel
- Key Takeaways
- Latin America Market Analysis and Forecast, By Country
- Historical Market Size Value (USD Million) & Volume (Units) Trend Analysis By Market Taxonomy, 2021 to 2025
- Market Size Value (USD Million) & Volume (Units) Forecast By Market Taxonomy, 2026 to 2036
- By Country
- Brazil
- Mexico
- Argentina
- By Detector Type
- By Gas Detected
- By Sensor Technology
- By Application
- By Sales Channel
- By Country
- Market Attractiveness Analysis
- By Country
- By Detector Type
- By Gas Detected
- By Sensor Technology
- By Application
- By Sales Channel
- Key Takeaways
- Europe Market Analysis and Forecast, By Country
- Historical Market Size Value (USD Million) & Volume (Units) Trend Analysis By Market Taxonomy, 2021 to 2025
- Market Size Value (USD Million) & Volume (Units) Forecast By Market Taxonomy, 2026 to 2036
- By Country
- Germany
- United Kingdom
- France
- Italy
- Spain
- By Detector Type
- By Gas Detected
- By Sensor Technology
- By Application
- By Sales Channel
- By Country
- Market Attractiveness Analysis
- By Country
- By Detector Type
- By Gas Detected
- By Sensor Technology
- By Application
- By Sales Channel
- Key Takeaways
- East Asia Market Analysis and Forecast, By Country
- Historical Market Size Value (USD Million) & Volume (Units) Trend Analysis By Market Taxonomy, 2021 to 2025
- Market Size Value (USD Million) & Volume (Units) Forecast By Market Taxonomy, 2026 to 2036
- By Country
- China
- Japan
- South Korea
- By Detector Type
- By Gas Detected
- By Sensor Technology
- By Application
- By Sales Channel
- By Country
- Market Attractiveness Analysis
- By Country
- By Detector Type
- By Gas Detected
- By Sensor Technology
- By Application
- By Sales Channel
- Key Takeaways
- South Asia Market Analysis and Forecast, By Country
- Historical Market Size Value (USD Million) & Volume (Units) Trend Analysis By Market Taxonomy, 2021 to 2025
- Market Size Value (USD Million) & Volume (Units) Forecast By Market Taxonomy, 2026 to 2036
- By Country
- India
- Thailand
- Indonesia
- By Detector Type
- By Gas Detected
- By Sensor Technology
- By Application
- By Sales Channel
- By Country
- Market Attractiveness Analysis
- By Country
- By Detector Type
- By Gas Detected
- By Sensor Technology
- By Application
- By Sales Channel
- Key Takeaways
- Oceania Market Analysis and Forecast, By Country
- Historical Market Size Value (USD Million) & Volume (Units) Trend Analysis By Market Taxonomy, 2021 to 2025
- Market Size Value (USD Million) & Volume (Units) Forecast By Market Taxonomy, 2026 to 2036
- By Country
- Australia
- New Zealand
- By Detector Type
- By Gas Detected
- By Sensor Technology
- By Application
- By Sales Channel
- By Country
- Market Attractiveness Analysis
- By Country
- By Detector Type
- By Gas Detected
- By Sensor Technology
- By Application
- By Sales Channel
- Key Takeaways
- Middle East and Africa Market Analysis and Forecast, By Country
- Historical Market Size Value (USD Million) & Volume (Units) Trend Analysis By Market Taxonomy, 2021 to 2025
- Market Size Value (USD Million) & Volume (Units) Forecast By Market Taxonomy, 2026 to 2036
- By Country
- GCC countries
- South Africa
- Turkey
- By Detector Type
- By Gas Detected
- By Sensor Technology
- By Application
- By Sales Channel
- By Country
- Market Attractiveness Analysis
- By Country
- By Detector Type
- By Gas Detected
- By Sensor Technology
- By Application
- By Sales Channel
- Key Takeaways
- Key Countries Market Analysis
- United States
- Pricing Analysis
- Market Share Analysis, 2025
- By Detector Type
- By Gas Detected
- By Sensor Technology
- By Application
- By Sales Channel
- China
- Pricing Analysis
- Market Share Analysis, 2025
- By Detector Type
- By Gas Detected
- By Sensor Technology
- By Application
- By Sales Channel
- India
- Pricing Analysis
- Market Share Analysis, 2025
- By Detector Type
- By Gas Detected
- By Sensor Technology
- By Application
- By Sales Channel
- Germany
- Pricing Analysis
- Market Share Analysis, 2025
- By Detector Type
- By Gas Detected
- By Sensor Technology
- By Application
- By Sales Channel
- United Kingdom
- Pricing Analysis
- Market Share Analysis, 2025
- By Detector Type
- By Gas Detected
- By Sensor Technology
- By Application
- By Sales Channel
- Japan
- Pricing Analysis
- Market Share Analysis, 2025
- By Detector Type
- By Gas Detected
- By Sensor Technology
- By Application
- By Sales Channel
- Australia
- Pricing Analysis
- Market Share Analysis, 2025
- By Detector Type
- By Gas Detected
- By Sensor Technology
- By Application
- By Sales Channel
- United States
- Market Structure Analysis
- Competition Dashboard
- Competition Benchmarking
- Market Share Analysis of Top Players
- By Regional
- By Detector Type
- By Gas Detected
- By Sensor Technology
- By Application
- By Sales Channel
- Emerging Startups
- Innovation Benchmarking
- Competition Analysis
- Competition Deep Dive
- Dräger
- Overview
- Product Portfolio
- Profitability by Market Segments (Product/Region/Sales Channel)
- Sales Footprint
- Strategy Overview
- Marketing Strategy
- Product Strategy
- Channel Strategy
- MSA Safety
- Honeywell
- Industrial Scientific
- RKI Instruments
- Teledyne Gas & Flame Detection
- Blackline Safety
- GfG Instrumentation
- Crowcon
- R.C. Systems
- Dräger
- Case Studies
- Success Stories
- Recent Developments
- Competition Deep Dive
- Assumptions & Acronyms Used


