Trigger Spray Bottle Market Size and Share Forecast Outlook 2025 to 2035

The global trigger spray bottle market is projected to grow from USD 2.6 billion in 2025 to USD 4.2 billion by 2035, registering a CAGR of 4.9% over the forecast period. Sales in 2024 were recorded at USD 2.5 billion.
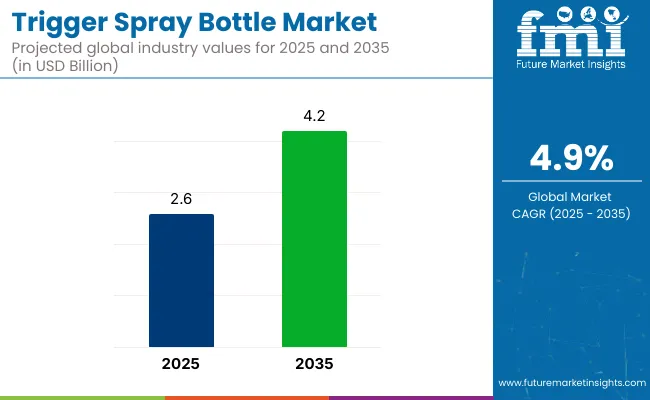
Quick Stats of Trigger Spray Bottle Market

  • Market Value (2025): USD 2.6 billion
  • Forecast Value (2035): USD 4.2 billion
  • Forecast CAGR: 4.9%
  • Material Leader in 2025: Polyethylene (PE) (34.7% market share)
  • Top End Use: Homecare (36.2% share)
  • Key Growth Country: Latin America (Mexico is the fastest-growing market with 7.0% CAGR)

Trigger Spray Bottle Market

Metric Value (USD)
Industry Size (2025E) USD 2.6 billion
Industry Value (2035F) USD 4.2 billion
CAGR (2025 to 2035) 4.9%

This growth is primarily attributed to the increasing demand for convenient and efficient dispensing solutions in household cleaning, personal care, automotive, and gardening applications. Trigger spray bottles offer controlled dispensing, ergonomic design, and reusability, making them a preferred choice for both consumers and industries seeking sustainable packaging options.

In April 2025, Amcor plc announced the completion of its transformational merger with Berry Global Group, Inc. This strategic combination aims to enhance Amcor's positions in attractive categories, broaden its customer offerings, and expand material science and innovation capabilities. "Today is a defining day for Amcor as we closed our transformational merger with Berry Global.

Through this combination, Amcor has enhanced positions in attractive categories, a broader, more complete customer offering and expanded material science and innovation capabilities," stated Peter Konieczny, CEO of Amcor. This merger is expected to bolster Amcor's position in the trigger spray bottle market by integrating Berry Global's specialized technology and expanding their reach in the industry.

Recent innovations in trigger spray bottle design have led to significant improvements in product functionality and customization. Manufacturers have focused on developing high-quality, secure, and durable dispensing solutions that cater to the specific needs of various industries.

Advancements in nozzle technology have enabled adjustable spray patterns, leak-proof mechanisms, and enhanced user comfort. Additionally, the integration of eco-friendly materials and sustainable practices has improved the environmental footprint of trigger spray bottles.

The trigger spray bottle market is expected to witness significant growth in emerging economies, particularly in the Asia-Pacific region, due to rapid urbanization and increasing consumer awareness. Applications are expanding beyond traditional sectors, with growing adoption in personal care, automotive, and industrial cleaning industries. Manufacturers are anticipated to focus on developing cost-effective and versatile dispensing solutions to cater to diverse consumer needs and comply with evolving environmental regulations.

Analyzing Trigger Spray Bottle Market by Top Investment Segment

The market has been segmented based on material, capacity, end use, and region. Materials such as polyethylene terephthalate (PET), polyethylene (PE), high-density polyethylene (HDPE), low-density polyethylene (LDPE), polyvinyl chloride (PVC), and polypropylene (PP) have been used to achieve durability, chemical compatibility, and recyclability.

Capacity ranges including up to 100 ml, 100 ml to 250 ml, and above 250 ml have been defined to support household, commercial, and industrial spray applications. End-use sectors have been categorized into food & beverage, agriculture, pharmaceutical, cosmetic & personal care, homecare, and chemicals, where precise dispensing and hygienic packaging are essential.

Regional segmentation has been structured to include North America, Latin America, East Asia, South Asia & Pacific, Eastern Europe, Western Europe, Oceania, and the Middle East & Africa to capture varying regulatory compliance and market penetration levels.
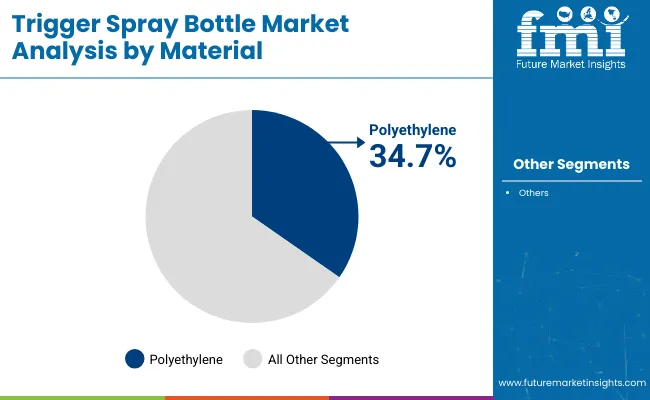
Polyethylene Material Preferred for Its Flexibility and Chemical Resistance

Trigger Spray Bottle Market Analysis By Material

The polyethylene (PE) segment is expected to hold 34.7% of the trigger spray bottle market share in 2025, driven by its suitability for molding, durability, and compatibility with a wide range of liquids. PE bottles have been widely used for surface cleaners, disinfectants, and air fresheners due to their impact resistance and cost efficiency.

High-density and low-density variants have been utilized for different viscosity and dispensing needs. Packaging performance under repeated use and variable temperatures has been maintained through robust material properties. Nozzles and closures have been securely integrated with PE bottles to prevent leakage and maintain spray accuracy.

Color matching and surface texture customization have been enabled to support brand identity. Lightweight transport and damage resistance have further enhanced their utility in retail and e-commerce. PE’s widespread production and reliable function have sustained its dominance in the trigger bottle format.
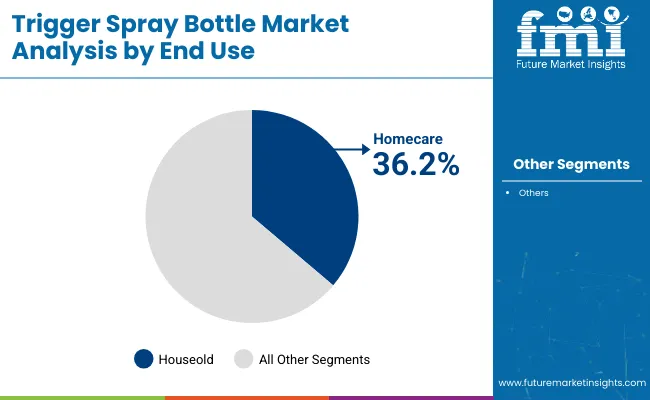
Homecare Segment Leads with High-Frequency Use and Diverse Product Applications

Trigger Spray Bottle Market Analysis By End Use

The homecare segment is projected to account for 36.2% of the trigger spray bottle market in 2025, as strong demand has been noted across household cleaning and air care products. Trigger bottles have been implemented for glass cleaners, disinfecting sprays, and fabric refreshers in daily consumer routines. Ergonomic design and easy dispensing mechanisms have improved product handling and storage in domestic settings.

Refillability and extended usability have been emphasized in multipurpose spray formats. Varied nozzle types such as fine mist, foam, and stream have been utilized to support different cleaning tasks and preferences. Label-friendly surfaces and shelf-ready shapes have facilitated marketability through offline and online retail channels.

Batch packaging and tamper-evident features have been applied for high-volume SKUs. Continued dominance has been anticipated as home hygiene awareness and convenience purchasing patterns remain elevated.

Challenges and Opportunities

Challenges

Plastic Regulation, Cost Sensitivity, and Compatibility

Under new global sustainability frameworks, trigger spray bottles, which are plastic-intensive, will be scrutinized by regulators. Viscous / chemically aggressive liquids (bleach, oils) may be incompatible with trigger flagging performance degradation, leakage or failure. The high resin prices combined with import tariffs and global supply chain disruptions may further affect availability and cost-efficiency, especially for low-margin applications.

Opportunities

Sustainable Innovation, Customization, and Reusability

There is also opportunity for recyclable, biodegradable and compostable materials, and mono-polymer trigger assemblies that aid in recycling after use. Custom branding, color-coding and ergonomic enhancements that deliver value for private label and DTC (direct-to-consumer) players are also driving growth. The movement toward refillable household products, zero-waste packaging and subscription-based cleaning kits is carving out a new premium segment in the trigger spray category.

Country-wise Outlook

United States

The USA trigger spray bottle market stands at 2.4 million units, growing at a decent pace, mired by strong consumer demand from household cleaning, personal care, and industrial sectors. They are most commonly used in trigger sprayers for surface disinfectants, pest control solutions, salon products, dancing, and gardening sprays.

Innovation driven by consumer preference towards ergonomic, refillable and adjustable-nozzle designs. Sustainable initiatives are pushing on brands to use recyclable plastics, and minimize material use via light-weight designs. Manufacturing automation and smart packaging integration are enhancing production efficiency and user friendliness.

Country CAGR (2025 to 2035)
United States 5.1%

United Kingdom

The UK trigger spray bottle market is growing steadily with the rising demand for eco-friendly packaging in cleaning chemical, pet care, and personal hygiene products. Product design is being influenced by a trend in concentrated refill formats and reusable trigger heads.

The material innovation is being driven by private-label brands and sustainability-oriented startups, especially with recyclable PET and post-consumer recycled content. Pressure from regulators to eliminate single-use plastics is further compounded by advancements being made in durable, multi-use trigger mechanisms in both retail and institutional environments.

Country CAGR (2025 to 2035)
United Kingdom 4.7%

European Union

The EU trigger spray bottle market was led by Germany while France and Italy held the second and third place respectively due to high environmental standards and sufficient manufacturing potential. It is widely used in household care, automotive detailing, and horticulture applications, which benefits the overall market.

Policies in the EU to support circular packaging and bans on different single-use plastics are driving the uptake of mono-material spray systems and bio-based resins. For commercial use (professional grade cleaning, agricultural), industrial players are investing in durable trigger mechanisms and anti-clogging nozzles.

Region CAGR (2025 to 2035)
European Union 4.8%

Japan

Japanese trigger spray bottle market in driven by precision dispensing, compact designs, and aesthetically refined packaging, especially in the personal care and home segment. Japanese consumers prefer quiet, low-force triggers and simple packaging that adheres to space-saving principles.

New airless spray innovations and refillable cartridge formats are seeing increased adoption. Sustainability measures are also shaping material selections, with brands using plant-based plastics and recyclable packaging to align with consumer demand and regulatory pressure.

Country CAGR (2025 to 2035)
Japan 4.5%

South Korea

The trigger spray bottle market in South Korea is seeing healthy growth due to demand in k-beauty, home care and disinfectant product segments. Sleeve bottles with compact and sleek designs, plus customizable spray patterns, are popular in cosmetic and lifestyle brands.

Automation and smart mold technologies are being adopted by domestic manufacturers to enhance production quality and cut cycle times. As buyers become more sustainability-conscious, triggering reuse packaging and reuse models are gaining traction in the eco-conscious urban shopper segment.

Country CAGR (2025 to 2035)
South Korea 5.2%

Competitive Outlook

The trigger spray bottle market has been demonstrating steady growth primarily owing to increasing demand across various applications such as household cleaning, personal care, automotive and agriculture. Manual dispense bottles are commonly applied in a wide range of industrial and consumer applications as they provide accurate dispensing, easy grip and refill features.

The shift to sustainable packaging, increase in usage of disinfectants and surface cleaners, rise of private-label homecare brands, and development of spill free and 360° spray technologies are among the key market drivers.

Key Companies

  • Sabotcastle Limited
  • MUS Packaging
  • Klager Plastik GmbH
  • Berry Global Group
  • Amcor plc
  • DEMAREIS GmbH
  • Frapak Packaging
  • Tolco Corporation
  • PB Packaging (A Tricorbraun Company)
  • C.L.Smith
  • Pretium Packaging

Key Segmentation

By Material Type:

  • Polyethylene terephthalate (PET)
  • Polyethylene(PE)
    • High- Density Polyethylene(HDPE)
    • Low- Density Polyethylene(LDPE)
  • Polyvinyl chloride(PVC)
  • Polypropylene(PP)

By Capacity:

  • Upto 100 ml
  • 100 ml to 250 ml
  • Above 250 ml

By End-Use Industry:

  • Food & Beverage
  • Agriculture
  • Pharmaceutical
  • Cosmetic & Personal Care
  • Homecare
  • Chemicals

By Region:

  • North America
  • Latin America
  • Europe
  • East Asia
  • South Asia
  • Oceania
  • MEA

Table of Content

  1. Executive Summary
    • Global Market Outlook
    • Demand-side Trends
    • Supply-side Trends
    • Technology Roadmap Analysis
    • Analysis and Recommendations
  2. Market Overview
    • Market Coverage/Taxonomy
    • Market Definition/Scope/Limitations
  3. Market Background
    • Market Dynamics
      • Drivers
      • Restraints
      • Opportunity
      • Trends
    • Scenario Forecast
      • Demand in Optimistic Scenario
      • Demand in Likely Scenario
      • Demand in Conservative Scenario
    • Opportunity Map Analysis
    • Product Life Cycle Analysis
    • Supply Chain Analysis
      • Supply Side Participants and their Roles
        • Producers
        • Mid-Level Participants (Traders/ Agents/ Brokers)
        • Wholesalers and Distributors
      • Value Added and Value Created at Node in the Supply Chain
      • List of Raw Material Suppliers
      • List of Existing and Potential Buyer’s
    • Investment Feasibility Matrix
    • Value Chain Analysis
      • Profit Margin Analysis
      • Wholesalers and Distributors
      • Retailers
    • PESTLE and Porter’s Analysis
    • Regulatory Landscape
      • By Key Regions
      • By Key Countries
    • Regional Parent Market Outlook
    • Production and Consumption Statistics
    • Import and Export Statistics
  4. Global Market Analysis 2020 to 2024 and Forecast, 2025 to 2035
    • Historical Market Size Value (USD Billion) & Volume (Units) Analysis, 2020 to 2024
    • Current and Future Market Size Value (USD Billion) & Volume (Units) Projections, 2025 to 2035
      • Y-o-Y Growth Trend Analysis
      • Absolute $ Opportunity Analysis
  5. Global Market Pricing Analysis 2020 to 2024 and Forecast 2025 to 2035
  6. Global Market Analysis 2020 to 2024 and Forecast 2025 to 2035, By Material
    • Introduction/Key Findings
    • Historical Market Size Value (USD Billion) & Volume (Units) Analysis By Material, 2020 to 2024
    • Current and Future Market Size Value (USD Billion) & Volume (Units) Analysis and Forecast By Material, 2025 to 2035
      • Polyethylene terephthalate (PET)
      • Polyethylene(PE)
        • High- Density Polyethylene(HDPE)
        • Low- Density Polyethylene(LDPE)
      • Polyvinyl chloride(PVC)
      • Polypropylene(PP)
    • Y-o-Y Growth Trend Analysis By Material, 2020 to 2024
    • Absolute $ Opportunity Analysis By Material, 2025 to 2035
  7. Global Market Analysis 2020 to 2024 and Forecast 2025 to 2035, By Capacity
    • Introduction/Key Findings
    • Historical Market Size Value (USD Billion) & Volume (Units) Analysis By Capacity, 2020 to 2024
    • Current and Future Market Size Value (USD Billion) & Volume (Units) Analysis and Forecast By Capacity, 2025 to 2035
      • Upto 100 ml
      • 100 ml to 250 ml
      • Above 250 ml
    • Y-o-Y Growth Trend Analysis By Capacity, 2020 to 2024
    • Absolute $ Opportunity Analysis By Capacity, 2025 to 2035
  8. Global Market Analysis 2020 to 2024 and Forecast 2025 to 2035, By End Use
    • Introduction/Key Findings
    • Historical Market Size Value (USD Billion) & Volume (Units) Analysis By End Use, 2020 to 2024
    • Current and Future Market Size Value (USD Billion) & Volume (Units) Analysis and Forecast By End Use, 2025 to 2035
      • Food & Beverage
      • Agriculture
      • Pharmaceutical
      • Cosmetic & Personal Care
      • Homecare
      • Chemicals
    • Y-o-Y Growth Trend Analysis By End Use, 2020 to 2024
    • Absolute $ Opportunity Analysis By End Use, 2025 to 2035
  9. Global Market Analysis 2020 to 2024 and Forecast 2025 to 2035, By Region
    • Introduction
    • Historical Market Size Value (USD Billion) & Volume (Units) Analysis By Region, 2020 to 2024
    • Current Market Size Value (USD Billion) & Volume (Units) Analysis and Forecast By Region, 2025 to 2035
      • North America
      • Latin America
      • Europe
      • East Asia
      • South Asia
      • Oceania
      • MEA
    • Market Attractiveness Analysis By Region
  10. North America Market Analysis 2020 to 2024 and Forecast 2025 to 2035, By Country
    • Historical Market Size Value (USD Billion) & Volume (Units) Trend Analysis By Market Taxonomy, 2020 to 2024
    • Market Size Value (USD Billion) & Volume (Units) Forecast By Market Taxonomy, 2025 to 2035
      • By Country
        • USA
        • Canada
      • By Material
      • By Capacity
      • By End Use
    • Market Attractiveness Analysis
      • By Country
      • By Material
      • By Capacity
      • By End Use
    • Key Takeaways
  11. Latin America Market Analysis 2020 to 2024 and Forecast 2025 to 2035, By Country
    • Historical Market Size Value (USD Billion) & Volume (Units) Trend Analysis By Market Taxonomy, 2020 to 2024
    • Market Size Value (USD Billion) & Volume (Units) Forecast By Market Taxonomy, 2025 to 2035
      • By Country
        • Brazil
        • Mexico
        • Argentina
        • Chile
        • Peru
        • Rest of Latin America
      • By Material
      • By Capacity
      • By End Use
    • Market Attractiveness Analysis
      • By Country
      • By Material
      • By Capacity
      • By End Use
    • Key Takeaways
  12. Europe Market Analysis 2020 to 2024 and Forecast 2025 to 2035, By Country
    • Historical Market Size Value (USD Billion) & Volume (Units) Trend Analysis By Market Taxonomy, 2020 to 2024
    • Market Size Value (USD Billion) & Volume (Units) Forecast By Market Taxonomy, 2025 to 2035
      • By Country
        • Germany
        • Italy
        • France
        • UK
        • Spain
        • Russia
        • BENELUX
        • Rest of Europe
      • By Material
      • By Capacity
      • By End Use
    • Market Attractiveness Analysis
      • By Country
      • By Material
      • By Capacity
      • By End Use
    • Key Takeaways
  13. East Asia Market Analysis 2020 to 2024 and Forecast 2025 to 2035, By Country
    • Historical Market Size Value (USD Billion) & Volume (Units) Trend Analysis By Market Taxonomy, 2020 to 2024
    • Market Size Value (USD Billion) & Volume (Units) Forecast By Market Taxonomy, 2025 to 2035
      • By Country
        • China
        • Japan
        • South Korea
      • By Material
      • By Capacity
      • By End Use
    • Market Attractiveness Analysis
      • By Country
      • By Material
      • By Capacity
      • By End Use
    • Key Takeaways
  14. South Asia Market Analysis 2020 to 2024 and Forecast 2025 to 2035, By Country
    • Historical Market Size Value (USD Billion) & Volume (Units) Trend Analysis By Market Taxonomy, 2020 to 2024
    • Market Size Value (USD Billion) & Volume (Units) Forecast By Market Taxonomy, 2025 to 2035
      • By Country
        • India
        • Thailand
        • Malaysia
        • Indonesia
        • Rest of South Asia
      • By Material
      • By Capacity
      • By End Use
    • Market Attractiveness Analysis
      • By Country
      • By Material
      • By Capacity
      • By End Use
    • Key Takeaways
  15. Oceania Market Analysis 2020 to 2024 and Forecast 2025 to 2035, By Country
    • Historical Market Size Value (USD Billion) & Volume (Units) Trend Analysis By Market Taxonomy, 2020 to 2024
    • Market Size Value (USD Billion) & Volume (Units) Forecast By Market Taxonomy, 2025 to 2035
      • By Country
        • Australia
        • New Zealand
      • By Material
      • By Capacity
      • By End Use
    • Market Attractiveness Analysis
      • By Country
      • By Material
      • By Capacity
      • By End Use
    • Key Takeaways
  16. MEA Market Analysis 2020 to 2024 and Forecast 2025 to 2035, By Country
    • Historical Market Size Value (USD Billion) & Volume (Units) Trend Analysis By Market Taxonomy, 2020 to 2024
    • Market Size Value (USD Billion) & Volume (Units) Forecast By Market Taxonomy, 2025 to 2035
      • By Country
        • GCC
        • Rest of MEA
      • By Material
      • By Capacity
      • By End Use
    • Market Attractiveness Analysis
      • By Country
      • By Material
      • By Capacity
      • By End Use
    • Key Takeaways
  17. Key Countries Market Analysis
    • USA
      • Pricing Analysis
      • Market Share Analysis, 2024
        • By Material
        • By Capacity
        • By End Use
    • Canada
      • Pricing Analysis
      • Market Share Analysis, 2024
        • By Material
        • By Capacity
        • By End Use
    • Brazil
      • Pricing Analysis
      • Market Share Analysis, 2024
        • By Material
        • By Capacity
        • By End Use
    • Mexico
      • Pricing Analysis
      • Market Share Analysis, 2024
        • By Material
        • By Capacity
        • By End Use
    • Argentina
      • Pricing Analysis
      • Market Share Analysis, 2024
        • By Material
        • By Capacity
        • By End Use
  18. Market Structure Analysis
    • Competition Dashboard
    • Competition Benchmarking
    • Market Share Analysis of Top Players
      • By Regional
      • By Material
      • By Capacity
      • By End Use
  19. Competition Analysis
    • Competition Deep Dive
      • Sabotcastle Limited
        • Overview
        • Product Portfolio
        • Profitability by Market Segments (Product/Age/Sales Channel/Region)
        • Sales Footprint
        • Strategy Overview
          • Marketing Strategy
          • Product Strategy
          • Channel Strategy
      • MUS Packaging
        • Overview
        • Product Portfolio
        • Profitability by Market Segments (Product/Age/Sales Channel/Region)
        • Sales Footprint
        • Strategy Overview
          • Marketing Strategy
          • Product Strategy
          • Channel Strategy
      • Klager Plastik GmbH
        • Overview
        • Product Portfolio
        • Profitability by Market Segments (Product/Age/Sales Channel/Region)
        • Sales Footprint
        • Strategy Overview
          • Marketing Strategy
          • Product Strategy
          • Channel Strategy
      • Berry Global Group
        • Overview
        • Product Portfolio
        • Profitability by Market Segments (Product/Age/Sales Channel/Region)
        • Sales Footprint
        • Strategy Overview
          • Marketing Strategy
          • Product Strategy
          • Channel Strategy
      • Amcor plc
        • Overview
        • Product Portfolio
        • Profitability by Market Segments (Product/Age/Sales Channel/Region)
        • Sales Footprint
        • Strategy Overview
          • Marketing Strategy
          • Product Strategy
          • Channel Strategy
      • DEMAREIS GmbH
        • Overview
        • Product Portfolio
        • Profitability by Market Segments (Product/Age/Sales Channel/Region)
        • Sales Footprint
        • Strategy Overview
          • Marketing Strategy
          • Product Strategy
          • Channel Strategy
      • Frapak Packaging
        • Overview
        • Product Portfolio
        • Profitability by Market Segments (Product/Age/Sales Channel/Region)
        • Sales Footprint
        • Strategy Overview
          • Marketing Strategy
          • Product Strategy
          • Channel Strategy
      • Tolco Corporation
        • Overview
        • Product Portfolio
        • Profitability by Market Segments (Product/Age/Sales Channel/Region)
        • Sales Footprint
        • Strategy Overview
          • Marketing Strategy
          • Product Strategy
          • Channel Strategy
      • PB Packaging (A Tricorbraun Company)
        • Overview
        • Product Portfolio
        • Profitability by Market Segments (Product/Age/Sales Channel/Region)
        • Sales Footprint
        • Strategy Overview
          • Marketing Strategy
          • Product Strategy
          • Channel Strategy
      • C.L.Smith
        • Overview
        • Product Portfolio
        • Profitability by Market Segments (Product/Age/Sales Channel/Region)
        • Sales Footprint
        • Strategy Overview
          • Marketing Strategy
          • Product Strategy
          • Channel Strategy
      • Pretium Packaging
        • Overview
        • Product Portfolio
        • Profitability by Market Segments (Product/Age/Sales Channel/Region)
        • Sales Footprint
        • Strategy Overview
          • Marketing Strategy
          • Product Strategy
          • Channel Strategy
  20. Assumptions & Acronyms Used
  21. Research Methodology

List of Tables

  • Table 1: Global Market Value (USD Billion) Forecast by Region, 2020-2035
  • Table 2: Global Market Volume (Units) Forecast by Region, 2020-2035
  • Table 3: Global Market Value (USD Billion) Forecast by Material, 2020-2035
  • Table 4: Global Market Volume (Units) Forecast by Material, 2020-2035
  • Table 5: Global Market Value (USD Billion) Forecast by Capacity, 2020-2035
  • Table 6: Global Market Volume (Units) Forecast by Capacity, 2020-2035
  • Table 7: Global Market Value (USD Billion) Forecast by End Use, 2020-2035
  • Table 8: Global Market Volume (Units) Forecast by End Use, 2020-2035
  • Table 9: North America Market Value (USD Billion) Forecast by Country, 2020-2035
  • Table 10: North America Market Volume (Units) Forecast by Country, 2020-2035
  • Table 11: North America Market Value (USD Billion) Forecast by Material, 2020-2035
  • Table 12: North America Market Volume (Units) Forecast by Material, 2020-2035
  • Table 13: North America Market Value (USD Billion) Forecast by Capacity, 2020-2035
  • Table 14: North America Market Volume (Units) Forecast by Capacity, 2020-2035
  • Table 15: North America Market Value (USD Billion) Forecast by End Use, 2020-2035
  • Table 16: North America Market Volume (Units) Forecast by End Use, 2020-2035
  • Table 17: Latin America Market Value (USD Billion) Forecast by Country, 2020-2035
  • Table 18: Latin America Market Volume (Units) Forecast by Country, 2020-2035
  • Table 19: Latin America Market Value (USD Billion) Forecast by Material, 2020-2035
  • Table 20: Latin America Market Volume (Units) Forecast by Material, 2020-2035
  • Table 21: Latin America Market Value (USD Billion) Forecast by Capacity, 2020-2035
  • Table 22: Latin America Market Volume (Units) Forecast by Capacity, 2020-2035
  • Table 23: Latin America Market Value (USD Billion) Forecast by End Use, 2020-2035
  • Table 24: Latin America Market Volume (Units) Forecast by End Use, 2020-2035
  • Table 25: Europe Market Value (USD Billion) Forecast by Country, 2020-2035
  • Table 26: Europe Market Volume (Units) Forecast by Country, 2020-2035
  • Table 27: Europe Market Value (USD Billion) Forecast by Material, 2020-2035
  • Table 28: Europe Market Volume (Units) Forecast by Material, 2020-2035
  • Table 29: Europe Market Value (USD Billion) Forecast by Capacity, 2020-2035
  • Table 30: Europe Market Volume (Units) Forecast by Capacity, 2020-2035
  • Table 31: Europe Market Value (USD Billion) Forecast by End Use, 2020-2035
  • Table 32: Europe Market Volume (Units) Forecast by End Use, 2020-2035
  • Table 33: East Asia Market Value (USD Billion) Forecast by Country, 2020-2035
  • Table 34: East Asia Market Volume (Units) Forecast by Country, 2020-2035
  • Table 35: East Asia Market Value (USD Billion) Forecast by Material, 2020-2035
  • Table 36: East Asia Market Volume (Units) Forecast by Material, 2020-2035
  • Table 37: East Asia Market Value (USD Billion) Forecast by Capacity, 2020-2035
  • Table 38: East Asia Market Volume (Units) Forecast by Capacity, 2020-2035
  • Table 39: East Asia Market Value (USD Billion) Forecast by End Use, 2020-2035
  • Table 40: East Asia Market Volume (Units) Forecast by End Use, 2020-2035
  • Table 41: South Asia Market Value (USD Billion) Forecast by Country, 2020-2035
  • Table 42: South Asia Market Volume (Units) Forecast by Country, 2020-2035
  • Table 43: South Asia Market Value (USD Billion) Forecast by Material, 2020-2035
  • Table 44: South Asia Market Volume (Units) Forecast by Material, 2020-2035
  • Table 45: South Asia Market Value (USD Billion) Forecast by Capacity, 2020-2035
  • Table 46: South Asia Market Volume (Units) Forecast by Capacity, 2020-2035
  • Table 47: South Asia Market Value (USD Billion) Forecast by End Use, 2020-2035
  • Table 48: South Asia Market Volume (Units) Forecast by End Use, 2020-2035
  • Table 49: Oceania Market Value (USD Billion) Forecast by Country, 2020-2035
  • Table 50: Oceania Market Volume (Units) Forecast by Country, 2020-2035
  • Table 51: Oceania Market Value (USD Billion) Forecast by Material, 2020-2035
  • Table 52: Oceania Market Volume (Units) Forecast by Material, 2020-2035
  • Table 53: Oceania Market Value (USD Billion) Forecast by Capacity, 2020-2035
  • Table 54: Oceania Market Volume (Units) Forecast by Capacity, 2020-2035
  • Table 55: Oceania Market Value (USD Billion) Forecast by End Use, 2020-2035
  • Table 56: Oceania Market Volume (Units) Forecast by End Use, 2020-2035
  • Table 57: MEA Market Value (USD Billion) Forecast by Country, 2020-2035
  • Table 58: MEA Market Volume (Units) Forecast by Country, 2020-2035
  • Table 59: MEA Market Value (USD Billion) Forecast by Material, 2020-2035
  • Table 60: MEA Market Volume (Units) Forecast by Material, 2020-2035
  • Table 61: MEA Market Value (USD Billion) Forecast by Capacity, 2020-2035
  • Table 62: MEA Market Volume (Units) Forecast by Capacity, 2020-2035
  • Table 63: MEA Market Value (USD Billion) Forecast by End Use, 2020-2035
  • Table 64: MEA Market Volume (Units) Forecast by End Use, 2020-2035

List of Figures

  • Figure 1: Global Market Volume (Units) Forecast 2020-2035
  • Figure 2: Global Market Pricing Analysis
  • Figure 3: Global Market Value (USD Billion) Forecast 2020-2035
  • Figure 4: Global Market Value Share and BPS Analysis by Material, 2025 and 2035
  • Figure 5: Global Market Y-o-Y Growth Comparison by Material, 2025-2035
  • Figure 6: Global Market Attractiveness Analysis by Material
  • Figure 7: Global Market Value Share and BPS Analysis by Capacity, 2025 and 2035
  • Figure 8: Global Market Y-o-Y Growth Comparison by Capacity, 2025-2035
  • Figure 9: Global Market Attractiveness Analysis by Capacity
  • Figure 10: Global Market Value Share and BPS Analysis by End Use, 2025 and 2035
  • Figure 11: Global Market Y-o-Y Growth Comparison by End Use, 2025-2035
  • Figure 12: Global Market Attractiveness Analysis by End Use
  • Figure 13: Global Market Value (USD Billion) Share and BPS Analysis by Region, 2025 and 2035
  • Figure 14: Global Market Y-o-Y Growth Comparison by Region, 2025-2035
  • Figure 15: Global Market Attractiveness Analysis by Region
  • Figure 16: North America Market Incremental $ Opportunity, 2025-2035
  • Figure 17: Latin America Market Incremental $ Opportunity, 2025-2035
  • Figure 18: Europe Market Incremental $ Opportunity, 2025-2035
  • Figure 19: East Asia Market Incremental $ Opportunity, 2025-2035
  • Figure 20: South Asia Market Incremental $ Opportunity, 2025-2035
  • Figure 21: Oceania Market Incremental $ Opportunity, 2025-2035
  • Figure 22: MEA Market Incremental $ Opportunity, 2025-2035
  • Figure 23: North America Market Value Share and BPS Analysis by Country, 2025 and 2035
  • Figure 24: North America Market Value Share and BPS Analysis by Material, 2025 and 2035
  • Figure 25: North America Market Y-o-Y Growth Comparison by Material, 2025-2035
  • Figure 26: North America Market Attractiveness Analysis by Material
  • Figure 27: North America Market Value Share and BPS Analysis by Capacity, 2025 and 2035
  • Figure 28: North America Market Y-o-Y Growth Comparison by Capacity, 2025-2035
  • Figure 29: North America Market Attractiveness Analysis by Capacity
  • Figure 30: North America Market Value Share and BPS Analysis by End Use, 2025 and 2035
  • Figure 31: North America Market Y-o-Y Growth Comparison by End Use, 2025-2035
  • Figure 32: North America Market Attractiveness Analysis by End Use
  • Figure 33: Latin America Market Value Share and BPS Analysis by Country, 2025 and 2035
  • Figure 34: Latin America Market Value Share and BPS Analysis by Material, 2025 and 2035
  • Figure 35: Latin America Market Y-o-Y Growth Comparison by Material, 2025-2035
  • Figure 36: Latin America Market Attractiveness Analysis by Material
  • Figure 37: Latin America Market Value Share and BPS Analysis by Capacity, 2025 and 2035
  • Figure 38: Latin America Market Y-o-Y Growth Comparison by Capacity, 2025-2035
  • Figure 39: Latin America Market Attractiveness Analysis by Capacity
  • Figure 40: Latin America Market Value Share and BPS Analysis by End Use, 2025 and 2035
  • Figure 41: Latin America Market Y-o-Y Growth Comparison by End Use, 2025-2035
  • Figure 42: Latin America Market Attractiveness Analysis by End Use
  • Figure 43: Europe Market Value Share and BPS Analysis by Country, 2025 and 2035
  • Figure 44: Europe Market Value Share and BPS Analysis by Material, 2025 and 2035
  • Figure 45: Europe Market Y-o-Y Growth Comparison by Material, 2025-2035
  • Figure 46: Europe Market Attractiveness Analysis by Material
  • Figure 47: Europe Market Value Share and BPS Analysis by Capacity, 2025 and 2035
  • Figure 48: Europe Market Y-o-Y Growth Comparison by Capacity, 2025-2035
  • Figure 49: Europe Market Attractiveness Analysis by Capacity
  • Figure 50: Europe Market Value Share and BPS Analysis by End Use, 2025 and 2035
  • Figure 51: Europe Market Y-o-Y Growth Comparison by End Use, 2025-2035
  • Figure 52: Europe Market Attractiveness Analysis by End Use
  • Figure 53: East Asia Market Value Share and BPS Analysis by Country, 2025 and 2035
  • Figure 54: East Asia Market Value Share and BPS Analysis by Material, 2025 and 2035
  • Figure 55: East Asia Market Y-o-Y Growth Comparison by Material, 2025-2035
  • Figure 56: East Asia Market Attractiveness Analysis by Material
  • Figure 57: East Asia Market Value Share and BPS Analysis by Capacity, 2025 and 2035
  • Figure 58: East Asia Market Y-o-Y Growth Comparison by Capacity, 2025-2035
  • Figure 59: East Asia Market Attractiveness Analysis by Capacity
  • Figure 60: East Asia Market Value Share and BPS Analysis by End Use, 2025 and 2035
  • Figure 61: East Asia Market Y-o-Y Growth Comparison by End Use, 2025-2035
  • Figure 62: East Asia Market Attractiveness Analysis by End Use
  • Figure 63: South Asia Market Value Share and BPS Analysis by Country, 2025 and 2035
  • Figure 64: South Asia Market Value Share and BPS Analysis by Material, 2025 and 2035
  • Figure 65: South Asia Market Y-o-Y Growth Comparison by Material, 2025-2035
  • Figure 66: South Asia Market Attractiveness Analysis by Material
  • Figure 67: South Asia Market Value Share and BPS Analysis by Capacity, 2025 and 2035
  • Figure 68: South Asia Market Y-o-Y Growth Comparison by Capacity, 2025-2035
  • Figure 69: South Asia Market Attractiveness Analysis by Capacity
  • Figure 70: South Asia Market Value Share and BPS Analysis by End Use, 2025 and 2035
  • Figure 71: South Asia Market Y-o-Y Growth Comparison by End Use, 2025-2035
  • Figure 72: South Asia Market Attractiveness Analysis by End Use
  • Figure 73: Oceania Market Value Share and BPS Analysis by Country, 2025 and 2035
  • Figure 74: Oceania Market Value Share and BPS Analysis by Material, 2025 and 2035
  • Figure 75: Oceania Market Y-o-Y Growth Comparison by Material, 2025-2035
  • Figure 76: Oceania Market Attractiveness Analysis by Material
  • Figure 77: Oceania Market Value Share and BPS Analysis by Capacity, 2025 and 2035
  • Figure 78: Oceania Market Y-o-Y Growth Comparison by Capacity, 2025-2035
  • Figure 79: Oceania Market Attractiveness Analysis by Capacity
  • Figure 80: Oceania Market Value Share and BPS Analysis by End Use, 2025 and 2035
  • Figure 81: Oceania Market Y-o-Y Growth Comparison by End Use, 2025-2035
  • Figure 82: Oceania Market Attractiveness Analysis by End Use
  • Figure 83: MEA Market Value Share and BPS Analysis by Country, 2025 and 2035
  • Figure 84: MEA Market Value Share and BPS Analysis by Material, 2025 and 2035
  • Figure 85: MEA Market Y-o-Y Growth Comparison by Material, 2025-2035
  • Figure 86: MEA Market Attractiveness Analysis by Material
  • Figure 87: MEA Market Value Share and BPS Analysis by Capacity, 2025 and 2035
  • Figure 88: MEA Market Y-o-Y Growth Comparison by Capacity, 2025-2035
  • Figure 89: MEA Market Attractiveness Analysis by Capacity
  • Figure 90: MEA Market Value Share and BPS Analysis by End Use, 2025 and 2035
  • Figure 91: MEA Market Y-o-Y Growth Comparison by End Use, 2025-2035
  • Figure 92: MEA Market Attractiveness Analysis by End Use
  • Figure 93: Global Market - Tier Structure Analysis
  • Figure 94: Global Market - Company Share Analysis

Frequently Asked Questions

What was the overall size of the trigger spray bottle market in 2025?

The overall market size for the trigger spray bottle market was USD 2.6 billion in 2025.

How big is the trigger spray bottle market expected to be in 2035?

The trigger spray bottle market is expected to reach USD 4.2 billion in 2035.

What will drive the demand for the trigger spray bottle market during the forecast period?

The demand for trigger spray bottles will be driven by rising usage in household and industrial cleaning products, growing demand for personal care and cosmetic packaging, increased focus on user-friendly and controlled dispensing solutions, and advancements in recyclable and ergonomic bottle designs.

List the top 5 countries contributing to the trigger spray bottle market.

The top 5 countries driving the development of the trigger spray bottle market are the USA, China, Germany, the UK, and India.

Which segment in type is expected to lead in the trigger spray bottle market?

The polyethylene terephthalate (PET) segment is expected to command a significant share over the assessment period.

Explore Similar Insights

Future Market Insights

Trigger Spray Bottle Market