Trolley Bags Market Outlook (2023 to 2033)

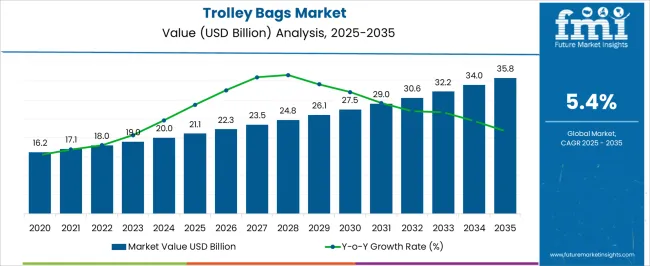
The trolley bags market size is projected to be valued at US$ 18,913.21 million in 2023 and is expected to rise to US$ 32,924.20 million by 2033. The sales of trolley bags are expected to record a significant CAGR of 5.7% during the forecast period.

The trolley bags market is witnessing a huge quantity of purchases as the populace is adopting trolleys for convenient and easy carriage of luggage during traveling. However, the COVID-19 pandemic decreased international tourist arrivals, and in 2020, the number dropped significantly, resulting in the sales of trolley bags majorly declining and negatively impacting the global market growth.

Inversely, the advancement in technology is implementing innovations such as the development of smart luggage with GPS trackers. This is likely to accelerate the overall growth of the market and create opportunities for market players.

The trolley bags are specially designed for people fighting with dexterity, limited strength, eyesight, and stamina. The travel bags market has witnessed an evolution in its product range, and trolley bags are gaining an edge over regular traveling bags.

Moreover, the robust movement of business travelers is fostering the need for various types of luggage trolley bags and is further fueling the requirement for this product, along with duffle bags, backpacks, and more.

Since the rise of travel and tourism has intensified the need for manufacturing more travel trolley bags, it is anticipated that the trolley bags market is likely to witness significant growth during the forecast period.

Attributes Details
Market Estimated Size (2023) US$ 18,913.21 million
Market CAGR (2023 to 2033) 5.7%
Market Forecasted Size (2033) US$ 32,924.20 million

Don't pay for what you don't need

Customize your report by selecting specific countries or regions and save 30%!

Demand Drivers Fostering Market Growth for Trolley Bags

A Surge in Travel and Tourism: Booming travel industry can be referred to as the prime driver bolstering the demand for trolley bags in the global market.

Booming educational opportunities also serve to be a key contributor to the trolley bags market, as students are moving across the globe to pursue different courses, and trolley bags are offering convenience at their fingertips to carry loads of luggage.

Urbanization: Rapid urbanization and changes in lifestyle are creating a demand for innovative products such as polycarbonate luggage bags, hard-side trolley bags, and more.

There is a rising inclination and preference toward adventure, which is acting as a beneficial factor for manufacturing hubs.

Increased Purchasing Power: Middle-class households are witnessing an upsurge in their purchasing power, especially in the developing regions, and is anticipated to create more need for premium and fashionable travel bags, including travel pouches, trolley bags, duffle bags, backpacks, and other.

Factors Curbing the Market Growth of Trolley Bags

Besides the factor making a significant contribution to the expansion of the trolley bags market, it is also identified that several factors are going to affect the market in a negative way.

Rise in Unorganized Market Players: Unorganized market players is on the rise; they usually tend to offer products with similar attributes at lower prices to secure expenses on research and development, raw materials of high quality, branding, and advertising. Therefore, the presence of such market players is likely to inhibit the growth of the trolley bags market in the upcoming years.

High Cost of Manufacturing: The procurement of raw materials for manufacturing trolley bags incurs a lot of expense. The high cost associated with the manufacturing unit and high labor charges is going to slow down the pace of advancement in the global trolley bags market.

Ismail Sutaria
Ismail Sutaria

Principal Consultant

Talk to Analyst

Find your sweet spots for generating winning opportunities in this market.

Possibilities that Expand the Market

Market players focusing on technological advancements are expected to boost the demand for smart trolley bags through the introduction of ‘smart luggage.’ This effectuates the rapid growth of the travel and tourism industry across the globe.

A new generation of smart luggage, known as 'EVOA Tech,' can communicate effectively with the owner with the help of the Internet of Things (IoT). Moreover, another smart luggage feature offers a built-in USB port with cables connected to a power bank compartment. These significant updates are remarkably increasing consumer demand and generating profitable opportunities for the market.

High costs associated with overweight luggage at airports are creating lucrative options for market players. Hence, an in-built weighing scale that displays the exact weight of the luggage as soon as the user lifts the bag is an important feature that is expected to considerably surge consumer demand and aid companies in gaining a competitive edge in the market.

Regional Analysis

Overview of the North America Trolley Bags Market

The North American region is expected to advance at a steady growth rate during the forecast period. Currently, this region is accountable for 26.0% of the total market share of trolley bags.

The factor contributing to the market size expansion for trolley bags in North America can be owed to the rapid pace of urbanization and increasing disposable income that is encouraging the populace of North America to indulge in more adventurous activities and traveling, simultaneously fueling the demand for trolley bags for smooth luggage carrying purposes.
Growth Outlook of Europe Trolley Bags Market

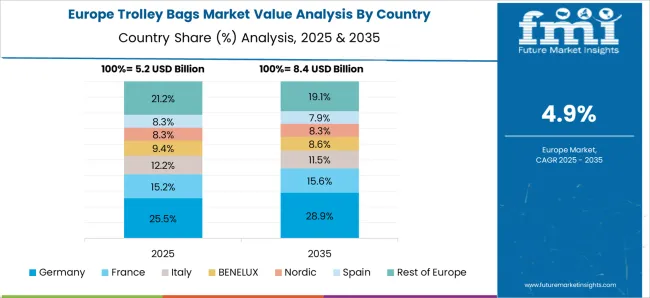
Europe is projected to hold the maxim share of the global trolley bags market. At present, the European regions are cumulatively accountable for 34.0% of the total share of the trolley bags market.

The growth in Europe can be attributed to the presence of the leading market players in this region, who are continually making efforts towards further innovating the product and giving the most durable and unique form of trolley bags to the end-users.

Furthermore, the advancement of technology in the European regions, such as the development of smart luggage with GPS trackers and other facilities in luggage bags, is projected to expand the overall market during the forecast period.

Get the data you need at a Fraction of the cost

Personalize your report by choosing insights you need
and save 40%!

Start-up Ecosystem

How are the Start-ups Revolutionizing the Trolley Bags Market?

The start-ups in the trolley bags market are evolving their business models with the advent of new technology and the emergence of new exciting trends. They are deploying new interesting themes which are gaining popularity amongst the end users.

Two start-ups to watch for:

Start-up Name Away, New York City
Year of Foundation 2015
Total Funding US$ 181 million
Description Away is an internet-first direct-to-consumer luggage brand. The luggage bag has a removable battery to charge electronic devices. The products are manufactured in China and sold via the online platform and offline stores in New York and London. It provides 100 days of free trial and a lifetime warranty on its products.
Start-Up Name Horizn Studios, Berlin (Germany)
Year of Foundation 2015
Total Funding US$ 29 million
Description Horizn Studios designs, produce, and sell travel and personal bags. The brand incorporates various functionalities aimed at the traveler segment into its products, like USB charging, GPS, hard external bag shell, etc. Their flagship product is a smart trolley that is equipped with a smart charger and proximity sensor that warns owners when they are too far from the product.

Competitive Landscape

Take of Key Market Players in the Trolley Bags Market

The trolley bag market manufacturers are continuously trying to equip the products with new and advanced features. They are indulging in collaborations and, mergers & acquisitions to facilitate the consumers with premium quality durable products that may lead to more adoption and bolster the market growth of trolley bags.

Top Companies Influencing the Market:

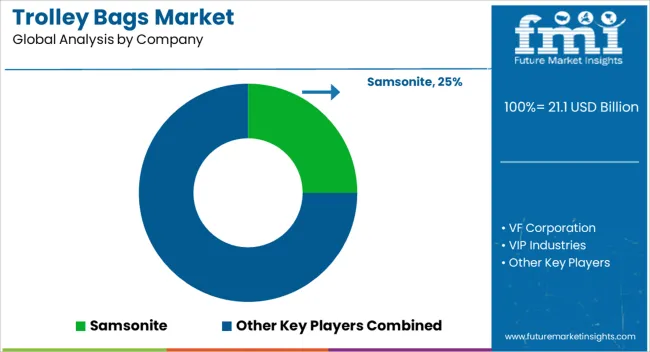
Samsonite: Samsonite is continuously developing innovative solutions with sustainable materials and production processes. This is ensuring their products' durability, extending the product's life, and developing viable end-of-life solutions to divert as many of the products from landfill for as long as possible.

VIP Industries: Asia’s leading organization is focused on organizational transformation towards a professional and streamlined business operation poised for fast-paced profitable growth in the travel bags market.

Delsey: They are a French company which manufactures luggage and travel accessories. They are based in Tremblay-en-France, in the Paris suburbs. As of 2010, they held second place in the global luggage market, behind Samsonite.

Skyway: The brand is devoted to delivering luggage and travel accessories that have universal appeal and are user-friendly. They are committed to quality and continue to manifest their reputation through constant innovation, characterized by the utilization of durable materials to make the customer's travel experience better.

Victorinox: They are a global company with five product categories - Swiss Army Knives, Household & Professional Knives, Watches, Travel Gear, and Fragrances. The Swiss Army Knives, as well as their Travel Gear, are the core products and have a pioneering role in the development of all product categories.

Other Biggies in the Trolley Bags Market are

  • VF Corporation
  • Briggs & Riley
  • Rimowa
  • Travelpro
  • Tommy Hilfiger
  • Olympia
  • Fox Luggage
  • Traveler’s Choice
  • ACE
  • Diplomat
  • EMINENT

Some Recent Developments are:

  • Horizn Studios has debuted its new range of luxury luggage to create more environment-friendly and sustainable products. This new luggage range, Circle One, is 100% plant-based and biodegradable for ethically aware travelers. The brand has also eliminated the use of single-use plastics in its packaging and is focusing on the utilization of recyclable materials and cardboard instead.
  • Go Travel has partnered with Case and is all set to take center stage with its accessories now being showcased at the Case store at London's Heathrow Airport. The companies have signed a three-year agreement, and the agreement is expected to be followed throughout a majority of Case stores. Go Travel is known for its accessories, such as pillows, travel adapters, and travel comfort collection.

Scope of the Report

Attributes Details
Growth Rate CAGR of 5.7% from 2023 to 2033
Base Year of Estimation 2023
Historical Data 2018 to 2022
Forecast Period 2023 to 2033
Quantitative Units Revenue in US$ million and Volume in Units and F-CAGR from 2023 to 2033
Report Coverage Revenue Forecast, Volume Forecast, Company Ranking, Competitive Landscape, growth factors, Trends, and Pricing Analysis
Key Segments Covered Material Type, Distribution Channel, Price Range, By Region
Regions Covered North America; Latin America; Europe; East Asia; South Asia; The Middle East & Africa; Oceania
Key Countries Profiled The United States, Canada, Brazil, Mexico, Germany, Italy, France, The United Kingdom, Spain, Russia, China, Japan, India, GCC Countries, Australia
Key Companies Profiled VF Corporation; Samsonite; VIP Industries; Delsey; Briggs & Riley; Rimowa; Travelpro; Tommy Hilfiger; Victorinox; Olympia; Fox Luggage; Skyway; Traveler’s Choice; ACE; Diplomat; EMINENT
Customization & Pricing Available upon Request

Key Segments Covered in the Trolley Bags Market Report

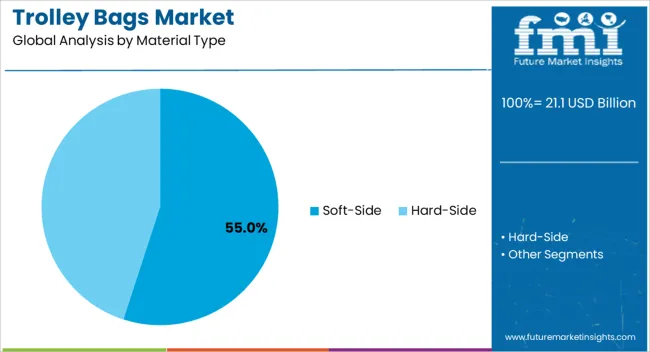
By Material Type:

  • Hard-Side
  • Soft-Side

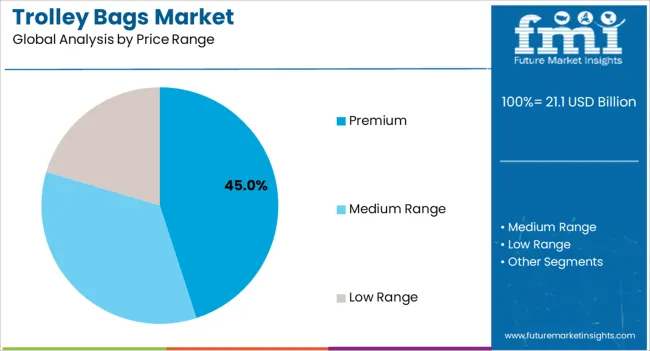
By Price Range:

  • Premium
  • Medium Range
  • Low Range

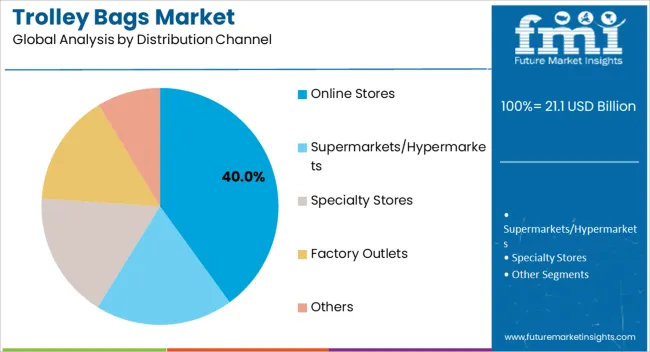
By Distribution Channel:

  • Supermarkets/Hypermarkets
  • Specialty Stores
  • Factory Outlets
  • Online Stores
  • Others

By Region:

  • North America
  • Latin America
  • Western Europe
  • Eastern Europe
  • Asia Pacific Excluding Japan (APEJ)
  • Japan
  • The Middle East & Africa (MEA)

Frequently Asked Questions

What is the Future of the Trolley Bags Industry?

The overall industry value could reach almost US$ 32,924.2 million by 2033.

What will be the Growth Rate of the Global Trolley Bags Market?

The global demand for trolley bags is estimated to rise at merely 5.7% CAGR through 2033.

How North America Trolley Bags Market is Performing?

Owing to the presence of leading manufacturers it currently holds 26% market share.

Which Type of Trolley Bags are Popular among the Buyers?

Printed polywoven bags are getting popular day by day.

What is the Restraint for Trolley Bags Market Players Worldwide?

The rise of unorganized market players is a curbing factor for sales of trolley bags.

Table of Content
1. Executive Summary
    1.1. Global Market Outlook
    1.2. Demand-side Trends
    1.3. Supply-side Trends
    1.4. Technology Roadmap Analysis
    1.5. Analysis and Recommendations
2. Market Overview
    2.1. Market Coverage / Taxonomy
    2.2. Market Definition / Scope / Limitations
3. Market Background
    3.1. Market Dynamics
        3.1.1. Drivers
        3.1.2. Restraints
        3.1.3. Opportunity
        3.1.4. Trends
    3.2. Scenario Forecast
        3.2.1. Demand in Optimistic Scenario
        3.2.2. Demand in Likely Scenario
        3.2.3. Demand in Conservative Scenario
    3.3. Opportunity Map Analysis
    3.4. Product Life Cycle Analysis
    3.5. Supply Chain Analysis
        3.5.1. Supply Side Participants and their Roles
            3.5.1.1. Producers
            3.5.1.2. Mid-Level Participants (Traders/ Agents/ Brokers)
            3.5.1.3. Wholesalers and Distributors
        3.5.2. Value Added and Value Created at Node in the Supply Chain
        3.5.3. List of Raw Material Suppliers
        3.5.4. List of Existing and Potential Buyer’s
    3.6. Investment Feasibility Matrix
    3.7. Value Chain Analysis
        3.7.1. Profit Margin Analysis
        3.7.2. Wholesalers and Distributors
        3.7.3. Retailers
    3.8. PESTLE and Porter’s Analysis
    3.9. Regulatory Landscape
        3.9.1. By Key Regions
        3.9.2. By Key Countries
    3.10. Regional Parent Market Outlook
    3.11. Production and Consumption Statistics
    3.12. Import and Export Statistics
4. Global Market Analysis 2018 to 2022 and Forecast, 2023 to 2033
    4.1. Historical Market Size Value (US$ Million) & Volume (Units) Analysis, 2018 to 2022
    4.2. Current and Future Market Size Value (US$ Million) & Volume (Units) Projections, 2023 to 2033
        4.2.1. Y-o-Y Growth Trend Analysis
        4.2.2. Absolute $ Opportunity Analysis
5. Global Market Analysis 2018 to 2022 and Forecast 2023 to 2033, By Material Type
    5.1. Introduction / Key Findings
    5.2. Historical Market Size Value (US$ Million) & Volume (Units) Analysis By Material Type, 2018 to 2022
    5.3. Current and Future Market Size Value (US$ Million) & Volume (Units) Analysis and Forecast By Material Type, 2023 to 2033
        5.3.1. Hard-Side
        5.3.2. Soft-Side
    5.4. Y-o-Y Growth Trend Analysis By Material Type, 2018 to 2022
    5.5. Absolute $ Opportunity Analysis By Material Type, 2023 to 2033
6. Global Market Analysis 2018 to 2022 and Forecast 2023 to 2033, By Price Range
    6.1. Introduction / Key Findings
    6.2. Historical Market Size Value (US$ Million) & Volume (Units) Analysis By Price Range, 2018 to 2022
    6.3. Current and Future Market Size Value (US$ Million) & Volume (Units) Analysis and Forecast By Price Range, 2023 to 2033
        6.3.1. Premium
        6.3.2. Medium Range
        6.3.3. Low Range
    6.4. Y-o-Y Growth Trend Analysis By Price Range, 2018 to 2022
    6.5. Absolute $ Opportunity Analysis By Price Range, 2023 to 2033
7. Global Market Analysis 2018 to 2022 and Forecast 2023 to 2033, By Distribution Channel
    7.1. Introduction / Key Findings
    7.2. Historical Market Size Value (US$ Million) & Volume (Units) Analysis By Distribution Channel, 2018 to 2022
    7.3. Current and Future Market Size Value (US$ Million) & Volume (Units) Analysis and Forecast By Distribution Channel, 2023 to 2033
        7.3.1. Supermarkets/Hypermarkets
        7.3.2. Specialty Stores
        7.3.3. Factory Outlets
        7.3.4. Online Stores
        7.3.5. Others
    7.4. Y-o-Y Growth Trend Analysis By Distribution Channel, 2018 to 2022
    7.5. Absolute $ Opportunity Analysis By Distribution Channel, 2023 to 2033
8. Global Market Analysis 2018 to 2022 and Forecast 2023 to 2033, By Region
    8.1. Introduction
    8.2. Historical Market Size Value (US$ Million) & Volume (Units) Analysis By Region, 2018 to 2022
    8.3. Current Market Size Value (US$ Million) & Volume (Units) Analysis and Forecast By Region, 2023 to 2033
        8.3.1. North America
        8.3.2. Latin America
        8.3.3. Western Europe
        8.3.4. Eastern Europe
        8.3.5. South Asia and Pacific
        8.3.6. East Asia
        8.3.7. Middle East and Africa
    8.4. Market Attractiveness Analysis By Region
9. North America Market Analysis 2018 to 2022 and Forecast 2023 to 2033, By Country
    9.1. Historical Market Size Value (US$ Million) & Volume (Units) Trend Analysis By Market Taxonomy, 2018 to 2022
    9.2. Market Size Value (US$ Million) & Volume (Units) Forecast By Market Taxonomy, 2023 to 2033
        9.2.1. By Country
            9.2.1.1. U.S.
            9.2.1.2. Canada
        9.2.2. By Material Type
        9.2.3. By Price Range
        9.2.4. By Distribution Channel
    9.3. Market Attractiveness Analysis
        9.3.1. By Country
        9.3.2. By Material Type
        9.3.3. By Price Range
        9.3.4. By Distribution Channel
    9.4. Key Takeaways
10. Latin America Market Analysis 2018 to 2022 and Forecast 2023 to 2033, By Country
    10.1. Historical Market Size Value (US$ Million) & Volume (Units) Trend Analysis By Market Taxonomy, 2018 to 2022
    10.2. Market Size Value (US$ Million) & Volume (Units) Forecast By Market Taxonomy, 2023 to 2033
        10.2.1. By Country
            10.2.1.1. Brazil
            10.2.1.2. Mexico
            10.2.1.3. Rest of Latin America
        10.2.2. By Material Type
        10.2.3. By Price Range
        10.2.4. By Distribution Channel
    10.3. Market Attractiveness Analysis
        10.3.1. By Country
        10.3.2. By Material Type
        10.3.3. By Price Range
        10.3.4. By Distribution Channel
    10.4. Key Takeaways
11. Western Europe Market Analysis 2018 to 2022 and Forecast 2023 to 2033, By Country
    11.1. Historical Market Size Value (US$ Million) & Volume (Units) Trend Analysis By Market Taxonomy, 2018 to 2022
    11.2. Market Size Value (US$ Million) & Volume (Units) Forecast By Market Taxonomy, 2023 to 2033
        11.2.1. By Country
            11.2.1.1. Germany
            11.2.1.2. U.K.
            11.2.1.3. France
            11.2.1.4. Spain
            11.2.1.5. Italy
            11.2.1.6. Rest of Western Europe
        11.2.2. By Material Type
        11.2.3. By Price Range
        11.2.4. By Distribution Channel
    11.3. Market Attractiveness Analysis
        11.3.1. By Country
        11.3.2. By Material Type
        11.3.3. By Price Range
        11.3.4. By Distribution Channel
    11.4. Key Takeaways
12. Eastern Europe Market Analysis 2018 to 2022 and Forecast 2023 to 2033, By Country
    12.1. Historical Market Size Value (US$ Million) & Volume (Units) Trend Analysis By Market Taxonomy, 2018 to 2022
    12.2. Market Size Value (US$ Million) & Volume (Units) Forecast By Market Taxonomy, 2023 to 2033
        12.2.1. By Country
            12.2.1.1. Poland
            12.2.1.2. Russia
            12.2.1.3. Czech Republic
            12.2.1.4. Romania
            12.2.1.5. Rest of Eastern Europe
        12.2.2. By Material Type
        12.2.3. By Price Range
        12.2.4. By Distribution Channel
    12.3. Market Attractiveness Analysis
        12.3.1. By Country
        12.3.2. By Material Type
        12.3.3. By Price Range
        12.3.4. By Distribution Channel
    12.4. Key Takeaways
13. South Asia and Pacific Market Analysis 2018 to 2022 and Forecast 2023 to 2033, By Country
    13.1. Historical Market Size Value (US$ Million) & Volume (Units) Trend Analysis By Market Taxonomy, 2018 to 2022
    13.2. Market Size Value (US$ Million) & Volume (Units) Forecast By Market Taxonomy, 2023 to 2033
        13.2.1. By Country
            13.2.1.1. India
            13.2.1.2. Bangladesh
            13.2.1.3. Australia
            13.2.1.4. New Zealand
            13.2.1.5. Rest of South Asia and Pacific
        13.2.2. By Material Type
        13.2.3. By Price Range
        13.2.4. By Distribution Channel
    13.3. Market Attractiveness Analysis
        13.3.1. By Country
        13.3.2. By Material Type
        13.3.3. By Price Range
        13.3.4. By Distribution Channel
    13.4. Key Takeaways
14. East Asia Market Analysis 2018 to 2022 and Forecast 2023 to 2033, By Country
    14.1. Historical Market Size Value (US$ Million) & Volume (Units) Trend Analysis By Market Taxonomy, 2018 to 2022
    14.2. Market Size Value (US$ Million) & Volume (Units) Forecast By Market Taxonomy, 2023 to 2033
        14.2.1. By Country
            14.2.1.1. China
            14.2.1.2. Japan
            14.2.1.3. South Korea
        14.2.2. By Material Type
        14.2.3. By Price Range
        14.2.4. By Distribution Channel
    14.3. Market Attractiveness Analysis
        14.3.1. By Country
        14.3.2. By Material Type
        14.3.3. By Price Range
        14.3.4. By Distribution Channel
    14.4. Key Takeaways
15. Middle East and Africa Market Analysis 2018 to 2022 and Forecast 2023 to 2033, By Country
    15.1. Historical Market Size Value (US$ Million) & Volume (Units) Trend Analysis By Market Taxonomy, 2018 to 2022
    15.2. Market Size Value (US$ Million) & Volume (Units) Forecast By Market Taxonomy, 2023 to 2033
        15.2.1. By Country
            15.2.1.1. GCC Countries
            15.2.1.2. South Africa
            15.2.1.3. Israel
            15.2.1.4. Rest of MEA
        15.2.2. By Material Type
        15.2.3. By Price Range
        15.2.4. By Distribution Channel
    15.3. Market Attractiveness Analysis
        15.3.1. By Country
        15.3.2. By Material Type
        15.3.3. By Price Range
        15.3.4. By Distribution Channel
    15.4. Key Takeaways
16. Key Countries Market Analysis
    16.1. U.S.
        16.1.1. Pricing Analysis
        16.1.2. Market Share Analysis, 2022
            16.1.2.1. By Material Type
            16.1.2.2. By Price Range
            16.1.2.3. By Distribution Channel
    16.2. Canada
        16.2.1. Pricing Analysis
        16.2.2. Market Share Analysis, 2022
            16.2.2.1. By Material Type
            16.2.2.2. By Price Range
            16.2.2.3. By Distribution Channel
    16.3. Brazil
        16.3.1. Pricing Analysis
        16.3.2. Market Share Analysis, 2022
            16.3.2.1. By Material Type
            16.3.2.2. By Price Range
            16.3.2.3. By Distribution Channel
    16.4. Mexico
        16.4.1. Pricing Analysis
        16.4.2. Market Share Analysis, 2022
            16.4.2.1. By Material Type
            16.4.2.2. By Price Range
            16.4.2.3. By Distribution Channel
    16.5. Germany
        16.5.1. Pricing Analysis
        16.5.2. Market Share Analysis, 2022
            16.5.2.1. By Material Type
            16.5.2.2. By Price Range
            16.5.2.3. By Distribution Channel
    16.6. U.K.
        16.6.1. Pricing Analysis
        16.6.2. Market Share Analysis, 2022
            16.6.2.1. By Material Type
            16.6.2.2. By Price Range
            16.6.2.3. By Distribution Channel
    16.7. France
        16.7.1. Pricing Analysis
        16.7.2. Market Share Analysis, 2022
            16.7.2.1. By Material Type
            16.7.2.2. By Price Range
            16.7.2.3. By Distribution Channel
    16.8. Spain
        16.8.1. Pricing Analysis
        16.8.2. Market Share Analysis, 2022
            16.8.2.1. By Material Type
            16.8.2.2. By Price Range
            16.8.2.3. By Distribution Channel
    16.9. Italy
        16.9.1. Pricing Analysis
        16.9.2. Market Share Analysis, 2022
            16.9.2.1. By Material Type
            16.9.2.2. By Price Range
            16.9.2.3. By Distribution Channel
    16.10. Poland
        16.10.1. Pricing Analysis
        16.10.2. Market Share Analysis, 2022
            16.10.2.1. By Material Type
            16.10.2.2. By Price Range
            16.10.2.3. By Distribution Channel
    16.11. Russia
        16.11.1. Pricing Analysis
        16.11.2. Market Share Analysis, 2022
            16.11.2.1. By Material Type
            16.11.2.2. By Price Range
            16.11.2.3. By Distribution Channel
    16.12. Czech Republic
        16.12.1. Pricing Analysis
        16.12.2. Market Share Analysis, 2022
            16.12.2.1. By Material Type
            16.12.2.2. By Price Range
            16.12.2.3. By Distribution Channel
    16.13. Romania
        16.13.1. Pricing Analysis
        16.13.2. Market Share Analysis, 2022
            16.13.2.1. By Material Type
            16.13.2.2. By Price Range
            16.13.2.3. By Distribution Channel
    16.14. India
        16.14.1. Pricing Analysis
        16.14.2. Market Share Analysis, 2022
            16.14.2.1. By Material Type
            16.14.2.2. By Price Range
            16.14.2.3. By Distribution Channel
    16.15. Bangladesh
        16.15.1. Pricing Analysis
        16.15.2. Market Share Analysis, 2022
            16.15.2.1. By Material Type
            16.15.2.2. By Price Range
            16.15.2.3. By Distribution Channel
    16.16. Australia
        16.16.1. Pricing Analysis
        16.16.2. Market Share Analysis, 2022
            16.16.2.1. By Material Type
            16.16.2.2. By Price Range
            16.16.2.3. By Distribution Channel
    16.17. New Zealand
        16.17.1. Pricing Analysis
        16.17.2. Market Share Analysis, 2022
            16.17.2.1. By Material Type
            16.17.2.2. By Price Range
            16.17.2.3. By Distribution Channel
    16.18. China
        16.18.1. Pricing Analysis
        16.18.2. Market Share Analysis, 2022
            16.18.2.1. By Material Type
            16.18.2.2. By Price Range
            16.18.2.3. By Distribution Channel
    16.19. Japan
        16.19.1. Pricing Analysis
        16.19.2. Market Share Analysis, 2022
            16.19.2.1. By Material Type
            16.19.2.2. By Price Range
            16.19.2.3. By Distribution Channel
    16.20. South Korea
        16.20.1. Pricing Analysis
        16.20.2. Market Share Analysis, 2022
            16.20.2.1. By Material Type
            16.20.2.2. By Price Range
            16.20.2.3. By Distribution Channel
    16.21. GCC Countries
        16.21.1. Pricing Analysis
        16.21.2. Market Share Analysis, 2022
            16.21.2.1. By Material Type
            16.21.2.2. By Price Range
            16.21.2.3. By Distribution Channel
    16.22. South Africa
        16.22.1. Pricing Analysis
        16.22.2. Market Share Analysis, 2022
            16.22.2.1. By Material Type
            16.22.2.2. By Price Range
            16.22.2.3. By Distribution Channel
    16.23. Israel
        16.23.1. Pricing Analysis
        16.23.2. Market Share Analysis, 2022
            16.23.2.1. By Material Type
            16.23.2.2. By Price Range
            16.23.2.3. By Distribution Channel
17. Market Structure Analysis
    17.1. Competition Dashboard
    17.2. Competition Benchmarking
    17.3. Market Share Analysis of Top Players
        17.3.1. By Regional
        17.3.2. By Material Type
        17.3.3. By Price Range
        17.3.4. By Distribution Channel
18. Competition Analysis
    18.1. Competition Deep Dive
        18.1.1. VF Corporation
            18.1.1.1. Overview
            18.1.1.2. Product Portfolio
            18.1.1.3. Profitability by Market Segments
            18.1.1.4. Sales Footprint
            18.1.1.5. Strategy Overview
                18.1.1.5.1. Marketing Strategy
                18.1.1.5.2. Product Strategy
                18.1.1.5.3. Channel Strategy
        18.1.2. Samsonite
            18.1.2.1. Overview
            18.1.2.2. Product Portfolio
            18.1.2.3. Profitability by Market Segments
            18.1.2.4. Sales Footprint
            18.1.2.5. Strategy Overview
                18.1.2.5.1. Marketing Strategy
                18.1.2.5.2. Product Strategy
                18.1.2.5.3. Channel Strategy
        18.1.3. VIP Industries
            18.1.3.1. Overview
            18.1.3.2. Product Portfolio
            18.1.3.3. Profitability by Market Segments
            18.1.3.4. Sales Footprint
            18.1.3.5. Strategy Overview
                18.1.3.5.1. Marketing Strategy
                18.1.3.5.2. Product Strategy
                18.1.3.5.3. Channel Strategy
        18.1.4. Delsey
            18.1.4.1. Overview
            18.1.4.2. Product Portfolio
            18.1.4.3. Profitability by Market Segments
            18.1.4.4. Sales Footprint
            18.1.4.5. Strategy Overview
                18.1.4.5.1. Marketing Strategy
                18.1.4.5.2. Product Strategy
                18.1.4.5.3. Channel Strategy
        18.1.5. Briggs & Riley
            18.1.5.1. Overview
            18.1.5.2. Product Portfolio
            18.1.5.3. Profitability by Market Segments
            18.1.5.4. Sales Footprint
            18.1.5.5. Strategy Overview
                18.1.5.5.1. Marketing Strategy
                18.1.5.5.2. Product Strategy
                18.1.5.5.3. Channel Strategy
        18.1.6. Rimowa
            18.1.6.1. Overview
            18.1.6.2. Product Portfolio
            18.1.6.3. Profitability by Market Segments
            18.1.6.4. Sales Footprint
            18.1.6.5. Strategy Overview
                18.1.6.5.1. Marketing Strategy
                18.1.6.5.2. Product Strategy
                18.1.6.5.3. Channel Strategy
        18.1.7. Travelpro
            18.1.7.1. Overview
            18.1.7.2. Product Portfolio
            18.1.7.3. Profitability by Market Segments
            18.1.7.4. Sales Footprint
            18.1.7.5. Strategy Overview
                18.1.7.5.1. Marketing Strategy
                18.1.7.5.2. Product Strategy
                18.1.7.5.3. Channel Strategy
        18.1.8. Tommy Hilfiger
            18.1.8.1. Overview
            18.1.8.2. Product Portfolio
            18.1.8.3. Profitability by Market Segments
            18.1.8.4. Sales Footprint
            18.1.8.5. Strategy Overview
                18.1.8.5.1. Marketing Strategy
                18.1.8.5.2. Product Strategy
                18.1.8.5.3. Channel Strategy
        18.1.9. Victorinox
            18.1.9.1. Overview
            18.1.9.2. Product Portfolio
            18.1.9.3. Profitability by Market Segments
            18.1.9.4. Sales Footprint
            18.1.9.5. Strategy Overview
                18.1.9.5.1. Marketing Strategy
                18.1.9.5.2. Product Strategy
                18.1.9.5.3. Channel Strategy
        18.1.10. Olympia
            18.1.10.1. Overview
            18.1.10.2. Product Portfolio
            18.1.10.3. Profitability by Market Segments
            18.1.10.4. Sales Footprint
            18.1.10.5. Strategy Overview
                18.1.10.5.1. Marketing Strategy
                18.1.10.5.2. Product Strategy
                18.1.10.5.3. Channel Strategy
        18.1.11. Fox Luggage
            18.1.11.1. Overview
            18.1.11.2. Product Portfolio
            18.1.11.3. Profitability by Market Segments
            18.1.11.4. Sales Footprint
            18.1.11.5. Strategy Overview
                18.1.11.5.1. Marketing Strategy
                18.1.11.5.2. Product Strategy
                18.1.11.5.3. Channel Strategy
        18.1.12. Skyway
            18.1.12.1. Overview
            18.1.12.2. Product Portfolio
            18.1.12.3. Profitability by Market Segments
            18.1.12.4. Sales Footprint
            18.1.12.5. Strategy Overview
                18.1.12.5.1. Marketing Strategy
                18.1.12.5.2. Product Strategy
                18.1.12.5.3. Channel Strategy
        18.1.13. Traveler’s Choice
            18.1.13.1. Overview
            18.1.13.2. Product Portfolio
            18.1.13.3. Profitability by Market Segments
            18.1.13.4. Sales Footprint
            18.1.13.5. Strategy Overview
                18.1.13.5.1. Marketing Strategy
                18.1.13.5.2. Product Strategy
                18.1.13.5.3. Channel Strategy
        18.1.14. ACE
            18.1.14.1. Overview
            18.1.14.2. Product Portfolio
            18.1.14.3. Profitability by Market Segments
            18.1.14.4. Sales Footprint
            18.1.14.5. Strategy Overview
                18.1.14.5.1. Marketing Strategy
                18.1.14.5.2. Product Strategy
                18.1.14.5.3. Channel Strategy
        18.1.15. Diplomat
            18.1.15.1. Overview
            18.1.15.2. Product Portfolio
            18.1.15.3. Profitability by Market Segments
            18.1.15.4. Sales Footprint
            18.1.15.5. Strategy Overview
                18.1.15.5.1. Marketing Strategy
                18.1.15.5.2. Product Strategy
                18.1.15.5.3. Channel Strategy
        18.1.16. EMINENT
            18.1.16.1. Overview
            18.1.16.2. Product Portfolio
            18.1.16.3. Profitability by Market Segments
            18.1.16.4. Sales Footprint
            18.1.16.5. Strategy Overview
                18.1.16.5.1. Marketing Strategy
                18.1.16.5.2. Product Strategy
                18.1.16.5.3. Channel Strategy
19. Assumptions & Acronyms Used
20. Research Methodology
Recommendations

Packaging

Bag Market

October 2023

REP-GB-14380

210 pages

Consumer Product

Travel Bags Market

September 2022

REP-GB-1586

250 pages

Explore Packaging Insights

View Reports
Future Market Insights

Trolley Bags Market

Schedule a Call