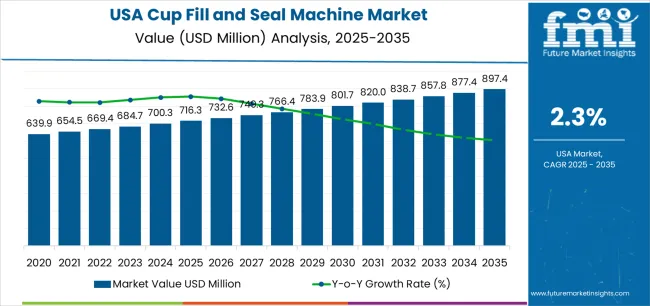
The USA cup fill and seal machine demand is valued at USD 716.3 million in 2025 and is forecasted to reach USD 897.4 million by 2035, based on a CAGR of 2.3%. Demand is influenced by continuous use of pre-formed cup packaging formats across dairy products, ready-to-eat foods, condiments, and single-serve beverage items. Automated filling and sealing systems support production efficiency in high-volume plants by improving portion accuracy, reducing manual handling steps, and maintaining hygiene standards required for perishable goods.
Automatic cup fill and seal systems hold the leading share due to their suitability for continuous-line operations and their compatibility with diverse cup materials, including plastics and paper-based composites. These systems offer controlled dosing, integrated sealing functions, and stable throughput, supporting large packaging runs in food-processing environments. Their adoption is reinforced by the need for consistent seal integrity, extended shelf-life performance, and efficient product changeover capability.
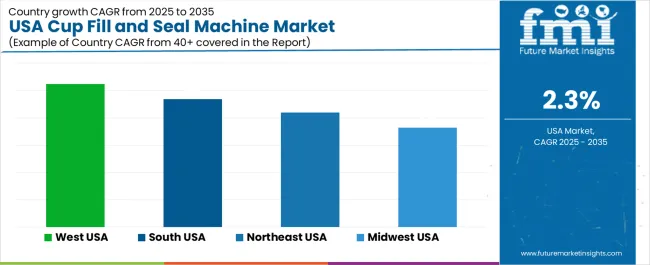
The West, South, and Northeast record the strongest demand, supported by dense clusters of food-processing facilities, distribution networks, and contract packaging operations. These regions maintain significant production capacity for dairy, specialty foods, and single-serve consumer goods, which drives ongoing investment in automated filling equipment. Orics Industries Inc., Ilpra S.p.a., R.A Jones, Serac Group, and Paxiom Group are the principal suppliers. Their offerings cover rotary, in-line, and multi-lane systems used for cups requiring heat sealing, film application, and specialized dosing features.
The early growth curve from 2025 to 2029 shows modest expansion driven by steady demand in dairy, ready-to-eat foods, and single-serve beverage packaging. Facilities focus on improving fill accuracy, hygiene control, and line-changeover efficiency, supporting incremental procurement during the early years. Growth is also shaped by equipment upgrades in mid-sized processing plants that rely on semi-automated or fully automated cup-filling systems.
From 2030 to 2035, the late growth curve shifts toward a slower, more stable trajectory. By this stage, most large processors will have completed key automation and sanitation upgrades, and procurement patterns align with predictable replacement cycles rather than capacity expansion. Late-period growth is supported by incremental improvements in sealing integrity, inline inspection systems, and compatibility with recyclable cup materials. The comparison shows a segment moving from a mild early expansion phase to a mature period defined by operational continuity, long equipment lifecycles, and stable utilisation across USA food and beverage packaging environments.
| Metric | Value |
|---|---|
| USA Cup Fill and Seal Machine Sales Value (2025) | USD 716.3 million |
| USA Cup Fill and Seal Machine Forecast Value (2035) | USD 897.4 million |
| USA Cup Fill and Seal Machine Forecast CAGR (2025-2035) | 2.3% |
The demand for cup fill and seal machines in the USA is growing as food, beverage and dairy manufacturers increase production of single-serve and convenience-oriented items. Ready-to-eat yogurts, salads, desserts and on-the-go snacks require efficient packaging systems that combine filling and sealing in one automated process. Expanded consumption of portion-controlled and retail-packaged products drives investment in equipment that supports high throughput, hygiene and minimal downtime.
Automation and Industry 4.0 trends further enhance uptake as manufacturers look to reduce labour costs, improve operational efficiency and integrate data analytics and remote monitoring into production lines. Ecofriendly and packaging-format shifts such as recyclable cups and flexible lid materials, also boost demand for machines capable of handling new materials and rapid change-overs.
Constraints include considerable capital investment for premium machines, the necessity of specialised tooling for different cup sizes or materials, and supply-chain or retrofit challenges when integrating new machines into legacy production facilities. Smaller producers may defer purchases until return-on-investment is clearly justified.
Demand for cup fill and seal machines in the United States reflects operational needs across dairy, beverage, ready-to-eat food, and specialty packaging lines. Technology choices relate to automation levels, workforce availability, and production stability. Machine-type preferences are shaped by plant layout, throughput expectations, and product-handling requirements. Capacity distribution indicates how manufacturers scale equipment to match production volume, shelf-life needs, and packaging uniformity.
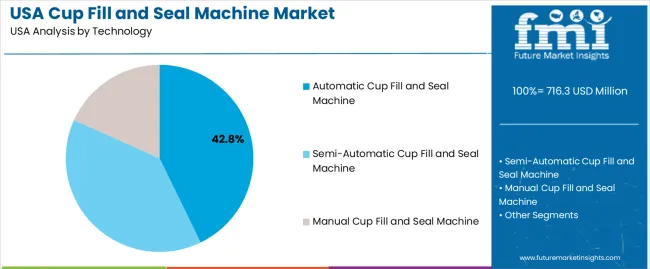
Automatic cup fill and seal machines hold 42.8% of national demand and represent the leading technology category. These systems support high-speed production, consistent filling accuracy, and precise sealing suitable for large-scale dairy, dessert, and beverage operations. Semi-automatic machines represent 38.9%, offering controlled throughput where operators manage key steps such as cup placement or sealing initiation. Manual machines account for 18.3%, used in small-scale operations, pilot production, and specialty lines where flexibility outweighs volume. Technology distribution reflects workforce planning, hygiene requirements, product consistency needs, and variability in batch sizes encountered across USA food-processing environments.
Key drivers and attributes:
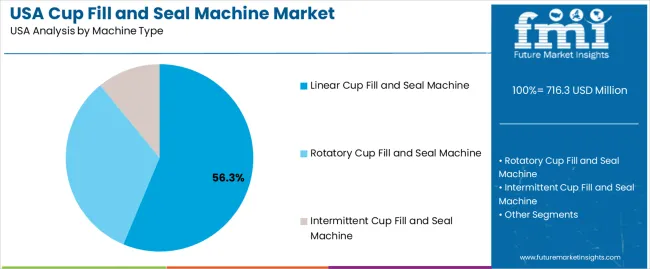
Linear cup fill and seal machines hold 56.3% of national demand and form the dominant machine-type category. Their straightforward design supports multi-stage filling, sealing, and coding in a continuous linear motion suitable for large-scale production. Rotatory machines represent 32.8%, offering compact footprints and efficient cup handling through rotary indexing systems that suit medium-volume operations. Intermittent machines account for 10.9%, supporting specialised products requiring careful dosing or slower sealing cycles. Machine-type distribution reflects production speed requirements, product viscosity, footprint constraints, and workflow integration across automated packaging lines in the USA food sector.
Key drivers and attributes:
Systems with capacities above 2000 cups per hour hold 44.5% of national demand and represent the leading capacity segment. These machines support high-volume production in dairy, beverage, and large-scale prepared-food operations where continuous output and rapid sealing are required. Units producing 1001–2000 cups per hour account for 23.3%, serving medium-size facilities balancing throughput and product diversity. Systems rated up to 1000 cups per hour represent 32.2%, supporting small producers, regional brands, and artisanal manufacturers with flexible batch operations. Capacity distribution reflects facility scale, production planning, and packaging-frequency requirements across USA food-processing lines.
Key drivers and attributes:
Growing single-serve packaging demand, expansion of ready-to-eat food and beverage formats, and rising automation in packaging operations are driving demand.
In the United States, demand for cup fill and seal machines is increasing as food and beverage manufacturers shift toward convenience-oriented, portion-controlled cups for yogurts, desserts, dips, single-serve meals and beverages. These machines enable faster throughput, hygienic sealing and compatibility with multi-compartment cups, which suits the evolving product trends. The need to reduce labour costs, improve packaging precision and comply with higher food-safety standards further encourages deployment of automated cup fill and seal systems. The rise of plant-based formulations, functional beverages and premium dairy snacks also supports investment in filling machines capable of handling varied product viscosities and cup sizes.
High machine cost, short lifecycle of packaging formats and rising demand for flexible alternatives restrain growth.
Cup fill and seal machines represent a significant capital investment including tooling changes, automation integration and maintenance, which may deter smaller manufacturers or startups. Packaging formats and consumer preferences shift quickly, making some machine proofing obsolete if cup sizes or materials change, which slows adoption. Some producers may prefer flexible pouch formats, bag-in-box systems or tray-based packaging instead of cups, especially when they need minimal investment or quick changeovers, thus limiting potential machine installations in certain segments.
Trend toward smart, modular fill-seal platforms, growing demand for multi-compartment and ecofriendly cup packaging, and higher adoption in emerging food categories define the industry outlook.
Machine suppliers are offering modular cup fill and seal systems that support faster changeover between cup sizes and materials, remote monitoring and predictive maintenance which enhance uptime and flexibility. Multi-compartment cups (e.g., yogurt + granola, salad + dressing) and cup formats designed for clean-label and plant-based products are increasing adoption of more advanced machinery. Sustainability pressures are driving cup fill and seal machines compatible with recyclable or compostable cup materials and lightweight sealing films. Growth is especially strong in niche food categories like functional snacks, grab-and-go meals and smaller batch premium desserts where cup format packaging is preferred.
Demand for cup fill and seal machines in the USA is increasing through 2035 as dairy processors, dessert manufacturers, ready-to-eat food producers, and beverage fillers continue adopting automated portion-packaging systems. These machines support efficient filling and sealing of yogurt cups, pudding containers, single-serve beverages, prepared dips, and nutraceutical portions. Growth is linked to expansion in convenience foods, stricter hygiene requirements, and the shift toward modular filling lines that handle multiple cup formats. Automation reduces labor dependence and improves uniformity in high-volume plants. Regional differences reflect food-processing density, distribution-center activity, and investment in modern manufacturing lines. The West leads with 2.6% CAGR, followed by the South (2.3%), the Northeast (2.1%), and the Midwest (1.8%).
| Region | CAGR (2025-2035) |
|---|---|
| West | 2.6% |
| South | 2.3% |
| Northeast | 2.1% |
| Midwest | 1.8% |
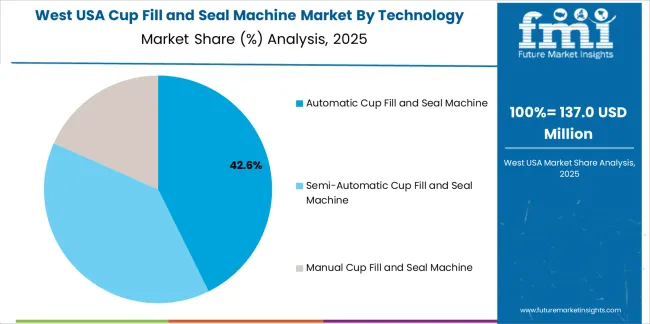
The West grows at 2.6% CAGR, supported by strong activity in dairy processing, specialty food production, plant-based product manufacturing, and single-serve beverage packaging across California, Washington, and Oregon. Facilities in these states invest in automated filling systems to meet hygiene requirements, maintain fill accuracy, and support multi-flavor product runs. Producers of yogurt, smoothies, refrigerated desserts, and functional beverages adopt machines capable of rapid changeovers to handle seasonal or limited-edition items. Packaging plants integrate inline sealers and contamination-control features to align with regional food-safety standards. Consistent demand for convenience foods reinforces investment in reliable cup-filling equipment.
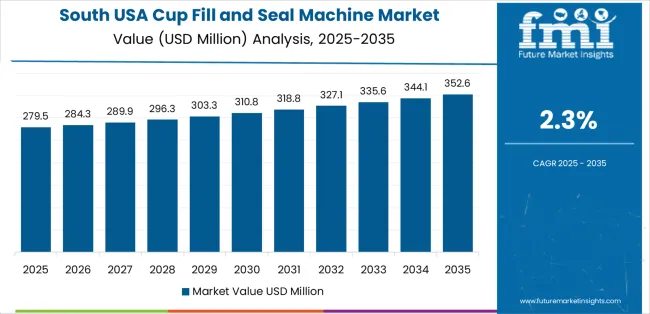
The South grows at 2.3% CAGR, supported by expanding food-processing clusters across Texas, Georgia, Florida, and the Carolinas. Large dairy facilities and refrigerated-food manufacturers use cup fill and seal machines to support extensive single-serve packaging operations. Snack and dessert makers adopt automated equipment to increase line throughput and maintain consistent portioning. Regional distribution hubs supply retailers and food-service operators, driving demand for uniform packaging. Manufacturers of dips, sauces, and shelf-stable items rely on flexible filling systems capable of handling varied viscosities. Investment is reinforced by population growth and strong supermarket supply needs.
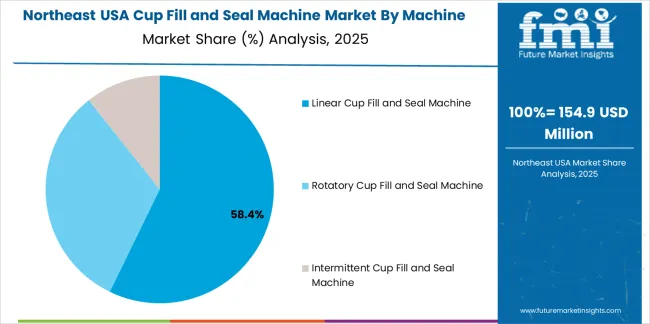
The Northeast grows at 2.1% CAGR, supported by established dairy producers, specialty-food manufacturers, and institutional suppliers across New York, Pennsylvania, New Jersey, and Massachusetts. Facilities produce yogurt cups, pudding portions, ready-to-eat breakfast items, and meal-kit components that depend on accurate filling and contamination-controlled sealing. Small and mid-sized plants adopt compact filling units to support limited production space while maintaining hygiene standards. Manufacturers serving school systems, hospitals, and food-service providers rely on multi-lane machines for high-volume packaging. Although growth is moderate, dense populations and strong institutional demand sustain steady equipment adoption.
The Midwest grows at 1.8% CAGR, influenced by large agricultural processing bases, dairy operations, and packaged-food producers across Wisconsin, Minnesota, Illinois, Indiana, and Ohio. Plants use cup fill and seal equipment for yogurt, cottage cheese, dips, and refrigerated snack packaging. Manufacturers emphasize reliability, consistent fill weight, and equipment durability to support continuous multi-shift operations. Some facilities integrate semi-automatic systems for smaller product batches, while larger plants adopt fully automated lines for high-volume items. Although growth is slower, established dairy production and packaged-food demand maintain ongoing equipment procurement.
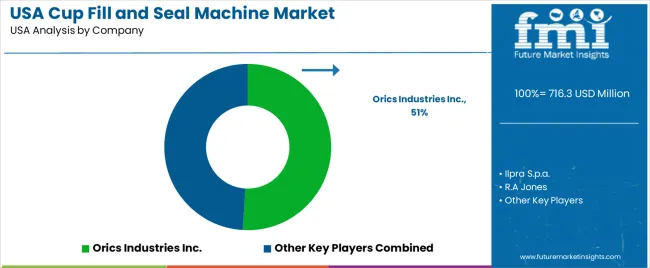
Demand for cup fill and seal machines in the USA is shaped by a concentrated group of packaging-equipment manufacturers serving dairy products, prepared foods, beverages, and portion-controlled items. Orics Industries Inc. holds the leading position with an estimated 50.9% share, supported by controlled filling accuracy, consistent sealing integrity, and long-standing supply relationships with USA food processors. Its position is reinforced by stable machine uptime, predictable sanitation performance, and reliable integration with automated packaging lines.
Ilpra S.p.a. and R.A Jones follow as significant participants, offering rotary and inline systems suited to medium- and high-speed production environments. Their strengths include dependable volumetric control, consistent seal uniformity, and flexibility across yogurt, dips, sauces, and ready-meal applications. Serac Group maintains a notable presence through precision filling modules and hygienic sealing designs that support extended-shelf-life products and clean-room operations. Paxiom Group contributes additional capability with modular cup-filling and sealing units tailored to small and mid-sized processors requiring compact footprints, simplified changeovers, and reliable daily performance.
Competition across this segment centers on filling accuracy, seal integrity, hygiene control, changeover efficiency, and equipment reliability under continuous operation. Demand remains strong as USA food producers expand portion-controlled packaging, emphasise contamination prevention, and adopt automated cup fill and seal systems that ensure consistent product quality, reduced labour dependence, and compliance with food-safety requirements.
| Items | Values |
|---|---|
| Quantitative Units | USD million |
| Technology | Automatic Cup Fill and Seal Machine, Semi-Automatic Cup Fill and Seal Machine, Manual Cup Fill and Seal Machine |
| Machine Type | Linear Cup Fill and Seal Machine, Rotatory Cup Fill and Seal Machine, Intermittent Cup Fill and Seal Machine |
| Capacity | Up to 1000 Cups/Hour, 1001–2000 Cups/Hour, Above 2000 Cups/Hour |
| End Use | Food, Beverages |
| Regions Covered | West, Midwest, South, Northeast |
| Key Companies Profiled | Orics Industries Inc., Ilpra S.p.a., R.A Jones, Serac Group, Paxiom Group |
| Additional Attributes | Dollar sales by technology, machine type, capacity, and end-use categories; regional adoption trends across West, Midwest, South, and Northeast; competitive landscape of filling and sealing equipment manufacturers; advancements in hygienic filling systems, high-speed automation, CIP-ready units, and multi-lane sealing; integration with dairy, dessert, beverage, and ready-to-eat food processing operations in the USA. |
The global demand for cup fill and seal machine in USA is estimated to be valued at USD 716.3 million in 2025.
The market size for the demand for cup fill and seal machine in USA is projected to reach USD 897.4 million by 2035.
The demand for cup fill and seal machine in USA is expected to grow at a 2.3% CAGR between 2025 and 2035.
The key product types in demand for cup fill and seal machine in USA are automatic cup fill and seal machine, semi-automatic cup fill and seal machine and manual cup fill and seal machine.
In terms of machine type, linear cup fill and seal machine segment to command 56.3% share in the demand for cup fill and seal machine in USA in 2025.


Our Research Products

The "Full Research Suite" delivers actionable market intel, deep dives on markets or technologies, so clients act faster, cut risk, and unlock growth.

The Leaderboard benchmarks and ranks top vendors, classifying them as Established Leaders, Leading Challengers, or Disruptors & Challengers.

Locates where complements amplify value and substitutes erode it, forecasting net impact by horizon

We deliver granular, decision-grade intel: market sizing, 5-year forecasts, pricing, adoption, usage, revenue, and operational KPIs—plus competitor tracking, regulation, and value chains—across 60 countries broadly.

Spot the shifts before they hit your P&L. We track inflection points, adoption curves, pricing moves, and ecosystem plays to show where demand is heading, why it is changing, and what to do next across high-growth markets and disruptive tech

Real-time reads of user behavior. We track shifting priorities, perceptions of today’s and next-gen services, and provider experience, then pace how fast tech moves from trial to adoption, blending buyer, consumer, and channel inputs with social signals (#WhySwitch, #UX).

Partner with our analyst team to build a custom report designed around your business priorities. From analysing market trends to assessing competitors or crafting bespoke datasets, we tailor insights to your needs.
Supplier Intelligence
Discovery & Profiling
Capacity & Footprint
Performance & Risk
Compliance & Governance
Commercial Readiness
Who Supplies Whom
Scorecards & Shortlists
Playbooks & Docs
Category Intelligence
Definition & Scope
Demand & Use Cases
Cost Drivers
Market Structure
Supply Chain Map
Trade & Policy
Operating Norms
Deliverables
Buyer Intelligence
Account Basics
Spend & Scope
Procurement Model
Vendor Requirements
Terms & Policies
Entry Strategy
Pain Points & Triggers
Outputs
Pricing Analysis
Benchmarks
Trends
Should-Cost
Indexation
Landed Cost
Commercial Terms
Deliverables
Brand Analysis
Positioning & Value Prop
Share & Presence
Customer Evidence
Go-to-Market
Digital & Reputation
Compliance & Trust
KPIs & Gaps
Outputs
Full Research Suite comprises of:
Market outlook & trends analysis
Interviews & case studies
Strategic recommendations
Vendor profiles & capabilities analysis
5-year forecasts
8 regions and 60+ country-level data splits
Market segment data splits
12 months of continuous data updates
DELIVERED AS:
PDF EXCEL ONLINE
Cup Fill and Seal Machine Market by Automation Level from 2025 to 2035
Industry Share Analysis for Cup Fill and Seal Machine Companies
Cup Filling Machines Market Forecast and Outlook 2025 to 2035
Pick Fill Seal Machines Market Size, Share & Forecast 2025 to 2035
Market Positioning & Share in the Form Fill Seal Machine Industry
Form Fill Seal Machine Market Analysis by Semi-automatic and Automatic Through 2034
Filling and Sealing Machine Market Size and Share Forecast Outlook 2025 to 2035
Thermoform Fill Sealing Machine Market Size and Share Forecast Outlook 2025 to 2035
Industry Share Analysis for Thermoform Fill Sealing Machine Providers
Carton Form Fill Seal Machine Market
Vertical Form Fill Seal VFFS Machine Market Size and Share Forecast Outlook 2025 to 2035
Tubular Form Fill and Seal Machines Market Size and Share Forecast Outlook 2025 to 2035
Automated Tray Fill and Seal Machines Market Size and Share Forecast Outlook 2025 to 2035
Competitive Overview of Automated Tray Fill and Seal Machines Companies
Horizontal Form Fill Seal (HFFS) Machines Market Size and Share Forecast Outlook 2025 to 2035
Cup Filler Market
Cupcake Tray Machines Market
Form-Fill-Seal (FFS) Films Market Size and Share Forecast Outlook 2025 to 2035
Blow Fill Seal Technology Market Size and Share Forecast Outlook 2025 to 2035
Blow-fill-seal Equipment Market Size and Share Forecast Outlook 2025 to 2035

Thank you!
You will receive an email from our Business Development Manager. Please be sure to check your SPAM/JUNK folder too.
Chat With
MaRIA