

- Market Size (2026)
- USD 966.3 Mn
- Forecast (2036)
- USD 2266.5 Mn
- CAGR (2026 to 2036)
- 8.9%
How big is the Urology Ablation Devices Market in 2026?
USD 966.3 million in 2026 and USD 2,266.5 million by 2036 at an 8.9% CAGR
Sales of urology ablation devices are projected to rise from USD 966.3 million in 2026 to USD 2,266.5 million by 2036, expanding at 8.9% CAGR from 2026 to 2036, reinforced by procedures that protect nearby urinary structures. NIDDK reported in June 2024 that BPH affects 29% to 33% of men aged 65 and older. The prevalence creates a recurring case base for benign prostatic hyperplasia treatment, but adoption depends on durable symptom relief and workable procedure economics.
Country economics differ because the United States supports broad private and public purchasing, whereas Japan places greater weight on compact workflows for an older population. Hospitals must align imaging access with anesthesia support and emergency escalation before adding a new tissue-ablation pathway. The forecast creates USD 1,300.2 million in incremental revenue between 2026 and 2036, aided by broader use across benign and oncology pathways. American Cancer Society estimates published in January 2026 placed new USA prostate cancer cases at 333,830 for that year. The volume supports investment in focal prostate cancer treatment, although capital approval remains easier for systems that serve both benign and oncology programs.
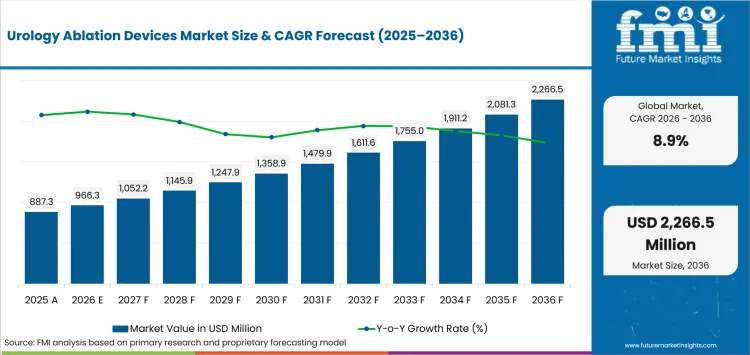
| Metric | Value |
|---|---|
| 2025 Market Size | USD 887.3 million |
| 2026 Market Size | USD 966.3 million |
| 2036 Market Size | USD 2,266.5 million |
| Forecast CAGR (2026-2036) | 8.9% |
| Technology Focus | Radiofrequency Ablation |
| Radiofrequency Ablation Share (2026) | 34.5% |
| Application Focus | Benign Prostatic Hyperplasia |
| Benign Prostatic Hyperplasia Share (2026) | 35.8% |
| End User Focus | Hospitals |
| Hospitals Share (2026) | 53.4% |
Summary of the Urology Ablation Devices Market
| Market Signal | Commercial Impact |
|---|---|
| Demand and Growth Drivers | Targeted tissue ablation is moving deeper into routine urology pathways because hospitals can address BPH and selected localized cancers without treating every patient through extensive surgery.
|
| Product and Segment View | The segment structure reflects four purchasing questions: energy source, clinical condition, care setting, and European country mix.
|
| Geography and Growth Outlook | Country performance follows aging profiles and specialist capacity because urology ablation requires trained teams and procedure-specific infrastructure.
|
| Competitive Landscape | Competition is divided by treatment method and clinical pathway, which makes product fit more important than broad corporate scale.
|
| Analyst Perspective | Procedure economics should be assessed by completed cases and clinical fit rather than by the number of systems installed.
|
Source: FMI's proprietary forecasting model and primary research.
How is the urology ablation devices market segmented?
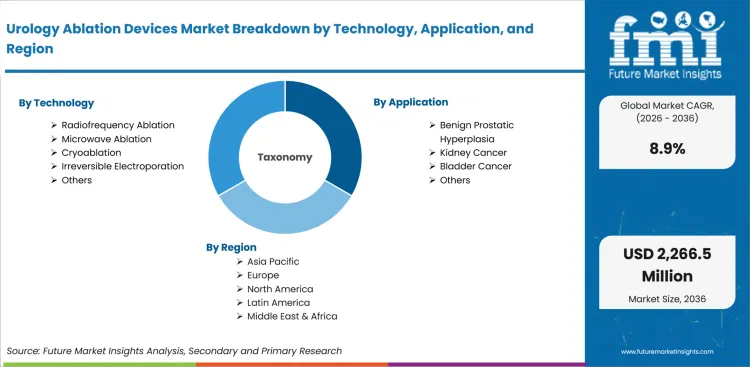
The market is segmented by Technology, Application, End User, and Region across the 2026 to 2036 forecast period.
The segmentation framework separates the energy mechanism from the clinical condition and the place where treatment is delivered. Technology analysis covers radiofrequency and microwave systems together with cryoablation and irreversible electroporation for targeted urologic tissue treatment. Application analysis distinguishes BPH from kidney cancer and bladder cancer because patient selection and treatment goals differ. End-user analysis compares hospitals with ambulatory surgical centers and specialty clinics through imaging support and escalation capacity.
Regional analysis considers demographics and reimbursement alongside specialist availability across each national healthcare system and care network. European country analysis separates Germany from the UK, France, Italy, Spain, and the rest of Europe because purchasing structures differ. The broader ablation devices category provides useful context, but urology purchasing depends on organ-specific evidence and access requirements.
What supports demand for Radiofrequency Ablation within the Technology category?
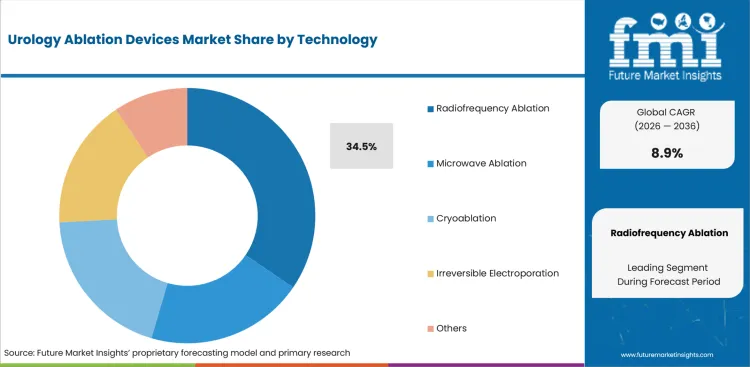
Radiofrequency systems remain familiar to urology departments because electric current can generate controlled heat or create water vapor for targeted tissue treatment. The USA Food and Drug Administration issued a 510(k) summary in June 2025 for the Rezum System. The device uses radiofrequency current to generate thermal energy as water vapor for BPH treatment. The clearance record gives hospital value-analysis committees a direct regulatory basis for assessing this modality. Related radiofrequency ablation systems differ in electrode design and monitoring requirements, so organ-specific evidence remains necessary.
- By technology, Radiofrequency Ablation is projected to account for 34.5% share in 2026, supported by familiar generator controls and thermal-energy training across hospital departments. The modality separates reusable equipment from disposable delivery components that create different budgeting and inventory requirements. Hospital finance teams can assess recurring costs and service needs before approving wider use across routine urology schedules.
- Urology departments purchase radiofrequency platforms for cases that need controlled tissue heating and predictable disposable supply. Shared generator training can reduce implementation work across procedure teams and simplify competency planning for clinical staff. Contract value improves when service coverage and electrode availability remain consistent across the clinical departments using the platform during routine scheduling.
How does Benign Prostatic Hyperplasia shape demand within the Application category?
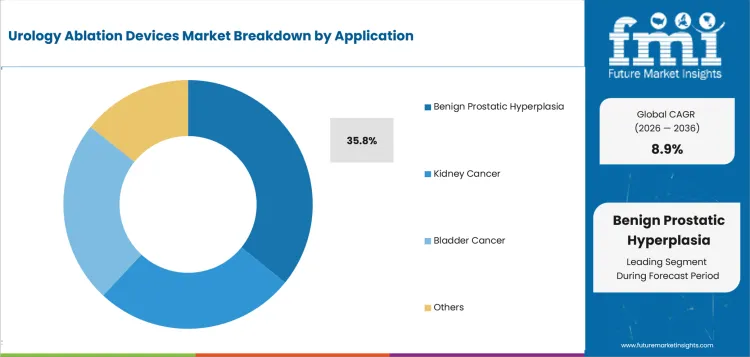
BPH creates a broad treatment pool because prostate enlargement becomes more common with age and symptoms can progress despite medication. PROCEPT BioRobotics stated in April 2025 that BPH affects approximately 40 million men in the United States. The figure supports minimally invasive options that reduce obstructive tissue without the recovery burden of extensive surgery. Commercial performance still depends on durable symptom control and patient-selection rules that clinicians can apply consistently in routine practice. The water vapor ablation pathway illustrates how device choice is linked to anatomy and retreatment planning.
- Based on application, Benign Prostatic Hyperplasia is estimated to account for 35.8% share in 2026, attributable to age-linked symptom burden and the treatment gap between medication and extensive surgery. The segment depends on repeat referrals and durable symptom outcomes that support continued use across hospital and ambulatory care pathways.
- Urologists assess BPH systems through prostate-size indications and catheter requirements together with carefully measured sexual-function outcomes. Procedure time must fit routine scheduling, and follow-up requirements must remain practical for local clinics and referring physicians. Platforms that meet both conditions can generate repeat disposable demand without forcing every eligible patient into an operating-room pathway.
What makes Hospitals central to the End User category?
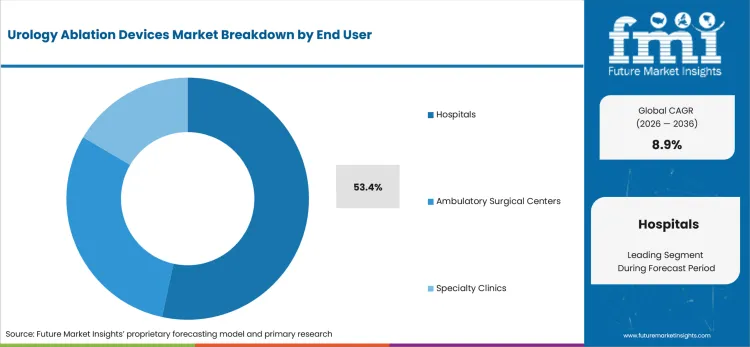
Hospitals can combine urology and radiology resources in ways that smaller centers cannot always reproduce. PROCEPT BioRobotics reported in February 2026 that its USA installed base reached 718 robotic systems at year-end 2025, up 42% from the prior year. The figures show how urology platforms develop through capital programs and recurring procedure use rather than isolated equipment purchases. Hospital demand depends on room access and case throughput alongside physician training and post-procedure support capacity. Investment in tumour ablation devices follows similar utilization tests across image-guided oncology service lines in hospitals.
- In 2026, Hospitals are forecast to represent 53.4% share, reinforced by access to imaging and anesthesia support together with multidisciplinary review for higher-risk cases. The share reflects the need to manage complications and coordinate post-procedure care within facilities that support several ablation methods and escalation pathways.
- Academic medical centers and regional hospitals favor systems that fit established imaging and sterile-processing workflows. A new platform earns approval more easily when room access and trained staff can support realistic annual case volume. Dedicated capital becomes harder to defend when the device depends on one narrow procedure pathway and limited referrals.
What are the drivers, restraints, and opportunities in the urology ablation devices market?
Clinical evidence supports broader focal treatment; imaging and procedure costs constrain site expansion; robotic BPH systems create a commercial opening for structured service-line growth.
- Driver: Peer-reviewed outcomes give hospital committees clearer evidence for approving tissue-sparing prostate ablation programs across carefully selected patient groups.
- Restraint: Dedicated imaging access and procedure-specific infrastructure can limit utilization outside hospitals with coordinated radiology and urology capacity.
- Opportunity: BPH service lines can add targeted ablation platforms that match distinct anatomy and recovery preferences.
Growing acceptance of focal ablation in clinical and purchasing decisions is strengthening demand for urology ablation systems. EDAP TMS S.A. announced in January 2025 that it sold 11 Focal One systems during the fourth quarter of 2024 and recorded 30% year-over-year growth in USA procedures. The result ties clinical interest to actual system demand and gives hospital committees a measurable commercial reference point. Hospitals can use the evidence to compare functional outcomes and local utilization before approving a prostate health program.
High infrastructure requirements for advanced image-guided ablation procedures continue to constrain wider market adoption. Profound Medical stated in its February 2026 coding guide that TULSA-PRO uses real-time MRI and MR thermometry during focused ultrasound ablation. The workflow preserves treatment control, but it ties procedures to scanner availability and cross-department scheduling. Sites without dedicated imaging time may struggle to achieve enough cases for acceptable capital returns, even with clear clinical interest and trained urologists.
Expanding image-guided prostate ablation into underserved healthcare markets presents a significant growth opportunity for device manufacturers. Profound Medical announced in November 2025 an exclusive Saudi Arabian distribution agreement for TULSA-PRO with Al Faisaliah Medical Systems. The agreement addresses sales and installation together with service access through a defined national channel for participating hospitals. Commercial progress depends on local training capacity and predictable procedure volumes after installation across the supported health systems.
Which country CAGRs are profiled in the urology ablation devices market?
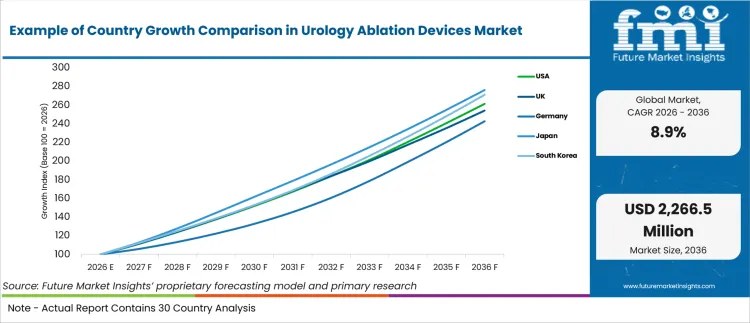
| Country | CAGR |
|---|---|
| USA | 10.1% |
| UK | 9.8% |
| Germany | 9.3% |
| Japan | 10.7% |
| South Korea | 10.5% |
How do country-level CAGRs compare in the urology ablation devices market?
The country comparison spans only 1.4 percentage points yet clear differences appear between the national adoption models. Japan and South Korea form a compact upper cluster separated by just 0.2 points. The USA and UK create a closely aligned middle group despite different reimbursement and purchasing systems. Germany occupies a measured lower position shaped by insurer review and hospital investment requirements. These differences reflect procedural capacity and platform access rather than patient demographics alone.
- Japan benefits from concentrated specialist hospitals that evaluate image-guided ablation for older patients requiring less invasive treatment.
- South Korea remains close to Japan through rapid technology assessment and strong tertiary urology capacity.
- The USA supports several BPH and focal prostate platforms across outpatient centers and hospital-based urology departments.
- UK adoption depends on public evidence review and whether ablation reduces admissions or repeated treatment burdens.
- Germany requires insurer acceptance and trained hospital teams before ablation systems gain broader procedural use.
Comparable CAGRs still produce different entry conditions because screening volumes do not automatically become eligible ablation procedures. Suppliers must align training and reimbursement evidence with each country’s diagnostic pathway and follow-up requirements. The full report provides country-level CAGR analysis across North America, Latin America, Europe, East Asia, South Asia, Oceania and the Middle East and Africa.
- Japan has a large older population and a hospital system that can concentrate complex urology procedures in specialist centers. Adoption is projected to expand at 10.7% CAGR through 2036, driven by age-linked prostate disease and demand for treatments that preserve daily function. The Statistics Bureau of Japan reported in September 2025 that 36.24 million people were aged 65 or older in 2024, equal to 29.3% of the population. The demographic base supports case growth, but hospitals still need clear evidence on retreatment and imaging time. Japanese urology departments therefore need systems that fit compact workflows and established follow-up practices across specialist hospital networks.
- South Korea evaluates new medical technology through concentrated tertiary hospitals and a comparatively structured equipment-review cycle. The Ministry of the Interior and Safety reported in December 2024 that 10,244,550 residents were aged 65 or older. The total represented 20.00% of the registered population and expanded the age-linked BPH treatment pool. Urology ablation demand is forecast to rise at 10.5% CAGR over the forecast period, supported by an older patient base and centralized specialist care. Hospitals must still align reimbursement rules with patient selection and documented follow-up requirements before expanding procedure capacity. Korean centers therefore need platforms that combine imaging guidance with repeatable procedure planning and dependable technical support.
- The United States offers broad access to BPH devices and focal prostate platforms across academic and community health systems. The USA Census Bureau reported in June 2025 that the population aged 65 and older rose 3.1% to 61.2 million during 2024. The USA is estimated to post 10.1% CAGR by 2036, attributable to a large procedure base and multiple commercial treatment options. The demographic shift expands the pool of men with age-linked prostate conditions, yet local payment and staffing determine utilization. Health systems should compare disposable costs and retreatment evidence before standardizing one platform across several sites during phased rollout.
- The UK market develops through evidence review and hospital procurement rather than rapid equipment placement across independent sites. Urology ablation sales are anticipated to advance at 9.8% CAGR during the forecast period, underpinned by an aging population and demand for shorter-recovery procedures. The Office for National Statistics reported in September 2025 that the population aged 65 and older increased by 1.8% in England during the year to mid-2024. The shift supports BPH demand, but scanner access and public budgets can delay capital approval. NHS trusts need service-line evidence that links case volume with theatre time and follow-up capacity across annual budgets.
- Germany combines a broad hospital network with established urology and radiology capacity across regional centers. Destatis reported in December 2025 that one person in four in Germany is expected to be aged 67 or older by 2035. The sector is forecast to record 9.3% CAGR between 2026 and 2036, reinforced by aging demographics and specialist infrastructure. Over the forecast period, Germany is estimated to account for 35.9% share of Europe in 2026, aided by its treatment capacity and equipment base. Device manufacturers need local training and reimbursement support because decentralized purchasing can produce uneven adoption across federal states over time.
Who are the notable companies in the urology ablation devices market?
Notable companies include Boston Scientific, AngioDynamics, PROCEPT BioRobotics, Profound Medical, EDAP TMS S.A., Francis Medical, and Olympus Corporation.
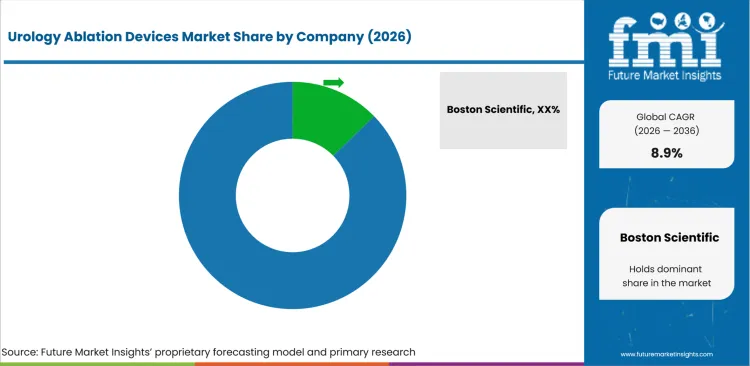
Competition is organized around distinct tissue-removal methods rather than one standard device architecture across all clinical pathways. Boston Scientific serves BPH through water vapor and supports renal cryoablation, while AngioDynamics addresses focal prostate tissue through irreversible electroporation. PROCEPT BioRobotics uses robotic waterjet removal through Aquablation therapy for BPH, and Profound Medical combines ultrasound ablation with MRI guidance. EDAP TMS S.A. supplies robotic HIFU for prostate tissue, while Francis Medical develops water vapor therapy for localized prostate cancer. Olympus Corporation supports plasma vaporization in BPH and bladder workflows, while the adjacent cryosurgical equipment category remains relevant for renal tumor procedures.
- Boston Scientific competes through Rezum water vapor therapy for BPH and ICEfx cryoablation for prostate and kidney tissue. The platforms use separate care models that require different clinical staffing plans and different site infrastructure requirements. Hospitals therefore evaluate office-based prostate use independently from image-guided cryoablation capacity and disposable needle supply.
- AngioDynamics and EDAP TMS S.A. focus on focal prostate treatment through nonthermal electroporation and high-intensity focused ultrasound. Their commercial cases depend on precise lesion targeting and functional outcomes together with documented follow-up evidence. Hospitals need separate training plans because each platform uses a different energy-delivery method and treatment-planning process.
- PROCEPT BioRobotics and Profound Medical place imaging and treatment planning at the center of the procedure. Their systems can differentiate a urology service line, but room access and trained teams influence achievable utilization. Capital approval is easier when annual case forecasts include imaging time and dependable service coverage.
- Francis Medical remains in clinical development for localized prostate cancer, while Olympus Corporation has an established plasma platform for BPH and bladder procedures. The companies address different purchasing stages and evidence requirements across their respective urology treatment pathways. Francis Medical depends on trial progress, whereas Olympus competes through an existing hospital equipment channel.
Competitive Benchmarking: Urology Ablation Devices Market
| Company | BPH Tissue Ablation | Focal Prostate Ablation | Image-Guided Planning | Thermal or Cryogenic Breadth | Geographic Reach |
|---|---|---|---|---|---|
| Boston Scientific | High | Low | Medium | High | North America, Europe, and Asia-Pacific |
| AngioDynamics | Low | High | Medium | Low | United States, Canada, and European Union |
| PROCEPT BioRobotics | High | Low | High | Low | United States, UK, EU, Canada, Japan, China, and Australia |
| Profound Medical | Medium | High | High | Medium | North America, Europe, Saudi Arabia, and Australasia |
| EDAP TMS S.A. | Low | High | High | Medium | United States, Europe, and selected international markets |
| Francis Medical | Low | Medium | Medium | Medium | United States clinical-trial sites |
| Olympus Corporation | High | Low | Low | Medium | Global hospital urology channel |
Ratings reflect verified product scope and workflow capability within urology ablation. Geographic reach describes documented commercial or clinical presence.
Key Developments in the Urology Ablation Devices Market
- July 2025, AngioDynamics announced publication of the PRESERVE study in European Urology and made peer-reviewed evidence available to hospital purchasing committees. The study assessed NanoKnife irreversible electroporation for prostate tissue ablation in 121 patients across 17 clinical sites. The publication gives hospital committees a peer-reviewed basis for comparing nonthermal focal ablation with established thermal options. Commercial uptake still depends on patient selection and follow-up pathways that can document functional outcomes over time.
- February 2025, Francis Medical completed enrollment in the VAPOR 2 pivotal study for its Vanquish water vapor treatment. The study included 235 patients with intermediate-risk localized prostate cancer across 26 USA clinical sites. Completion moved the company closer to a regulatory submission and created a larger evidence base for water vapor prostate ablation. The program remains dependent on regulatory review and long-term outcomes that support carefully selected patient use.
- January 2026, Profound Medical reported that the TULSA-PRO installed base reached 78 systems at the end of 2025, while 97 additional systems were in qualified sales stages. The figures show that MRI-guided prostate ablation is developing through structured hospital capital programs and qualified sales pipelines. Hospitals still need enough eligible cases and scanner access to convert the installed base into repeat procedure revenue and dependable service-line utilization.
- March 2026, PROCEPT BioRobotics announced the international launch of the HYDROS Robotic System in the UK for Aquablation therapy. The company stated that further international expansion across additional healthcare systems was planned during 2026. The launch broadens competitive pressure in BPH treatment by adding an image-guided robotic waterjet option. Commercial success depends on surgeon training and repeatable case volumes after installation across participating hospital networks.
Key Players in the Urology Ablation Devices Market
BPH Tissue Ablation and Removal Platforms
- Boston Scientific
- PROCEPT BioRobotics
- Olympus Corporation
Focal Prostate Tissue Ablation Platforms
- AngioDynamics
- Profound Medical
- EDAP TMS S.A.
- Francis Medical
Urology Ablation Devices Market - Report Scope
| Coverage field | Report scope |
|---|---|
| Market breakdown | Technology, application, end user, and region. |
| Quantitative Units | Revenue in USD Million, CAGR in %. |
| Market Definition | The market covers devices and related disposables that destroy targeted urologic tissue through thermal, cryogenic, ultrasound, water vapor, waterjet, or irreversible electroporation methods. |
| Regions Covered | North America, Latin America, Europe, East Asia, South Asia, Oceania, and Middle East and Africa. |
| Countries Covered | USA, UK, Germany, Japan, South Korea, and 30+ countries within the regional model. |
| Key Companies Profiled | Boston Scientific, AngioDynamics, PROCEPT BioRobotics, Profound Medical, EDAP TMS S.A., Francis Medical, Olympus Corporation. |
| Forecast Period | 2026 to 2036. |
| Approach | Hybrid bottom-up and top-down market sizing supported by primary interviews and official desk research. |
Urology Ablation Devices Market - Research Methodology
| Method | Approach |
|---|---|
| Primary Research | FMI analysts gathered input from manufacturers, service providers, technology developers, distributors, end users, procurement teams, and subject-matter experts. Interviews examined purchasing decisions, product or service evaluation, adoption barriers, approval requirements, pricing considerations, and expectations for technical or commercial support. Respondents were also asked what evidence is required before a trial, pilot, or initial order develops into regular purchasing. |
| Desk Research | Desk research covered government statistics, regulatory publications, trade data, industry associations, technical literature, standards, company filings, product information, and official corporate announcements. Sources were reviewed for relevance, publication date, geographic coverage, and consistency with the defined market scope. Claims relating to performance, applications, approvals, capacity, investment, and commercial activity were retained only when supported by credible public evidence. |
| Market Sizing and Forecasting | The market model combined the baseline value with historical performance, segment structure, pricing and volume indicators, adoption levels, company participation, and country-level demand conditions. Forecast assumptions considered economic activity, investment trends, regulatory developments, technology adoption, purchasing cycles, supply availability, and barriers to wider market use. Segment and regional estimates were reconciled before the final market total was calculated. |
| Data Validation | Estimates were checked against multiple independent indicators, including public data, company activity, trade patterns, industry developments, and findings from primary interviews. Validation also tested whether products, services, applications, and company revenues fell within the defined market boundaries. Adjacent categories, unsupported claims, overlapping revenues, and activities without direct market relevance were excluded to reduce double counting and maintain consistency across segments and countries. |
Urology Ablation Devices Market by Segments
By Technology
- Radiofrequency Ablation
- Microwave Ablation
- Cryoablation
- Irreversible Electroporation
- Others
By Application
- Benign Prostatic Hyperplasia
- Kidney Cancer
- Bladder Cancer
- Others
By End User
- Hospitals
- Ambulatory Surgical Centers
- Specialty Clinics
By European Country
- Germany
- UK
- France
- Italy
- Spain
- Rest of Europe
Urology Ablation Devices Market by Region:
- North America
- USA
- Canada
- Latin America
- Brazil
- Mexico
- Argentina
- Rest of Latin America
- Europe
- Germany
- UK
- France
- Italy
- Spain
- Rest of Europe
- East Asia
- Japan
- South Korea
- China
- South Asia
- India
- Thailand
- Indonesia
- Malaysia
- Rest of South Asia
- Oceania
- Australia
- New Zealand
- Middle East and Africa
- GCC Countries
- South Africa
- Türkiye
- Rest of Middle East and Africa
Research Sources and Bibliography
- American Cancer Society. (2026, January). Key Statistics for Prostate Cancer.
- National Institute of Diabetes and Digestive and Kidney Diseases. (2024, June). Enlarged Prostate (Benign Prostatic Hyperplasia).
- USA Food and Drug Administration. (2025, June 11). Rezum System 510(k) Summary, K250584.
- USA Census Bureau. (2025, June 26). Older Adults Outnumber Children in 11 States and Nearly Half of USA Counties.
- Office for National Statistics. (2025, September 26). Population Estimates for the UK, England, Wales, Scotland and Northern Ireland: Mid-2024.
- Federal Statistical Office of Germany. (2025, December 11). By 2035, One Quarter of Germany’s Population Will Be Aged 67 or Older.
- Statistics Bureau of Japan. (2025, September). Statistical Handbook of Japan 2025.
- Ministry of the Interior and Safety of South Korea. (2024, December 24). 65세 이상 인구 비중 20% 기록 [Population aged 65 and older records a 20% share].
- EDAP TMS S.A. (2025, January 13). EDAP Announces Preliminary Record Fourth Quarter Focal One System Sales and Record USA Procedures.
- AngioDynamics. (2025, July 23). AngioDynamics Announces Publication of PRESERVE Study of NanoKnife System for Prostate Tissue Ablation in European Urology.
- Francis Medical. (2025, February 25). Completion of VAPOR 2 Enrollment for Vanquish Prostate Cancer Treatment.
- Profound Medical. (2026, January 12). Profound Surpasses 2025 TULSA-PRO Installed Base Goal.
- Profound Medical. (2026, February). TULSA-PRO Coding and Billing Guide.
- PROCEPT BioRobotics. (2026, March 12). PROCEPT BioRobotics Announces International Launch of the HYDROS Robotic System.
- PROCEPT BioRobotics. (2025, April 24). PROCEPT BioRobotics Aquablation Therapy Spotlighted at 2025 AUA Annual Meeting Along with Expert-Led Workshops.
- PROCEPT BioRobotics. (2026, February 25). PROCEPT BioRobotics Reports Fourth Quarter 2025 Financial Results and Updates 2026 Revenue Guidance.
- Robert Koch Institute. (2026, January 29). World Cancer Day 2026: Current Figures on Cancer in Germany.
- Profound Medical. (2025, November 11). Profound Medical Inks Exclusive Distribution Agreement for TULSA-PRO and Sonalleve with Al Faisaliah Medical Systems in Saudi Arabia.
This bibliography is provided for reader reference and is not exhaustive. The full report contains the complete reference list and detailed citations.
Frequently Asked Questions
What is driving growth in the Urology Ablation Devices Market?
Age-linked BPH demand and localized cancer pathways are expanding the eligible procedure pool across specialist urology services. Hospitals gain broader treatment choice as clinical evidence improves and more procedure-specific devices reach routine commercial use.
Who are the key players in the Urology Ablation Devices Market?
Boston Scientific and AngioDynamics compete alongside PROCEPT BioRobotics and Profound Medical across distinct ablation methods. EDAP TMS S.A., Francis Medical, and Olympus Corporation serve additional prostate and bladder treatment pathways.
What is a notable restraint in the Urology Ablation Devices Market?
Some systems require dedicated imaging access and coordinated specialist teams throughout treatment planning and delivery. Low case volume can weaken capital returns even when physicians recognize a clear clinical role.
Why should executives track the Urology Ablation Devices Market?
The category connects aging demographics with demand for tissue-sparing procedures across benign and oncology pathways. Technology choice affects capital use and recurring disposable revenue across several hospital urology service lines.
What business problem does the Urology Ablation Devices Market address?
Ablation devices remove targeted urologic tissue without automatically requiring extensive surgery for every eligible patient. The approach can preserve nearby anatomy and support shorter recovery across carefully selected clinical pathways.
What should hospital urology leaders evaluate in the Urology Ablation Devices Market?
Clinical teams should compare approved indications and retreatment evidence before selecting a new ablation platform. They should measure imaging time and disposable cost against realistic annual case volume and staffing capacity.
What limits return on investment in the Urology Ablation Devices Market?
Underused procedure rooms and low case throughput can leave capital systems idle across hospital service lines. Training gaps and narrow patient eligibility can reduce recurring disposable revenue after the initial installation.
What supports long-term commercial confidence in the Urology Ablation Devices Market?
Verified product indications and peer-reviewed outcomes give hospital committees a firmer basis for purchasing decisions. Repeat procedures and dependable technical support provide clearer evidence for continued investment across established urology programs.
Preview the report firsthand - request a free sample
Get SampleGet the brochure for pricing and purchase details.
Get PDFTable of Content
- Key Takeaways
- Market Size and CAGR
- Top Growth Driver
- Fastest Growing Segment
- Leading Region
- Key Companies
- Emerging Opportunities
- Executive Summary
- Global Market Outlook
- Demand-side Trends
- Supply-side Trends
- Technology Roadmap Analysis
- Analysis and Recommendations
- Analyst Perspective (What is happening? Why now? What should investors know?)
- Key Questions Answered
- How large is the market?
- What is the CAGR?
- What are key trends?
- Which region dominates?
- Who are the leaders?
- Market Overview
- Market Coverage / Taxonomy
- Market Definition / Scope / Limitations
- Research Methodology
- Chapter Orientation
- Analytical Lens and Working Hypotheses
- Market Structure, Signals, and Trend Drivers
- Benchmarking and Cross-market Comparability
- Market Sizing, Forecasting, and Opportunity Mapping
- Research Design and Evidence Framework
- Desk Research Programme (Secondary Evidence)
- Expert Input and Fieldwork (Primary Evidence)
- Tooling, Models, and Reference Databases
- Data Engineering and Model Build
- Quality Assurance and Audit Trail
- Market Background
- Market Dynamics (Drivers, Restraints, Opportunity, Trends)
- Scenario Forecast (Optimistic, Likely, Conservative)
- Impact Analysis
- AI Impact
- Sustainability Impact
- Regulatory Impact
- Technology Impact
- Consumer / Buyer Analysis
- Purchase Drivers
- Adoption Barriers
- Buyer Journey
- Opportunity Map Analysis
- Product Life Cycle Analysis
- Supply Chain Analysis
- Investment Feasibility Matrix
- Value Chain Analysis
- PESTLE and Porter's Analysis
- Regulatory Landscape
- Regional Parent Market Outlook
- Production and Consumption Statistics
- Import and Export Statistics
- Global Market Analysis and Forecast, 2021 to 2036
- Historical Market Size Value (USD Million) Analysis, 2021 to 2025
- Current and Future Market Size Value (USD Million) Projections, 2026 to 2036
- Y-o-Y Growth Trend Analysis
- Absolute $ Opportunity Analysis
- Global Market Pricing Analysis, 2021 to 2036
- Global Market Analysis and Forecast, By Technology, 2021 to 2036
- Introduction / Key Findings
- Historical Market Size Value (USD Million) Analysis By Technology, 2021 to 2025
- Current and Future Market Size Value (USD Million) Analysis and Forecast By Technology, 2026 to 2036
- Radiofrequency Ablation
- Microwave Ablation
- Cryoablation
- Irreversible Electroporation
- Others
- Radiofrequency Ablation
- Y-o-Y Growth Trend Analysis By Technology, 2021 to 2025
- Absolute $ Opportunity Analysis By Technology, 2026 to 2036
- Global Market Analysis and Forecast, By Application, 2021 to 2036
- Introduction / Key Findings
- Historical Market Size Value (USD Million) Analysis By Application, 2021 to 2025
- Current and Future Market Size Value (USD Million) Analysis and Forecast By Application, 2026 to 2036
- Benign Prostatic Hyperplasia
- Kidney Cancer
- Bladder Cancer
- Others
- Benign Prostatic Hyperplasia
- Y-o-Y Growth Trend Analysis By Application, 2021 to 2025
- Absolute $ Opportunity Analysis By Application, 2026 to 2036
- Global Market Analysis and Forecast, By End User, 2021 to 2036
- Introduction / Key Findings
- Historical Market Size Value (USD Million) Analysis By End User, 2021 to 2025
- Current and Future Market Size Value (USD Million) Analysis and Forecast By End User, 2026 to 2036
- Hospitals
- Ambulatory Surgical Centers
- Specialty Clinics
- Hospitals
- Y-o-Y Growth Trend Analysis By End User, 2021 to 2025
- Absolute $ Opportunity Analysis By End User, 2026 to 2036
- Global Market Analysis and Forecast, By Country, 2021 to 2036
- Introduction / Key Findings
- Historical Market Size Value (USD Million) Analysis By Country, 2021 to 2025
- Current and Future Market Size Value (USD Million) Analysis and Forecast By Country, 2026 to 2036
- Germany
- UK
- France
- Italy
- Spain
- Rest of Europe
- Germany
- Y-o-Y Growth Trend Analysis By Country, 2021 to 2025
- Absolute $ Opportunity Analysis By Country, 2026 to 2036
- Global Market Analysis and Forecast, By Region, 2021 to 2036
- Introduction
- Historical Market Size Value (USD Million) Analysis By Region, 2021 to 2025
- Current Market Size Value (USD Million) Analysis and Forecast By Region, 2026 to 2036
- North America
- Latin America
- Western Europe
- Eastern Europe
- East Asia
- South Asia and Pacific
- Middle East & Africa
- Market Attractiveness Analysis By Region
- North America Market Analysis and Forecast, By Country, 2021 to 2036
- Historical Market Size Value (USD Million) Trend Analysis By Market Taxonomy, 2021 to 2025
- Market Size Value (USD Million) Forecast By Market Taxonomy, 2026 to 2036
- By Country
- USA
- Canada
- By Technology
- By Application
- By End User
- By Country
- By Country
- Market Attractiveness Analysis
- By Country
- By Technology
- By Application
- By End User
- By Country
- Key Takeaways
- Latin America Market Analysis and Forecast, By Country
- Historical Market Size Value (USD Million) Trend Analysis By Market Taxonomy, 2021 to 2025
- Market Size Value (USD Million) Forecast By Market Taxonomy, 2026 to 2036
- By Country
- Brazil
- Mexico
- Chile
- Rest of Latin America
- By Technology
- By Application
- By End User
- By Country
- By Country
- Market Attractiveness Analysis
- By Country
- By Technology
- By Application
- By End User
- By Country
- Key Takeaways
- Western Europe Market Analysis and Forecast, By Country
- Historical Market Size Value (USD Million) Trend Analysis By Market Taxonomy, 2021 to 2025
- Market Size Value (USD Million) Forecast By Market Taxonomy, 2026 to 2036
- By Country
- Germany
- UK
- Italy
- Spain
- France
- Nordic
- BENELUX
- Rest of Western Europe
- By Technology
- By Application
- By End User
- By Country
- By Country
- Market Attractiveness Analysis
- By Country
- By Technology
- By Application
- By End User
- By Country
- Key Takeaways
- Eastern Europe Market Analysis and Forecast, By Country
- Historical Market Size Value (USD Million) Trend Analysis By Market Taxonomy, 2021 to 2025
- Market Size Value (USD Million) Forecast By Market Taxonomy, 2026 to 2036
- By Country
- Russia
- Poland
- Hungary
- Balkan & Baltic
- Rest of Eastern Europe
- By Technology
- By Application
- By End User
- By Country
- By Country
- Market Attractiveness Analysis
- By Country
- By Technology
- By Application
- By End User
- By Country
- Key Takeaways
- East Asia Market Analysis and Forecast, By Country
- Historical Market Size Value (USD Million) Trend Analysis By Market Taxonomy, 2021 to 2025
- Market Size Value (USD Million) Forecast By Market Taxonomy, 2026 to 2036
- By Country
- China
- Japan
- South Korea
- By Technology
- By Application
- By End User
- By Country
- By Country
- Market Attractiveness Analysis
- By Country
- By Technology
- By Application
- By End User
- By Country
- Key Takeaways
- South Asia and Pacific Market Analysis and Forecast, By Country
- Historical Market Size Value (USD Million) Trend Analysis By Market Taxonomy, 2021 to 2025
- Market Size Value (USD Million) Forecast By Market Taxonomy, 2026 to 2036
- By Country
- India
- ASEAN
- Australia & New Zealand
- Rest of South Asia and Pacific
- By Technology
- By Application
- By End User
- By Country
- By Country
- Market Attractiveness Analysis
- By Country
- By Technology
- By Application
- By End User
- By Country
- Key Takeaways
- Middle East & Africa Market Analysis and Forecast, By Country
- Historical Market Size Value (USD Million) Trend Analysis By Market Taxonomy, 2021 to 2025
- Market Size Value (USD Million) Forecast By Market Taxonomy, 2026 to 2036
- By Country
- Kingdom of Saudi Arabia
- Other GCC Countries
- Türkiye
- South Africa
- Other African Union
- Rest of Middle East & Africa
- By Technology
- By Application
- By End User
- By Country
- By Country
- Market Attractiveness Analysis
- By Country
- By Technology
- By Application
- By End User
- By Country
- Key Takeaways
- Key Countries Market Analysis
- USA
- Pricing Analysis
- Market Share Analysis, 2025
- By Technology
- By Application
- By End User
- By Country
- Canada
- Pricing Analysis
- Market Share Analysis, 2025
- By Technology
- By Application
- By End User
- By Country
- Mexico
- Pricing Analysis
- Market Share Analysis, 2025
- By Technology
- By Application
- By End User
- By Country
- Brazil
- Pricing Analysis
- Market Share Analysis, 2025
- By Technology
- By Application
- By End User
- By Country
- Chile
- Pricing Analysis
- Market Share Analysis, 2025
- By Technology
- By Application
- By End User
- By Country
- Germany
- Pricing Analysis
- Market Share Analysis, 2025
- By Technology
- By Application
- By End User
- By Country
- UK
- Pricing Analysis
- Market Share Analysis, 2025
- By Technology
- By Application
- By End User
- By Country
- Italy
- Pricing Analysis
- Market Share Analysis, 2025
- By Technology
- By Application
- By End User
- By Country
- Spain
- Pricing Analysis
- Market Share Analysis, 2025
- By Technology
- By Application
- By End User
- By Country
- France
- Pricing Analysis
- Market Share Analysis, 2025
- By Technology
- By Application
- By End User
- By Country
- India
- Pricing Analysis
- Market Share Analysis, 2025
- By Technology
- By Application
- By End User
- By Country
- ASEAN
- Pricing Analysis
- Market Share Analysis, 2025
- By Technology
- By Application
- By End User
- By Country
- Australia & New Zealand
- Pricing Analysis
- Market Share Analysis, 2025
- By Technology
- By Application
- By End User
- By Country
- China
- Pricing Analysis
- Market Share Analysis, 2025
- By Technology
- By Application
- By End User
- By Country
- Japan
- Pricing Analysis
- Market Share Analysis, 2025
- By Technology
- By Application
- By End User
- By Country
- South Korea
- Pricing Analysis
- Market Share Analysis, 2025
- By Technology
- By Application
- By End User
- By Country
- Russia
- Pricing Analysis
- Market Share Analysis, 2025
- By Technology
- By Application
- By End User
- By Country
- Poland
- Pricing Analysis
- Market Share Analysis, 2025
- By Technology
- By Application
- By End User
- By Country
- Hungary
- Pricing Analysis
- Market Share Analysis, 2025
- By Technology
- By Application
- By End User
- By Country
- Kingdom of Saudi Arabia
- Pricing Analysis
- Market Share Analysis, 2025
- By Technology
- By Application
- By End User
- By Country
- Türkiye
- Pricing Analysis
- Market Share Analysis, 2025
- By Technology
- By Application
- By End User
- By Country
- South Africa
- Pricing Analysis
- Market Share Analysis, 2025
- By Technology
- By Application
- By End User
- By Country
- USA
- Market Structure Analysis
- Competition Dashboard
- Competition Benchmarking
- Market Share Analysis of Top Players
- By Regional
- By Technology
- By Application
- By End User
- By Country
- Emerging Startups
- Innovation Benchmarking
- Competition Analysis
- Competition Deep Dive
- Boston Scientific
- Overview
- Product Portfolio
- Profitability by Market Segments
- Sales Footprint
- Strategy Overview
- Marketing Strategy
- Product Strategy
- Channel Strategy
- Medtronic
- AngioDynamics
- Olympus
- Karl Storz
- AtriCure
- Johnson & Johnson
- Boston Scientific
- Case Studies
- Success Stories
- Recent Developments
- Competition Deep Dive
- Assumptions & Acronyms Used


