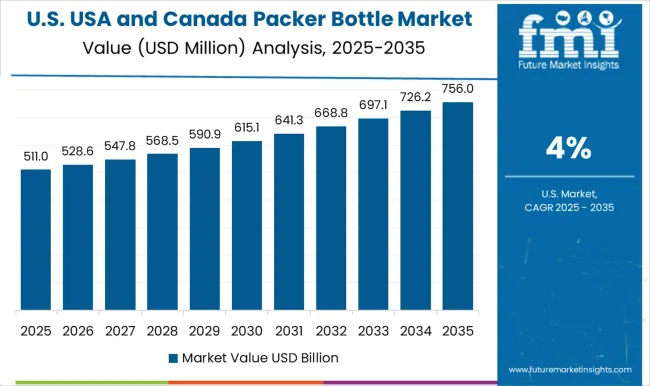
The USA and Canada Packer Bottle Market is estimated to be valued at USD 1.2 billion in 2025 and is projected to reach USD 2.0 billion by 2035, registering a compound annual growth rate (CAGR) of 4.7% over the forecast period.
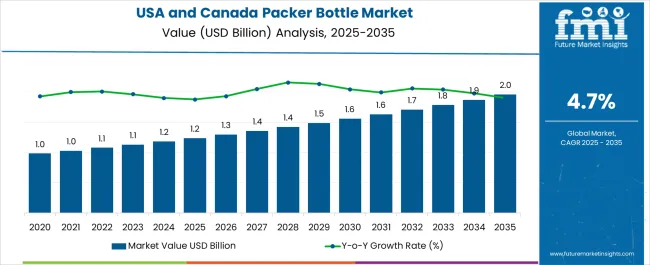
| Metric | Value |
|---|---|
| USA and Canada Packer Bottle Market Estimated Value in (2025 E) | USD 1.2 billion |
| USA and Canada Packer Bottle Market Forecast Value in (2035 F) | USD 2.0 billion |
| Forecast CAGR (2025 to 2035) | 4.7% |
The USA and Canada packer bottle market is experiencing steady growth driven by the expansion of the pharmaceutical and nutraceutical industries, coupled with a rising demand for convenient, durable, and compliant packaging formats. Increasing health consciousness and the growing trend of self medication have contributed to higher consumption of vitamins, dietary supplements, and over the counter drugs, fueling demand for packer bottles.
Regulatory requirements for child resistant closures, tamper evident features, and FDA compliant materials are shaping product design and manufacturing practices across the region. Advances in lightweight plastics, sustainable resins, and barrier technologies are enhancing functionality while aligning with environmental goals.
The market outlook remains positive as manufacturers increasingly focus on sustainable packaging solutions and product differentiation to meet evolving consumer and regulatory expectations.
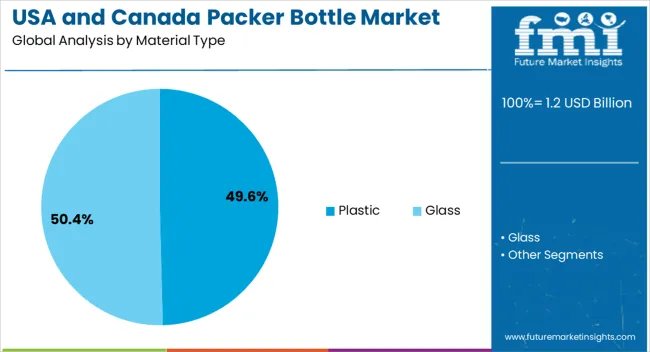
The plastic material type segment is expected to account for 49.60% of total revenue by 2025, making it the dominant material category. Its popularity is attributed to durability, lightweight design, and cost effectiveness compared to alternatives.
Plastic packer bottles are also favored for their compatibility with a wide range of closures and liners, offering enhanced flexibility in pharmaceutical and nutraceutical packaging. The adaptability of plastics to sustainable resin formulations and recycling initiatives has further reinforced their use.
As the industry continues to prioritize safety, convenience, and sustainability, plastic remains the preferred choice within the material segment.
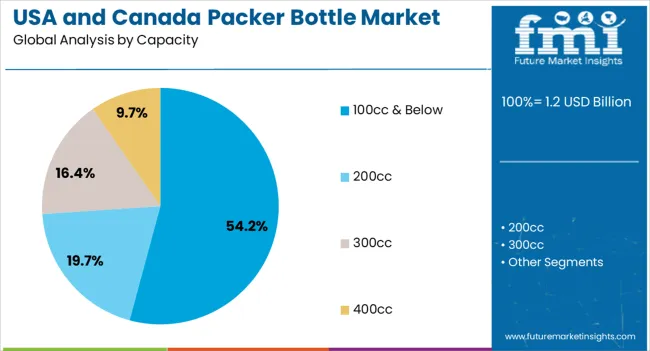
The 100cc and below capacity segment is projected to represent 54.20% of total market revenue by 2025 within the capacity category, positioning it as the leading format. This size is widely adopted for vitamins, dietary supplements, and prescription medicines due to its portability, affordability, and compliance with dosage requirements.
Smaller pack sizes also improve consumer convenience while aiding in adherence to prescribed treatment regimens. Demand is further supported by the growth of e commerce distribution, where compact and protective packaging enhances logistical efficiency.
The dominance of this segment reflects its balance of functionality, consumer preference, and compatibility with multiple pharmaceutical applications.
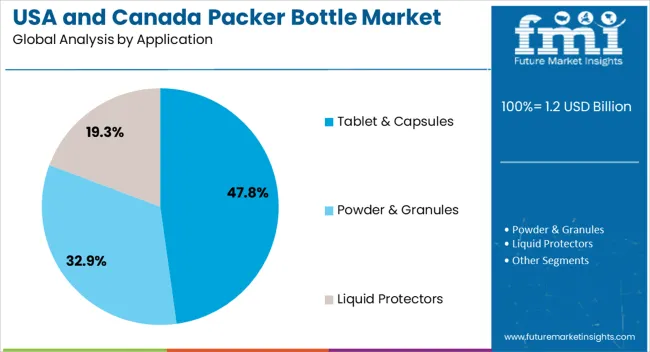
The tablet and capsules application segment is projected to contribute 47.80% of total market revenue by 2025, making it the largest application area. The prevalence of tablets and capsules as the most common dosage forms across pharmaceuticals and nutraceuticals has been the key driver of this share.
Packer bottles offer superior protection from moisture and contamination, ensuring product stability throughout shelf life. Their design supports ease of storage, portability, and patient convenience, which further enhances adoption.
With rising consumption of dietary supplements and prescription medications in both the USA and Canada, this application segment continues to anchor overall demand for packer bottles, establishing its leadership in the market.
As per Future Market Insights, the North America packer bottle industry witnessed a CAGR of 4.7% from 2020 to 2024. It reached a total valuation of USD 1.2 billion in 2025. Over the projection period, packer bottle sales across North America are set to surge at 4.8% CAGR.
The market for packer bottles in the United States grew from USD 1 million in 2020 to USD 1,078.6 million by 2025. It exhibited a CAGR of 4.5%.
Subsequently, Canadian market expanded at 5.6% CAGR during the historical period. The overall market size in Canada grew from USD 140.2 million in 2020 to USD 182.8 million in 2025.
Over the next ten years, packer bottle demand across the USA and Canada will rise at 4.7% and 5.8% CAGR respectively.
Packer bottles are safe and easy-to-use packaging solutions frequently used to store and carry a variety of industrial and non-industrial solutions. An extensive range of packer bottles such as HDPE, PET, PC, PVC, and glass packer bottles are available in the market.
These packer bottles are portable, sturdy, and can be resealed, which makes them an ideal choice for the packaging of solids as well as liquids.
Over the past few years, plastic and glass packer bottles have emerged as the most efficient and cost-effective packaging solutions. The adoption of such convenient and protective packaging solutions is likely to witness significant traction in the foreseeable future. This will boost the USA and Canada packer bottle industry.
Demand for packer bottles across USA and Canada is all set to reach new heights, owing to their long shelf life, affordable pricing, recyclability, and durability. Industries such as pharmaceutical, chemical, and food & beverage are showing interest in using lightweight and barrier bottles.
Leading packaging manufacturers operating in the USA and Canada markets are designing and manufacturing a variety of packer bottles on a large scale, as the demand for pharmaceutical drugs and food & beverage ingredients surges.
Demand remains particularly high for plastic packer bottles across various industries. This is due to their ability to provide exceptional moisture, alcohol, solvent, and gas barrier. They are also lightweight and cost-effective as compared to their counterparts.
Manufacturers are gradually shifting their focus toward protective and recyclable packaging solutions. They are also introducing attractive packaging solutions such as colored packer bottles and UV protection bottles to gain profits. This will aid in the expansion of the market.
Growing Preference for Cost-Effective and Lightweight Plastic Packer Bottles Boosting the Market
As an efficient and cheaper alternative to glass bottles, manufacturers are substituting their raw materials with plastic, which is lightweight and unbreakable. They are using materials such High-Density Polyethylene (HDPE), Polyethylene terephthalate (PET), and other forms of plastic owing to their inexpensive nature.
The tendency of these plastic packer bottles to provide exceptional solvent, alcohol, solvent, moisture, and a gas barrier is fueling their adoption among end users. Companies are showing a keen inclination on using cost-effective and lightweight plastic packagings solutions such as PET packers and HDPE packers.
In addition to that, the abundance of raw materials required to produce plastic packer bottles facilitates the overall manufacturing process with a cost-effective value chain.
The rapidly shifting preference of both manufacturers and end users towards such affordable, non-brittle, and lightweight packaging solutions will boost the market through 2035.
Rising Inclination Toward Anti-Counterfeit Packer Bottles Manufacturing Fueling Market Expansion:
The threat of counterfeit medicine is prevalent across the globe including North America, which is majorly affecting the pharmaceutical packaging market.
In recent years, counterfeit medicines have affected more than billions in revenue of global pharmaceutical companies. To tackle such issues, packer bottle manufacturers in the United States and Canada are extensively spending on manufacturing facilities, which has helped to increase the demand for authentic packer bottles.
Such bottles are traceable and provide information to stakeholders such as wholesalers, retailers, manufacturers, distributors, suppliers, and end users. Moreover, it has increased the profit margin of the packer bottle value chain.
Rising demand for such authentic and traceable packer bottles in pharmaceutical and other industries is playing a key role in fueling market expansion.
Booming Pharmaceutical Industry Propelling Packer Bottle Demand in Canada
Packer bottles are predominantly used in the pharmaceutical industry as they meet all industry specifications and standards. These bottles have become ideal packaging solutions for storing and transporting various pharmaceutical compositions. This includes tablets, capsules, powder, and liquid formulations.
The booming pharmaceutical industry across Canada will generate high demand for packer bottles. Canada is the 9th largest pharmaceutical market in the world. The sales of pharmaceuticals in Canada have a 2.1% market share globally.
Demand for packer bottles in Canada is increasing as they provide an excellent oxygen barrier and child-resistant packaging options. Consequently, the ability of packer bottles to provide robust and sturdy packaging for a wide array of pharmaceuticals makes them ideal packaging solutions.
Growing Demand for Packer Bottles with Child-Resistant Closures Boosting Sales in the USA
The USA recorded a higher incidence of underage children being poisoned by accidentally consuming medication stored in packer bottles. To tackle this and keep children safe from unintentional overdoses, initiatives such as Protect Initiative were launched.
As a result, pharmaceutical packaging manufacturers began focusing on designing new closures and made them complicated for a child to open that include two-piece push-and-turn technology for closures of pharmaceutical bottles.
The security offered by child-resistant closures against accidental consumption of medicines is supplementing the sales of packer bottles across the country.
Additional Features Offered by Packer Bottles Made from Glass Fueling their Demand
Currently, the plastic segment dominates the USA and Canada packer bottle industry and the trend is likely to continue through 2035. This is due to the rising usage of plastic packer bottles across various industries.
However, with growth awareness about the advantages of glass material, both packer bottle manufacturers and end users are switching to glass packer bottles.
Glass is the most relied-on material segment when it comes to packer bottles as it is more chemically inert and non-porous than its plastic counterparts. This aids in better preservation of food and beverages as well as pharmaceutical products such as pills, syrups, tablets, and other medicines as the material does not contaminate such substances.
Sales of glass packer bottles are rising as they do not react with the contents that are packaged. They extend the shelf-life of packaged items and keep them safe from external factors. They are also convenient to store and provide extraordinary appeal when placed on shelves.
Thanks to the growing preference for glass packer bottles, the target segment is likely to account for 31% of the market value share in 2025.
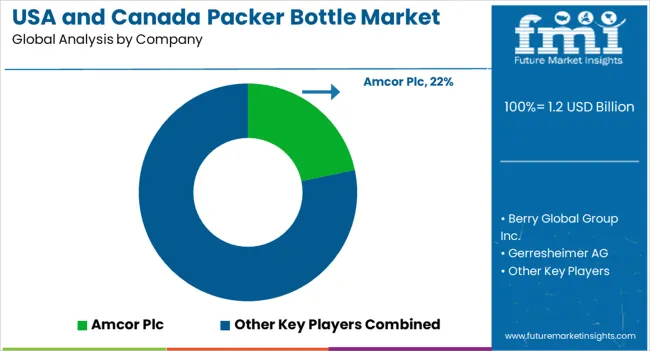
Leading packer bottle manufacturers are emphasizing innovations for convenience and sustainability. They are continuously launching new tamper-proof bottles with eco-friendly features.
Companies are also adopting mergers and acquisitions to expand their presence and resources as well as increase their production capabilities.
Recent Developments in the USA and Canada Packer Bottle Market:
| Attribute | Details |
|---|---|
| Estimated Market Size (2025) | USD 1.13 billion for USA Market USD 194 million for Canada Market |
| Projected Market Size (2035) | USD 1.82 billion for USA market USD 349.1 million for Canada market |
| Anticipated Growth Rate (2025 to 2035) | 4.7% CAGR (United States) 5.8% CAGR (Canada) |
| Historical Data | 2020 to 2025 |
| Forecast Period | 2025 to 2035 |
| Quantitative Units | Revenue in USD Million, Revenue in USD Million, Volume in Units, and CAGR from 2025 to 2035 |
| Report Coverage | Revenue Forecast, Volume Forecast, Company Ranking, Competitive Landscape, Growth Factors, Trends, and Pricing Analysis |
| Segment Covered | Material Type, Capacity, Application, End Use, Region |
| Regions Covered |
North America |
| Key Countries Profiled | USA, Canada |
| Key Companies Profiled | Amcor Plc; Berry Global Group Inc.; Gerresheimer AG; Comar LLC; O.Berk Company, LLC; CL Smith; Aaron Packaging, Inc.; Clarke Container Inc.; Alpha Packaging; Pretium Packaging; Parkway Plastics Inc.; The Cary Company; FH Packaging; DWK Life Sciences; Silver Spur Corporation; ProSHAKE; Graham Packaging Company; ALWSCI Technologies; Drug Plastics Group; Gil Pack Pharmaceutical Packaging |
The global USA and Canada packer bottle market is estimated to be valued at USD 1.2 billion in 2025.
The market size for the USA and Canada packer bottle market is projected to reach USD 2.0 billion by 2035.
The USA and Canada packer bottle market is expected to grow at a 4.7% CAGR between 2025 and 2035.
The key product types in USA and Canada packer bottle market are plastic, _high-density polyethylene (hdpe), _polyethylene terephthalate (pet), _polycarbonate (pc), _others (pvc, ps, etc.) and glass.
In terms of capacity, 100cc & below segment to command 54.2% share in the USA and Canada packer bottle market in 2025.


Full Research Suite comprises of:
Market outlook & trends analysis
Interviews & case studies
Strategic recommendations
Vendor profiles & capabilities analysis
5-year forecasts
8 regions and 60+ country-level data splits
Market segment data splits
12 months of continuous data updates
DELIVERED AS:
PDF EXCEL ONLINE
USA Medical Coding Market Size and Share Forecast Outlook 2025 to 2035
USA Labels Market Size and Share Forecast Outlook 2025 to 2035
USA Plant-based Creamers Market Size and Share Forecast Outlook 2025 to 2035
USA Barrier Coated Paper Market Size and Share Forecast Outlook 2025 to 2035
USA Electronic Health Records (EHR) Market Size and Share Forecast Outlook 2025 to 2035
USA Animal Model Market Size and Share Forecast Outlook 2025 to 2035
USA Stretch Hood Films Market Size and Share Forecast Outlook 2025 to 2035
USA Lubricant Contaminated HDPE Container Waste Market Size and Share Forecast Outlook 2025 to 2035
USA Commercial Walk-In Refrigeration Market Size and Share Forecast Outlook 2025 to 2035
USA Faith Based Tourism Market Size and Share Forecast Outlook 2025 to 2035
United States NFC Lemon Juice Market Analysis - Size, Growth and Forecast 2025 to 2035
United States Animal Feed Additives Market Report – Trends, Growth & Forecast 2025–2035
United States Wild Rice Market Outlook – Size, Demand & Forecast 2025–2035
United States Wood Vinegar Market Analysis – Trends, Growth & Forecast 2025–2035
United States Tartrazine Market Report – Trends, Growth & Forecast 2025–2035
United States Whole Grain and High Fiber Foods Market Report – Trends & Forecast 2025–2035
United States Bakery Ingredients Market Outlook – Demand, Size & Forecast 2025–2035
United States Non-Dairy Creamer Market Insights – Size, Demand & Forecast 2025–2035
United States Food Emulsifier Market Trends – Growth, Demand & Forecast 2025–2035
United States Fish Protein Market Report – Demand, Size & Forecast 2025–2035

Thank you!
You will receive an email from our Business Development Manager. Please be sure to check your SPAM/JUNK folder too.
Chat With
MaRIA