Reports

- Global Locations -

Headquarters

Future Market Insights, Inc.

Christiana Corporate, 200
Continental Drive, Suite 401,
Newark, Delaware - 19713,
United States

T: +1-845-579-5705

Americas

Future Market Insights, Inc.

616 Corporate Way, Suite 2-9018,
Valley Cottage, NY 10989, United States

T: +1-347-918-3531

MEA

Future Market Insights

1602-6 Jumeirah Bay X2 Tower, Plot No: JLT-PH2-X2A,
Jumeirah Lakes Towers, Dubai,
United Arab Emirates

Europe

Future Market Insights

3rd Floor, 207 Regent Street,
W1B 3HH London
United Kingdom

T: + 44 (0) 20 8123 9659
D: +44 (0) 20 3287 4268

Asia Pacific

Future Market Insights

IndiaLand Global Tech Park, Unit UG-1, Behind Grand HighStreet, Phase 1, Hinjawadi, MH, Pune – 411057, India

Vitrectomy Devices Market Snapshot (2023 to 2033)

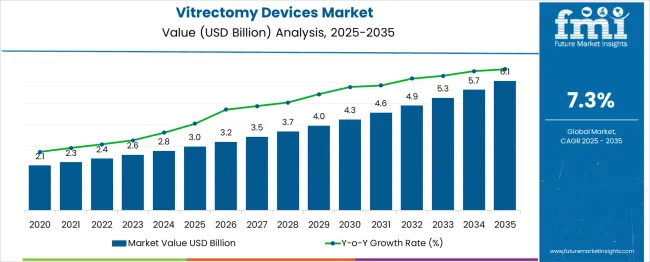
Newly-released Vitrectomy Devices industry analysis report by Future Market Insights shows that global sales of Vitrectomy Devices in 2021 were held at US$ 1.2 billion. With a CAGR of 7.3% from 2022 to 2032, the market is projected to reach a valuation of US$ 2.6 billion by 2032. Vitrectomy Machines are expected to be the highest revenue-generating type, accounting for an absolute dollar opportunity of nearly US$ 1.3 billion from 2022 to 2032.

Attribute Details
Global Vitrectomy Devices Market (2022) US$ 1.3 billion
Global Vitrectomy Devices Market (2032) US$ 2.6 billion
Global Vitrectomy Devices Market CAGR (2022 to 2032) 7.3%
USA Vitrectomy Devices Market CAGR (2022 to 2032) 7.1%
Key Companies Profiled
  • Alcon Inc.
  • Bausch & Lomb Incorporated
  • British Virgin Islands (BVI)
  • NIDEK CO., LTD.
  • Johnson & Johnson Vision Care, Inc.
  • Blink Medical
  • Topcon Corporation
  • Carl Zeiss Meditec AG
  • Hoya Surgical Optics

Don't pay for what you don't need

Customize your report by selecting specific countries or regions and save 30%!

Revenue of Vitrectomy Devices from 2017 to 2021 Compared to Demand Outlook for 2022 to 2032

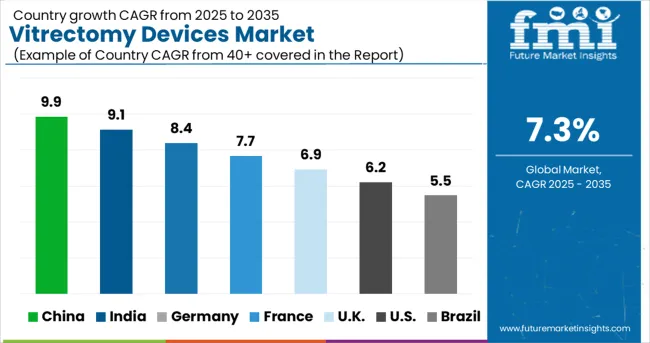
As per the Vitrectomy Devices industry research by Future Market Insights - a market research and competitive intelligence provider, historically, from 2017 to 2021, the market value of the Vitrectomy Devices industry increased at around 6.5% CAGR, wherein, countries such as the USA, United Kingdom, China, South Korea, and Japan held a significant share in the global market. Owing to this, the Vitrectomy Devices market is projected to grow at a CAGR of 7.3% over the coming 10 years.

What factors are leading to growth of the Vitrectomy Devices industry?

Vitrectomy aids in the removal of blood from the vitreous humour and the prevention of traction retinal detachment. This, in turn, helps to smooth the process of many other ophthalmic surgeries and prevents further retinal detachment during the procedure. Furthermore, vitrectomy aids in the restoration of vision loss caused by vitreous humour bleeding.

The increased frequency of retinal illness, as well as the causes for it, are expected to drive the market throughout the forecast period. Diabetes has a negative impact on eye health, causing eyesight loss through damaging the retina's blood vessels. Diabetic retinopathy affected 7.7 million Americans in 2018, according to the National Eye Institute. By 2030, this number is projected to rise to 11.3 million, thus propelling the market forward.

Hospital admissions for Rhegmatogenous Retinal Detachment (RRD) in the United Kingdom have been increasing since 2000. A substantial number of patients are admitted for RRD, according to HES Hospital Admitted Patient Care Activity statistics, increasing demand for pars plana vitrectomy surgeries.

As a result, market participants are demonstrating innovations in the retina domain at conferences in order to broaden its reach and adoption in order to fulfill rising demand. In July 2019, Alcon debuted their new HYPERVIT Dual Blade Vitrectomy Probe at the American Society of Retina Specialists’ annual meeting. During microincision vitrectomy surgery, this cutting-edge probe is designed to increase stability and balance.

Aside from the numerous benefits affiliated with vitrectomy surgical procedures and devices, the risks associated with the procedure are expected to pose a barrier to its widespread adoption. The risks of vitrectomy include eye infection, bleeding in the vitreous gel, retinal detachment, and high intraocular pressure. Furthermore, after a few years of vitrectomy, patients may develop cataracts or other eye problems.

Sabyasachi Ghosh
Sabyasachi Ghosh

Principal Consultant

Talk to Analyst

Find your sweet spots for generating winning opportunities in this market.

Regional Analysis

Which Region is projected to Offer the Largest Opportunity for Vitrectomy Devices?

The market in Asia Pacific is expected to register the highest CAGR of nearly 8% during the forecast period due to increased demand for Vitrectomy Devices in developing countries, especially Japan and China. This can be attributed to the increasing geriatric population in the region.

During the forecast period, the market in Asia Pacific will grow at the fastest rate of the presence of a large patient pool seeking ophthalmic care and the adoption of vitrectomy devices. Furthermore, the government's increasing emphasis on providing improved healthcare centers and proper patient care is further contributing to market growth.
Country-wise Analysis

USA Vitrectomy Devices Market Analysis

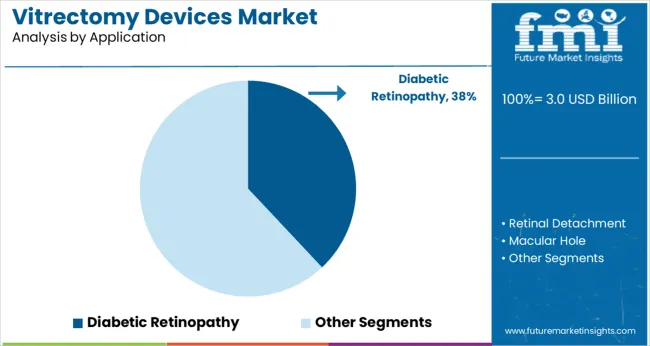
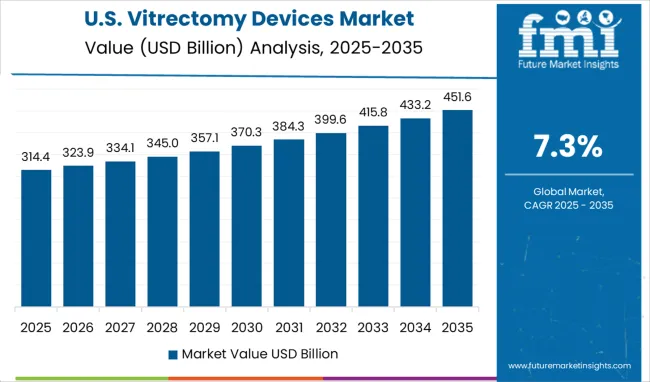
In 2021, the United States held the largest market share, accounting for over 35% of total revenue. The rising prevalence of ocular ailments including diabetic retinopathy, retinal detachment, and the macular hole is likely to boost market expansion in the region.

Several companies in the country are seeking FDA approval in the United States for their products, allowing them to remain competitive in the market. Medical Instrument Development Facilities, Inc., for example, gained FDA 510 (k) clearance in July 2016 for the Bi-Blade Vitrectomy Cutter. Thus, the growing prevalence of such diseases caused a rise in the revenue share in the US.

United Kingdom Vitrectomy Devices Market Analysis

The market in the United Kingdom is projected to reach a valuation of US$ 133 million by 2032. With a CAGR of 8%, the market is expected to gross an absolute dollar opportunity of US$ 72 million from 2022 to 2032.

Japan Vitrectomy Devices Market Analysis

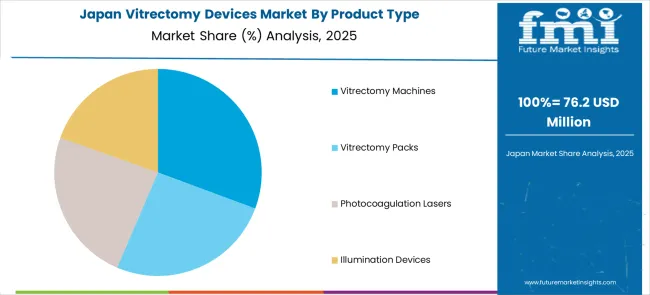
In Japan, the market is projected to reach a valuation of US$ 122 million by 2032. Growing at a CAGR of 7.8%, the market is expected to garner an absolute dollar opportunity of US$ 65 million.

South Korea Vitrectomy Devices Market Analysis

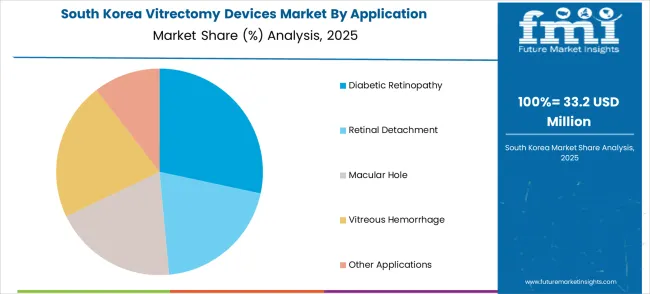
The market in South Korea is projected to garner an absolute dollar opportunity of US$ 18.5 million, growing at a CAGR of 5.3% from 2022 to 2032. By 2032, the market is likely to reach a valuation of US$ 45 million.

Get the data you need at a Fraction of the cost

Personalize your report by choosing insights you need
and save 40%!

Category-wise Insights

Why did Vitrectomy Machines dominate the market for Vitrectomy Devices as a Product type?

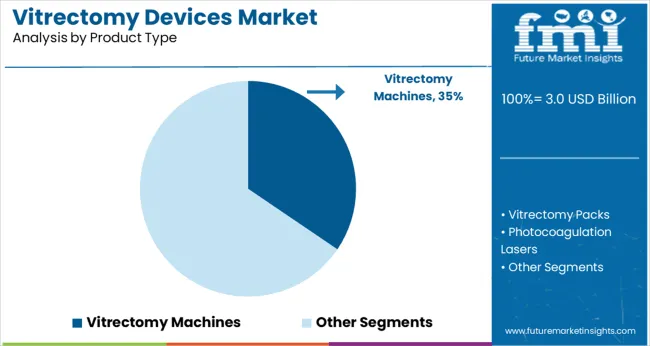
In 2020, the vitrectomy machines segment dominated the market, accounting for 36.8% of the total revenue. The development of new generation machines with advanced features such as improved fluidics, high cut rates, small gauge size, and intraocular pressure control has contributed to the segment's growth. For example, Alcon's Constellation Vision System has fluidics that works for small-gauge surgery, overcoming previous machines' limitations.

During the forecast period, the vitrectomy packs segment is projected to expand at the fastest rate. This can be attributed to the increased use of these packs in a variety of indications, including vitreous removal from the retina, epiretinal membrane removal, collective procedures for retinal surgery, and posterior vitreous detachment.

Furthermore, the vitrectomy pack's additional benefits, such as portability, optical magnification, and fast response, are expected to propel the growth of vitrectomy devices. According to the CDC, diabetic retinopathy affects one-third of African-Americans and Mexican Americans over the age of 40. Furthermore, 4.2 million people have diabetic retinopathy, and 655,000 have vision-threatening diabetic retinopathy. As a result, the increasing incidence of diabetic retinopathy is expected to drive segment growth over the forecast period.
How has the Vitrectomy Devices Industry dealt with the Covid-19 Scenario?

The COVID-19 pandemic harmed a range of medical specialties, including ophthalmology. Conjunctivitis was reported in 1% to 3% of patients who have been infected with the coronavirus. Consequently, ophthalmologists are being recommended to conduct only emergency ocular procedures during the global outbreak in order to keep the illness from spreading.

Competitive Analysis

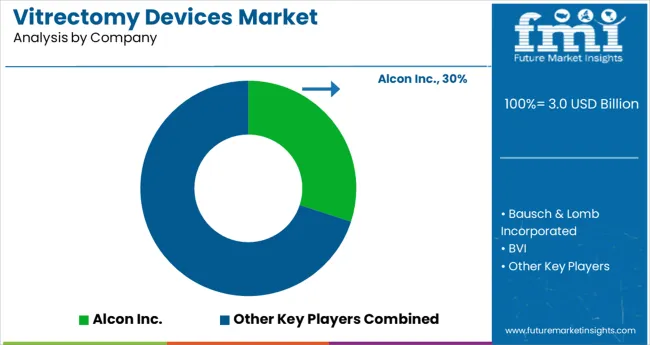
The key players operating in the vitrectomy devices market include Alcon Inc., Bausch & Lomb Incorporated, BVI, NIDEK CO., LTD., Johnson & Johnson Vision Care, Inc., Blink Medical, Topcon Corporation, Carl Zeiss Meditec AG, and Hoya Surgical Optics

Some of the recent developments of key Vitrectomy Devices providers are as follows:

  • In 2019, Fritz Ruck & MID Labs were acquired by Hoya Surgical Optics. Hoya will be able to use MID Lab's vitrectomy cutters, equipment, as well as other vitreoretinal surgical goods as a result of this acquisition, which will help the firm expand its product offering.
  • Recently, Medical Instrument Development Facilities, Inc. gained FDA 510 (k) approval for the Bi-Blade Vitrectomy Cutter.
  • In July 2019, At the American Society of Retina Specialists 2019 annual meeting, Alcon displayed HYPERVIT, its new Dual Blade Vitrectomy Probe.

Similarly, recent developments related to companies offering Vitrectomy Devices have been tracked by the team at Future Market Insights, which are available in the full report.

Market Segments Covered in Vitrectomy Devices Industry Analysis

By Product Type:

  • Vitrectomy Machines
  • Vitrectomy Packs
  • Photocoagulation Lasers
  • Illumination Devices

By Application:

  • Diabetic Retinopathy
  • Retinal Detachment
  • Macular Hole
  • Vitreous Hemorrhage
  • Other Applications

By End-use:

  • Hospitals
  • Ophthalmic Clinics
  • Ambulatory Surgical Centres

Frequently Asked Questions

How much is the current worth of the Vitrectomy Devices market?

The global Vitrectomy Devices market is worth more than US$ 1.2 billion at present.

What is the sales forecast for Vitrectomy Devices?

The value of Vitrectomy Devices is projected to increase at a CAGR of around 7.3% from 2022 to 2032.

What was the last 5 year’s market CAGR?

The value of Vitrectomy Devices increased at a CAGR of around 6.7% from 2017 to 2021.

Which are the top five players of Vitrectomy Devices market?

Top five players of Vitrectomy Devices market include Alcon Inc., Bausch & Lomb Incorporated, BVI, NIDEK CO. LTD., Johnson & Johnson Vision Care Inc.

Which are the top 5 countries driving demand for Vitrectomy Devices?

The top 5 countries driving demand for Vitrectomy Devices are the USA., United Kingdom, China, Japan, and South Korea

What is the outlook for the market in North America?

North America accounted for over 35% of global Vitrectomy Devices demand in 2021.

At what percentage is sales of Vitrectomy Devices going to register growth in Europe?

The European market for Vitrectomy Devices is projected to expand at a CAGR of around 8% from 2022 to 2032.

Table of Content

1. Executive Summary | Vitrectomy Devices Market

    1.1. Global Market Outlook

    1.2. Summary of Statistics

    1.3. Key Market Characteristics & Attributes

    1.4. Analysis and Recommendations

2. Market Overview

    2.1. Market Coverage / Taxonomy

    2.2. Market Definition / Scope / Limitations

3. Market Risks and Trends Assessment 

    3.1. Risk Assessment

        3.1.1. COVID-19 Crisis and Impact on Vitrectomy Devices

        3.1.2. COVID-19 Impact Benchmark with Previous Crisis

        3.1.3. Impact on Market Value (US$ million)

        3.1.4. Assessment by Key Countries

        3.1.5. Assessment by Key Market Segments

        3.1.6. Action Points and Recommendation for Suppliers

    3.2. Key Trends Impacting the Market

    3.3. Formulation and Product Development Trends

4. Market Background 

    4.1. Market, by Key Countries

    4.2. Market Opportunity Assessment (US$ million)

        4.2.1. Total Available Market

        4.2.2. Serviceable Addressable Market

        4.2.3. Serviceable Obtainable Market

    4.3. Market Scenario Forecast

        4.3.1. Demand in optimistic Scenario

        4.3.2. Demand in Likely Scenario

        4.3.3. Demand in Conservative Scenario

    4.4. Investment Feasibility Analysis

        4.4.1. Investment in Established Markets

            4.4.1.1. In Short Term

            4.4.1.2. In Long Term

        4.4.2. Investment in Emerging Markets

            4.4.2.1. In Short Term

            4.4.2.2. In Long Term

    4.5. Forecast Factors - Relevance & Impact

        4.5.1. Top Companies Historical Growth

        4.5.2. Growth in Automation, By Country

        4.5.3. Patch Management Adoption Rate, By Country

    4.6. Market Dynamics

        4.6.1. Market Driving Factors and Impact Assessment

        4.6.2. Prominent Market Challenges and Impact Assessment

        4.6.3. Patch Management Market Opportunities

        4.6.4. Prominent Trends in the Global Market & Their Impact Assessment

5. Key Success Factors 

    5.1. Manufacturers’ Focus on Low Penetration High Growth Markets

    5.2. Banking on with Segments High Incremental Opportunity

    5.3. Peer Benchmarking

6. Global Market Demand Analysis 2015 to 2021 and Forecast, 2022 to 2032

    6.1. Historical Market Analysis, 2015 to 2021

    6.2. Current and Future Market Projections, 2022 to 2032

    6.3. Y-o-Y Growth Trend Analysis

7. Global Market Value Analysis 2015 to 2021 and Forecast, 2022 to 2032

    7.1. Historical Market Value (US$ million) Analysis, 2015 to 2021

    7.2. Current and Future Market Value (US$ million) Projections, 2022 to 2032

        7.2.1. Y-o-Y Growth Trend Analysis

        7.2.2. Absolute $ Opportunity Analysis

8. Global Market Analysis 2015 to 2021 and Forecast 2022 to 2032, By Product Type

    8.1. Introduction / Key Findings

    8.2. Historical Market Size (US$ million) Analysis By Product Type, 2015 to 2021

    8.3. Current and Future Market Size (US$ million) Analysis and Forecast By Product Type, 2022 to 2032

        8.3.1. Virectomy Machines

        8.3.2. Virectomy Packs

        8.3.3. Photocoagulation Lasers

        8.3.4. Illumination Devices

    8.4. Market Attractiveness Analysis By Product Type

9. Global Market Analysis 2015 to 2021 and Forecast 2022 to 2032, By Application

    9.1. Introduction / Key Findings

    9.2. Historical Market Size (US$ million) Analysis By Application, 2015 to 2021

    9.3. Current and Future Market Size (US$ million) Analysis and Forecast By Application, 2022 to 2032

        9.3.1. Diabetic Retinopathy

        9.3.2. Retinal Detachment

        9.3.3. Macular Hole

        9.3.4. Vitreous Hemorrhage

        9.3.5. Other Applications

    9.4. Market Attractiveness Analysis By Application

10. Global Market Analysis 2015 to 2021 and Forecast 2022 to 2032, By End-Use

    10.1. Introduction / Key Findings

    10.2. Historical Market Size (US$ million) Analysis By End-Use, 2015 to 2021

    10.3. Current and Future Market Size (US$ million) Analysis and Forecast By End-Use, 2022 to 2032

        10.3.1. Hospitals

        10.3.2. Ophthalmic Clinics

        10.3.3. Ambulatory surgical Centers

    10.4. Market Attractiveness Analysis By End-Use

11. Global Market Analysis 2015 to 2021 and Forecast 2022 to 2032, By Region

    11.1. Introduction

    11.2. Historical Market Size (US$ million) Analysis By Region, 2015 to 2021

    11.3. Current Market Size (US$ million) & Analysis and Forecast By Region, 2022 to 2032

        11.3.1. North America

        11.3.2. Latin America

        11.3.3. Europe

        11.3.4. Asia Pacific

        11.3.5. Middle East and Africa (MEA)

    11.4. Market Attractiveness Analysis By Region

12. North America Market Analysis 2015 to 2021 and Forecast 2022 to 2032

    12.1. Introduction

    12.2. Pricing Analysis

    12.3. Historical Market Size (US$ million) Trend Analysis By Market Taxonomy, 2015 to 2021

    12.4. Market Size (US$ million) & Forecast By Market Taxonomy, 2022 to 2032

        12.4.1. By Country

            12.4.1.1. USA

            12.4.1.2. Canada

            12.4.1.3. Rest of North America

        12.4.2. By Product Type

        12.4.3. By End-Use

        12.4.4. By Application

    12.5. Market Attractiveness Analysis

        12.5.1. By Country

        12.5.2. By Product Type

        12.5.3. By End-Use

        12.5.4. By Application

13. Latin America Market Analysis 2015 to 2021 and Forecast 2022 to 2032

    13.1. Introduction

    13.2. Pricing Analysis

    13.3. Historical Market Size (US$ million) Trend Analysis By Market Taxonomy, 2015 to 2021

    13.4. Market Size (US$ million) & Forecast By Market Taxonomy, 2022 to 2032

        13.4.1. By Country

            13.4.1.1. Brazil

            13.4.1.2. Mexico

            13.4.1.3. Rest of Latin America

        13.4.2. By Product Type

        13.4.3. By End-Use

        13.4.4. By Application

    13.5. Market Attractiveness Analysis

        13.5.1. By Country

        13.5.2. By Product Type

        13.5.3. By End-Use

        13.5.4. By Application

14. Europe Market Analysis 2015 to 2021 and Forecast 2022 to 2032

    14.1. Introduction

    14.2. Pricing Analysis

    14.3. Historical Market Size (US$ million) Trend Analysis By Market Taxonomy, 2015 to 2021

    14.4. Market Size (US$ million) & Forecast By Market Taxonomy, 2022 to 2032

        14.4.1. By Country

            14.4.1.1. Germany

            14.4.1.2. France

            14.4.1.3. United Kingdom

            14.4.1.4. Italy

            14.4.1.5. Benelux

            14.4.1.6. Nordic Countries

            14.4.1.7. Rest of Europe

        14.4.2. By Product Type

        14.4.3. By End-Use

        14.4.4. By Application

    14.5. Market Attractiveness Analysis

        14.5.1. By Country

        14.5.2. By Product Type

        14.5.3. By End-Use

        14.5.4. By Application

15. Asia Pacific Market Analysis 2015 to 2021 and Forecast 2022 to 2032

    15.1. Introduction

    15.2. Pricing Analysis

    15.3. Historical Market Size (US$ million) Trend Analysis By Market Taxonomy, 2015 to 2021

    15.4. Market Size (US$ million) & Forecast By Market Taxonomy, 2022 to 2032

        15.4.1. By Country

            15.4.1.1. China

            15.4.1.2. Japan

            15.4.1.3. South Korea

            15.4.1.4. Rest of Asia Pacific

        15.4.2. By Product Type

        15.4.3. By End-Use

        15.4.4. By Application

    15.5. Market Attractiveness Analysis

        15.5.1. By Country

        15.5.2. By Product Type

        15.5.3. By End-Use

        15.5.4. By Application

16. Middle East and Africa Market Analysis 2015 to 2021 and Forecast 2022 to 2032

    16.1. Introduction

    16.2. Pricing Analysis

    16.3. Historical Market Size (US$ million) Trend Analysis By Market Taxonomy, 2015 to 2021

    16.4. Market Size (US$ million) & Forecast By Market Taxonomy, 2022 to 2032

        16.4.1. By Country

            16.4.1.1. GCC Countries

            16.4.1.2. South Africa

            16.4.1.3. Turkey

            16.4.1.4. Rest of Middle East and Africa

        16.4.2. By Product Type

        16.4.3. By End-Use

        16.4.4. By Application

    16.5. Market Attractiveness Analysis

        16.5.1. By Country

        16.5.2. By Product Type

        16.5.3. By End-Use

        16.5.4. By Application

17. Key Countries Market Analysis 2015 to 2021 and Forecast 2022 to 2032

    17.1. Introduction

        17.1.1. Market Value Proportion Analysis, By Key Countries

        17.1.2. Global Vs. Country Growth Comparison

    17.2. US Market Analysis

        17.2.1. Value Proportion Analysis by Market Taxonomy

        17.2.2. Value & Analysis and Forecast by Market Taxonomy, 2015 to 2032

            17.2.2.1. By Product Type

            17.2.2.2. By End-Use

            17.2.2.3. By Application

    17.3. Canada Market Analysis

        17.3.1. Value Proportion Analysis by Market Taxonomy

        17.3.2. Value & Analysis and Forecast by Market Taxonomy, 2015 to 2032

            17.3.2.1. By Product Type

            17.3.2.2. By End-Use

            17.3.2.3. By Application

    17.4. Mexico Market Analysis

        17.4.1. Value Proportion Analysis by Market Taxonomy

        17.4.2. Value & Analysis and Forecast by Market Taxonomy, 2015 to 2032

            17.4.2.1. By Product Type

            17.4.2.2. By End-Use

            17.4.2.3. By Application

    17.5. Brazil Market Analysis

        17.5.1. Value Proportion Analysis by Market Taxonomy

        17.5.2. Value & Analysis and Forecast by Market Taxonomy, 2015 to 2032

            17.5.2.1. By Product Type

            17.5.2.2. By End-Use

            17.5.2.3. By Application

    17.6. Germany Market Analysis

        17.6.1. Value Proportion Analysis by Market Taxonomy

        17.6.2. Value & Analysis and Forecast by Market Taxonomy, 2015 to 2032

            17.6.2.1. By Product Type

            17.6.2.2. By End-Use

            17.6.2.3. By Application

    17.7. France Market Analysis

        17.7.1. Value Proportion Analysis by Market Taxonomy

        17.7.2. Value & Analysis and Forecast by Market Taxonomy, 2015 to 2032

            17.7.2.1. By Product Type

            17.7.2.2. By End-Use

            17.7.2.3. By Application

    17.8. Italy Market Analysis

        17.8.1. Value Proportion Analysis by Market Taxonomy

        17.8.2. Value & Analysis and Forecast by Market Taxonomy, 2015 to 2032

            17.8.2.1. By Product Type

            17.8.2.2. By End-Use

            17.8.2.3. By Application

    17.9. BENELUX Market Analysis

        17.9.1. Value Proportion Analysis by Market Taxonomy

        17.9.2. Value & Analysis and Forecast by Market Taxonomy, 2015 to 2032

            17.9.2.1. By Product Type

            17.9.2.2. By End-Use

            17.9.2.3. By Application

    17.10. United Kingdom Market Analysis

        17.10.1. Value Proportion Analysis by Market Taxonomy

        17.10.2. Value & Analysis and Forecast by Market Taxonomy, 2015 to 2032

            17.10.2.1. By Product Type

            17.10.2.2. By End-Use

            17.10.2.3. By Application

    17.11. Nordic Countries Market Analysis

        17.11.1. Value Proportion Analysis by Market Taxonomy

        17.11.2. Value & Analysis and Forecast by Market Taxonomy, 2015 to 2032

            17.11.2.1. By Product Type

            17.11.2.2. By End-Use

            17.11.2.3. By Application

    17.12. China Market Analysis

        17.12.1. Value Proportion Analysis by Market Taxonomy

        17.12.2. Value & Analysis and Forecast by Market Taxonomy, 2015 to 2032

            17.12.2.1. By Product Type

            17.12.2.2. By End-Use

            17.12.2.3. By Application

    17.13. Japan Market Analysis

        17.13.1. Value Proportion Analysis by Market Taxonomy

        17.13.2. Value & Analysis and Forecast by Market Taxonomy, 2015 to 2032

            17.13.2.1. By Product Type

            17.13.2.2. By End-Use

            17.13.2.3. By Application

    17.14. South Korea Market Analysis

        17.14.1. Value Proportion Analysis by Market Taxonomy

        17.14.2. Value & Analysis and Forecast by Market Taxonomy, 2015 to 2032

            17.14.2.1. By Product Type

            17.14.2.2. By End-Use

            17.14.2.3. By Application

    17.15. GCC Countries Market Analysis

        17.15.1. Value Proportion Analysis by Market Taxonomy

        17.15.2. Value & Analysis and Forecast by Market Taxonomy, 2015 to 2032

            17.15.2.1. By Product Type

            17.15.2.2. By End-Use

            17.15.2.3. By Application

    17.16. South Africa Market Analysis

        17.16.1. Value Proportion Analysis by Market Taxonomy

        17.16.2. Value & Analysis and Forecast by Market Taxonomy, 2015 to 2032

            17.16.2.1. By Product Type

            17.16.2.2. By End-Use

            17.16.2.3. By Application

    17.17. Turkey Market Analysis

        17.17.1. Value Proportion Analysis by Market Taxonomy

        17.17.2. Value & Analysis and Forecast by Market Taxonomy, 2015 to 2032

            17.17.2.1. By Product Type

            17.17.2.2. By End-Use

            17.17.2.3. By Application

        17.17.3. Competition Landscape and Player Concentration in the Country

18. Market Structure Analysis

    18.1. Market Analysis by Tier of Companies

    18.2. Market Concentration

    18.3. Market Share Analysis of Top Players

    18.4. Market Presence Analysis

        18.4.1. By Regional footprint of Players

        18.4.2. Product footprint by Players

19. Competition Analysis

    19.1. Competition Dashboard

    19.2. Competition Benchmarking

    19.3. Competition Deep Dive

        19.3.1. Alcon Inc.

            19.3.1.1. Overview

            19.3.1.2. Product Portfolio

            19.3.1.3. Sales Footprint

            19.3.1.4. Strategy Overview

        19.3.2. Bausch & Lomb Incorporated

            19.3.2.1. Overview

            19.3.2.2. Product Portfolio

            19.3.2.3. Sales Footprint

            19.3.2.4. Strategy Overview

        19.3.3. BVI

            19.3.3.1. Overview

            19.3.3.2. Product Portfolio

            19.3.3.3. Sales Footprint

            19.3.3.4. Strategy Overview

        19.3.4. NIDEK CO., LTD.

            19.3.4.1. Overview

            19.3.4.2. Product Portfolio

            19.3.4.3. Sales Footprint

            19.3.4.4. Strategy Overview

        19.3.5. Johnson & Johnson Vision Care, Inc.

            19.3.5.1. Overview

            19.3.5.2. Product Portfolio

            19.3.5.3. Sales Footprint

            19.3.5.4. Strategy Overview

        19.3.6. Blink Medical

            19.3.6.1. Overview

            19.3.6.2. Product Portfolio

            19.3.6.3. Sales Footprint

            19.3.6.4. Strategy Overview

        19.3.7. Topcon Corporation

            19.3.7.1. Overview

            19.3.7.2. Product Portfolio

            19.3.7.3. Sales Footprint

            19.3.7.4. Strategy Overview

        19.3.8. Carl Zeiss Meditec AG

            19.3.8.1. Overview

            19.3.8.2. Product Portfolio

            19.3.8.3. Sales Footprint

            19.3.8.4. Strategy Overview

        19.3.9. Hoya Surgical Optics

            19.3.9.1. Overview

            19.3.9.2. Product Portfolio

            19.3.9.3. Sales Footprint

            19.3.9.4. Strategy Overview

20. Assumptions and Acronyms Used

21. Research Methodology

Don't pay for what you don't need

Customize your report by selecting specific countries or regions and save 30%!

List of Tables

Table 1: Global Market Value (US$ million), By Product Type, 2015 to 2021

Table 2: Global Market Value (US$ million), By Product Type, 2022 to 2032

Table 3: Global Market Value (US$ million), By End-Use, 2015 to 2021

Table 4: Global Market Value (US$ million), By End-Use, 2022 to 2032

Table 5: Global Market Value (US$ million), By Application, 2015 to 2021

Table 6: Global Market Value (US$ million), By Application, 2022 to 2032

Table 7: Global Market, By Region, 2015 to 2021

Table 8: Global Market, By Region, 2022 to 2032

Table 9: North America Market Value (US$ million), By Product Type, 2015 to 2021

Table 10: North America Market Value (US$ million), By Product Type, 2022 to 2032

Table 11: North America Market Value (US$ million), By End-Use, 2015 to 2021

Table 12: North America Market Value (US$ million), By End-Use, 2022 to 2032

Table 13: North America Market Value (US$ million), By Application, 2015 to 2021

Table 14: North America Market Value (US$ million), By Application, 2022 to 2032

Table 15: North America Market, By Country, 2015 to 2021

Table 16: North America Market, By Country, 2022 to 2032

Table 17: Latin America Market Value (US$ million), By Product Type, 2015 to 2021

Table 18: Latin America Market Value (US$ million), By Product Type, 2022 to 2032

Table 19: Latin America Market Value (US$ million), By End-Use, 2015 to 2021

Table 20: Latin America Market Value (US$ million), By End-Use, 2022 to 2032

Table 21: Latin America Market Value (US$ million), By Application, 2015 to 2021

Table 22: Latin America Market Value (US$ million), By Application, 2022 to 2032

Table 23: Latin America Market, By Country, 2015 to 2021

Table 24: Latin America Market, By Country, 2022 to 2032

Table 25: Europe Market Value (US$ million), By Product Type, 2015 to 2021

Table 26: Europe Market Value (US$ million), By Product Type, 2022 to 2032

Table 27: Europe Market Value (US$ million), By End-Use, 2015 to 2021

Table 28: Europe Market Value (US$ million), By End-Use, 2022 to 2032

Table 29: Europe Market Value (US$ million), By Application, 2015 to 2021

Table 30: Europe Market Value (US$ million), By Application, 2022 to 2032

Table 31: Europe Market, By Country, 2015 to 2021

Table 32: Europe Market, By Country, 2022 to 2032

Table 33: Asia Pacific Market Value (US$ million), By Product Type, 2015 to 2021

Table 34: Asia Pacific Market Value (US$ million), By Product Type, 2022 to 2032

Table 35: Asia Pacific Market Value (US$ million), By End-Use, 2015 to 2021

Table 36: Asia Pacific Market Value (US$ million), By End-Use, 2022 to 2032

Table 37: Asia Pacific Market Value (US$ million), By Application, 2015 to 2021

Table 38: Asia Pacific Market Value (US$ million), By Application, 2022 to 2032

Table 39: Asia Pacific Market, By Country, 2015 to 2021

Table 40: Asia Pacific Market, By Country, 2022 to 2032

Table 41: MEA Market Value (US$ million), By Product Type, 2015 to 2021

Table 42: MEA Market Value (US$ million), By Product Type, 2022 to 2032

Table 43: MEA Market Value (US$ million), By End-Use, 2015 to 2021

Table 44: MEA Market Value (US$ million), By End-Use, 2022 to 2032

Table 45: MEA Market Value (US$ million), By Application, 2015 to 2021

Table 46: MEA Market Value (US$ million), By Application, 2022 to 2032

Table 47: MEA Market, By Country, 2015 to 2021

Table 48: MEA Market, By Country, 2022 to 2032

Table 49: Global Market Incremental $ Opportunity, By Product Type, 2015 to 2021

Table 50: Global Market Incremental $ Opportunity, By End-Use, 2022 to 2032

Table 51: Global Market Incremental $ Opportunity, By Application, 2015 to 2021

Table 52: Global Market Incremental $ Opportunity, By Region, 2022 to 2032

Table 53: North America Market Incremental $ Opportunity, By Product Type, 2015 to 2021

Table 54: North America Market Incremental $ Opportunity, By End-Use, 2022 to 2032

Table 55: North America Market Incremental $ Opportunity, By Application, 2015 to 2021

Table 56: North America Market Incremental $ Opportunity, By Country, 2022 to 2032

Table 57: Latin America Market Incremental $ Opportunity, By Product Type, 2015 to 2021

Table 58: Latin America Market Incremental $ Opportunity, By End-Use, 2022 to 2032

Table 59: Latin America Market Incremental $ Opportunity, By Application, 2015 to 2021

Table 60: Latin America Market Incremental $ Opportunity, By Country, 2022 to 2032

Table 61: Europe Market Incremental $ Opportunity, By Product Type, 2015 to 2021

Table 62: Europe Market Incremental $ Opportunity, By End-Use, 2022 to 2032

Table 63: Europe Market Incremental $ Opportunity, By Application, 2015 to 2021

Table 64: Europe Market Incremental $ Opportunity, By Country, 2022 to 2032

Table 65: Asia Pacific Market Incremental $ Opportunity, By Product Type, 2015 to 2021

Table 66: Asia Pacific Market Incremental $ Opportunity, By End-Use, 2022 to 2032

Table 67: Asia Pacific Market Incremental $ Opportunity, By Application, 2015 to 2021

Table 68: Asia Pacific Market Incremental $ Opportunity, By Country, 2022 to 2032

Table 69: MEA Market Incremental $ Opportunity, By Product Type, 2015 to 2021

Table 70: MEA Market Incremental $ Opportunity, By End-Use, 2022 to 2032

Table 71: MEA Market Incremental $ Opportunity, By Application, 2015 to 2021

Table 72: MEA Market Incremental $ Opportunity, By Country, 2022 to 2032
Sabyasachi Ghosh
Sabyasachi Ghosh

Principal Consultant

Talk to Analyst

Find your sweet spots for generating winning opportunities in this market.

List of Charts

Figure 1: Global Market Value (US$ million) and Year-on-Year Growth, 2015 to 2032

Figure 2: Global Market Absolute $ Historical Gain (2015 to 2021) and Opportunity (2022 to 2032), US$ million

Figure 3: Global Market Share, By Product Type, 2022 to 2032

Figure 4: Global Market Y-o-Y Growth Projections, By Product Type - 2022 to 2032

Figure 5: Global Market Attractiveness Index, By Product Type - 2022 to 2032

Figure 6: Global Market Share, By End-Use, 2022 to 2032

Figure 7: Global Market Y-o-Y Growth Projections, By End-Use - 2022 to 2032

Figure 8: Global Market Attractiveness Index, By End-Use - 2022 to 2032

Figure 9: Global Market Share, By Application, 2022 to 2032

Figure 10: Global Market Y-o-Y Growth Projections, By Application - 2022 to 2032

Figure 11: Global Market Attractiveness Index, By Application - 2022 to 2032

Figure 12: Global Market Share, By Region, 2022 to 2032

Figure 13: Global Market Y-o-Y Growth Projections, By Region - 2022 to 2032

Figure 14: Global Market Attractiveness Index, By Region - 2022 to 2032

Figure 15: North America Market Value (US$ million) and Year-on-Year Growth, 2015 to 2032

Figure 16: North America Market Absolute $ Opportunity Historical (2015 to 2021) and Forecast Period (2022 to 2032), US$ million

Figure 17: North America Market Share, By Product Type, 2022 to 2032

Figure 18: North America Market Y-o-Y Growth Projections, By Product Type - 2022 to 2032

Figure 19: North America Market Attractiveness Index, By Product Type - 2022 to 2032

Figure 20: North America Market Share, By End-Use, 2022 to 2032

Figure 21: North America Market Y-o-Y Growth Projections, By End-Use - 2022 to 2032

Figure 22: North America Market Attractiveness Index, By End-Use - 2022 to 2032

Figure 23: North America Market Share, By Application, 2022 to 2032

Figure 24: North America Market Y-o-Y Growth Projections, By Application - 2022 to 2032

Figure 25: North America Market Attractiveness Index, By Application - 2022 to 2032

Figure 26: North America Market Share, By Country, 2022 to 2032

Figure 27: North America Market Y-o-Y Growth Projections, By Country - 2022 to 2032

Figure 28: North America Market Attractiveness Index, By Country - 2022 to 2032

Figure 29: Latin America Market Value (US$ million) and Year-on-Year Growth, 2015 to 2032

Figure 30: Latin America Market Absolute $ Opportunity Historical (2015 to 2021) and Forecast Period (2022 to 2032), US$ million

Figure 31: Latin America Market Share, By Product Type, 2022 to 2032

Figure 32: Latin America Market Y-o-Y Growth Projections, By Product Type - 2022 to 2032

Figure 33: Latin America Market Attractiveness Index, By Product Type - 2022 to 2032

Figure 34: Latin America Market Share, By End-Use, 2022 to 2032

Figure 35: Latin America Market Y-o-Y Growth Projections, By End-Use - 2022 to 2032

Figure 36: Latin America Market Attractiveness Index, By End-Use - 2022 to 2032

Figure 37: Latin America Market Share, By Application, 2022 to 2032

Figure 38: Latin America Market Y-o-Y Growth Projections, By Application - 2022 to 2032

Figure 39: Latin America Market Attractiveness Index, By Application - 2022 to 2032

Figure 40: Latin America Market Share, By Country, 2022 to 2032

Figure 41: Latin America Market Y-o-Y Growth Projections, By Country - 2022 to 2032

Figure 42: Latin America Market Attractiveness Index, By Country - 2022 to 2032

Figure 43: Europe Market Value (US$ million) and Year-on-Year Growth, 2015 to 2032

Figure 44: Europe Market Absolute $ Opportunity Historical (2015 to 2021) and Forecast Period (2022 to 2032), US$ million

Figure 45: Europe Market Share, By Product Type, 2022 to 2032

Figure 46: Europe Market Y-o-Y Growth Projections, By Product Type - 2022 to 2032

Figure 47: Europe Market Attractiveness Index, By Product Type - 2022 to 2032

Figure 48: Europe Market Share, By End-Use, 2022 to 2032

Figure 49: Europe Market Y-o-Y Growth Projections, By End-Use - 2022 to 2032

Figure 50: Europe Market Attractiveness Index, By End-Use - 2022 to 2032

Figure 51: Europe Market Share, By Application, 2022 to 2032

Figure 52: Europe Market Y-o-Y Growth Projections, By Application - 2022 to 2032

Figure 53: Europe Market Attractiveness Index, By Application - 2022 to 2032

Figure 54: Europe Market Share, By Country, 2022 to 2032

Figure 55: Europe Market Y-o-Y Growth Projections, By Country - 2022 to 2032

Figure 56: Europe Market Attractiveness Index, By Country - 2022 to 2032

Figure 57: MEA Market Value (US$ million) and Year-on-Year Growth, 2015 to 2032

Figure 58: MEA Market Absolute $ Opportunity Historical (2015 to 2021) and Forecast Period (2022 to 2032), US$ million

Figure 59: MEA Market Share, By Product Type, 2022 to 2032

Figure 60: MEA Market Y-o-Y Growth Projections, By Product Type - 2022 to 2032

Figure 61: MEA Market Attractiveness Index, By Product Type - 2022 to 2032

Figure 62: MEA Market Share, By End-Use, 2022 to 2032

Figure 63: MEA Market Y-o-Y Growth Projections, By End-Use - 2022 to 2032

Figure 64: MEA Market Attractiveness Index, By End-Use - 2022 to 2032

Figure 65: MEA Market Share, By Application, 2022 to 2032

Figure 66: MEA Market Y-o-Y Growth Projections, By Application - 2022 to 2032

Figure 67: MEA Market Attractiveness Index, By Application - 2022 to 2032

Figure 68: MEA Market Share, By Country, 2022 to 2032

Figure 69: MEA Market Y-o-Y Growth Projections, By Country - 2022 to 2032

Figure 70: MEA Market Attractiveness Index, By Country - 2022 to 2032

Figure 71: Asia Pacific Market Value (US$ million) and Year-on-Year Growth, 2015 to 2032

Figure 72: Asia Pacific Market Absolute $ Opportunity Historical (2015 to 2021) and Forecast Period (2022 to 2032), US$ million

Figure 73: Asia Pacific Market Share, By Product Type, 2022 to 2032

Figure 74: Asia Pacific Market Y-o-Y Growth Projections, By Product Type - 2022 to 2032

Figure 75: Asia Pacific Market Attractiveness Index, By Product Type - 2022 to 2032

Figure 76: Asia Pacific Market Share, By End-Use, 2022 to 2032

Figure 77: Asia Pacific Market Y-o-Y Growth Projections, By End-Use - 2022 to 2032

Figure 78: Asia Pacific Market Attractiveness Index, By End-Use - 2022 to 2032

Figure 79: Asia Pacific Market Share, By Application, 2022 to 2032

Figure 80: Asia Pacific Market Y-o-Y Growth Projections, By Application - 2022 to 2032

Figure 81: Asia Pacific Market Attractiveness Index, By Application - 2022 to 2032

Figure 82: Asia Pacific Market Share, By Country, 2022 to 2032

Figure 83: Asia Pacific Market Y-o-Y Growth Projections, By Country - 2022 to 2032

Figure 84: Asia Pacific Market Attractiveness Index, By Country - 2022 to 2032

Figure 85: US Market Value (US$ million) and Forecast, 2022 to 2032

Figure 86: US Market Share, By Product Type, 2021

Figure 87: US Market Share, By End-Use, 2021

Figure 88: US Market Share, By Application, 2021

Figure 89: Canada Market Value (US$ million) and Forecast, 2022 to 2032

Figure 90: Canada Market Share, By Product Type, 2021

Figure 91: Canada Market Share, By End-Use, 2021

Figure 92: Canada Market Share, By Application, 2021

Figure 93: Brazil Market Value (US$ million) and Forecast, 2022 to 2032

Figure 94: Brazil Market Share, By Product Type, 2021

Figure 95: Brazil Market Share, By End-Use, 2021

Figure 96: Brazil Market Share, By Application, 2021

Figure 97: Mexico Market Value (US$ million) and Forecast, 2022 to 2032

Figure 98: Mexico Market Share, By Product Type, 2021

Figure 99: Mexico Market Share, By End-Use, 2021

Figure 100: Mexico Market Share, By Application, 2021

Figure 101: Germany Market Value (US$ million) and Forecast, 2022 to 2032

Figure 102: Germany Market Share, By Product Type, 2021

Figure 103: Germany Market Share, By End-Use, 2021

Figure 104: Germany Market Share, By Application, 2021

Figure 105: United Kingdom Market Value (US$ million) and Forecast, 2022 to 2032

Figure 106: United Kingdom Market Share, By Product Type, 2021

Figure 107: United Kingdom Market Share, By End-Use, 2021

Figure 108: United Kingdom Market Share, By Application, 2021

Figure 109: France Market Value (US$ million) and Forecast, 2022 to 2032

Figure 110: France Market Share, By Product Type, 2021

Figure 111: France Market Share, By End-Use, 2021

Figure 112: France Market Share, By Application, 2021

Figure 113: Italy Market Value (US$ million) and Forecast, 2022 to 2032

Figure 114: Italy Market Share, By Product Type, 2021

Figure 115: Italy Market Share, By End-Use, 2021

Figure 116: Italy Market Share, By Application, 2021

Figure 117: BENELUX Market Value (US$ million) and Forecast, 2022 to 2032

Figure 118: BENELUX Market Share, By Product Type, 2021

Figure 119: BENELUX Market Share, By End-Use, 2021

Figure 120: BENELUX Market Share, By Application, 2021

Figure 121: Nordic Countries Market Value (US$ million) and Forecast, 2022 to 2032

Figure 122: Nordic Countries Market Share, By Product Type, 2021

Figure 123: Nordic Countries Market Share, By End-Use, 2021

Figure 124: Nordic Countries Market Share, By Application, 2021

Figure 125: China Market Value (US$ million) and Forecast, 2022 to 2032

Figure 126: China Market Share, By Product Type, 2021

Figure 127: China Market Share, By End-Use, 2021

Figure 128: China Market Share, By Application, 2021

Figure 129: Japan Market Value (US$ million) and Forecast, 2022 to 2032

Figure 130: Japan Market Share, By Product Type, 2021

Figure 131: Japan Market Share, By End-Use, 2021

Figure 132: Japan Market Share, By Application, 2021

Figure 133: South Korea Market Value (US$ million) and Forecast, 2022 to 2032

Figure 134: South Korea Market Share, By Product Type, 2021

Figure 135: South Korea Market Share, By End-Use, 2021

Figure 136: South Korea Market Share, By Application, 2021

Figure 137: GCC Countries Market Value (US$ million) and Forecast, 2022 to 2032

Figure 138: GCC Countries Market Share, By Product Type, 2021

Figure 139: GCC Countries Market Share, By End-Use, 2021

Figure 140: GCC Countries Market Share, By Application, 2021

Figure 141: South Africa Market Value (US$ million) and Forecast, 2022 to 2032

Figure 142: South Africa Market Share, By Product Type, 2021

Figure 143: South Africa Market Share, By End-Use, 2021

Figure 144: South Africa Market Share, By Application, 2021

Figure 145: Turkey Market Value (US$ million) and Forecast, 2022 to 2032

Figure 146: Turkey Market Share, By Product Type, 2021

Figure 147: Turkey Market Share, By End-Use, 2021

Figure 148: Turkey Market Share, By Application, 2021

Recommendations

Healthcare

Portable Medical Devices Market

Published : February 2023

Healthcare

Pain Management Devices Market

Published : October 2022

Healthcare

Diabetes Care Devices Market

Published : July 2022

Explore Healthcare Insights

View Reports

Vitrectomy Devices Market