

- Market Size (2026)
- USD 920.7 Mn
- Forecast (2036)
- USD 2159.7 Mn
- CAGR (2026 to 2036)
- 8.9%
How big is the Washable Label Adhesives Market?
The Washable Label Adhesives Market is projected to grow from USD 920.7 million in 2026 to USD 2159.7 million by 2036, at a CAGR of 8.9%.
The market was valued at USD 845.5 million in 2025 and is forecast to reach USD 920.7 million in 2026. Revenue is projected to reach USD 2159.7 million by 2036 at a CAGR of 8.9% from 2026 to 2036.
In April 2024, Henkel announced cyclos-HTP certification for AQUENCE PS 3017 RE. The water-based acrylic PSA supports wash-off PET bottle labels. In May 2024, UPM Raflatac, now UPM Adhesive Materials, introduced New Wave label material for HDPE and PP packaging. The product washes off at 40°C using plain water.
EU packaging rules require all packaging to be recyclable by 2030, while FDA rules treat adhesives used in food packaging as food-contact substances when they may become part of the finished package.
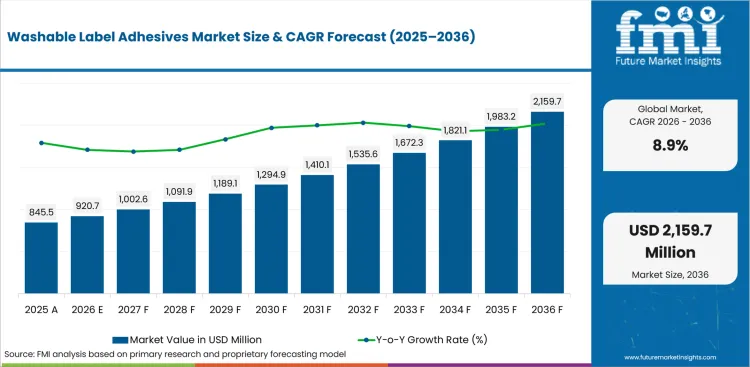
| Metric | Value |
|---|---|
| 2025 Market Size | USD 845.5 million |
| 2026 Market Size | USD 920.7 million |
| 2036 Market Size | USD 2,159.7 million |
| Forecast CAGR (2026-2036) | 8.9% |
| Leading Adhesive Type | Wash-off Acrylics |
| Wash-off Acrylics Share (2026) | 46.0% |
| Leading Container Type | PET Bottles |
| PET Bottles Share (2026) | 58.0% |
| Fastest-growing Country | China |
| China CAGR by 2036 | 9.8% |
Summary of the Washable Label Adhesives Market
| Market Signal | Commercial Impact |
|---|---|
| Demand and Growth Drivers | Demand for wash-off label adhesives is increasing as packaging producers and consumer brands prioritize recyclable packaging solutions that improve bottle-to-bottle recycling efficiency and support circular economy initiatives.
|
| Product and Segment View | Wash-off acrylic adhesives, PET bottles, and beverage packaging continue to represent the largest commercial opportunities across the market.
|
| Geography and Growth Outlook | Asia continues to lead market expansion through stronger recycling regulations, packaging sustainability initiatives, and extended producer responsibility (EPR) programs.
|
| Competitive Landscape | Competition increasingly focuses on adhesive performance, recycling compatibility, regulatory compliance, and technical support for sustainable packaging applications.
|
| Analyst Perspective | Wash-off label adhesives are evolving from conventional packaging materials into critical enablers of high-quality plastic recycling and circular packaging systems.
- Nikhil Kaitwade, Principal Consultant at Future Market Insights |
Why is the Washable Label Adhesives Market growing?
PET recycling systems need labels that release cleanly during washing and do not contaminate recycled flakes. Beverage brands specify washable adhesives as deposit return systems and bottle-to-bottle goals tighten packaging requirements.
- PET recycling systems need labels that release cleanly during washing and do not contaminate recycled flakes.
- Beverage brands specify washable adhesives as deposit return systems and bottle-to-bottle goals tighten packaging requirements.
- Food packaging buyers need adhesive chemistries that align with food-contact review and container recovery expectations.
Bottle recovery economics are reshaping the buying decision for label adhesives. H.B. Fuller states that PET beverage labels must release cleanly in hot caustic washing, and its Earthic 4000 labeling adhesive is described for line speeds up to 37,000 bottles per hour. That level of line compatibility shows why buyers do not treat wash-off systems as niche sustainability add-ons. The adhesive must work at production speed before it creates recycling value. Suppliers that prove both conditions can defend premium positions with bottlers and converters. Recycling protocols are also turning washable label claims into measurable performance questions. RecyClass updated its evaluation protocol for labels and adhesives applied on PET bottles with input from PET value-chain experts.
How is the Washable Label Adhesives Market segmented?
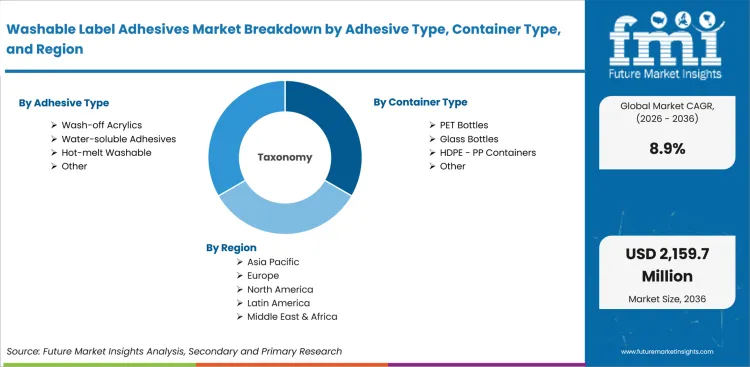
The Washable Label Adhesives Market is segmented by adhesive type, container type, end use, label type, sales channel, and region.
- With an estimated 46.0% share in 2026, Wash-off Acrylics are expected to lead the adhesive-type category as they suit pressure-sensitive label systems.
- PET Bottles are projected to account for 58.0% of the container type category in 2026 with bottle-to-bottle recovery pressure.
- Beverage applications are expected to represent 52.0% of the end-use category in 2026 as drink containers face stronger collection scrutiny.
How does Wash-off Acrylics contribute to the adhesive type category?
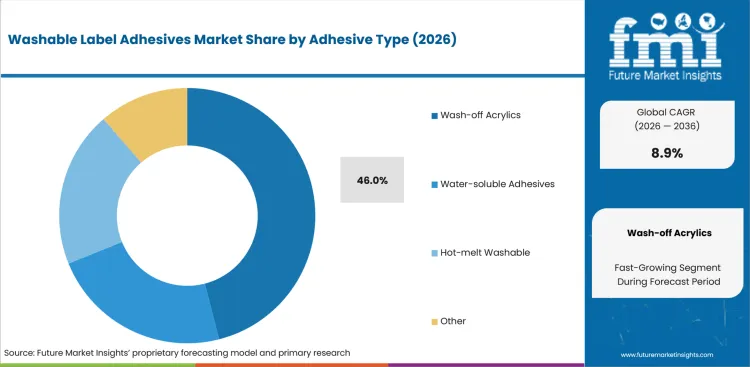
- Wash-off Acrylics are projected to account for 46.0% of adhesive type revenue in 2026 as they combine pressure-sensitive label convertibility with controlled release during PET wash cycles.
- Acrylic systems often win premium label specifications since they can be tuned for clarity, wet tack, and residue control across chilled beverage handling.
What supports demand for PET Bottles?
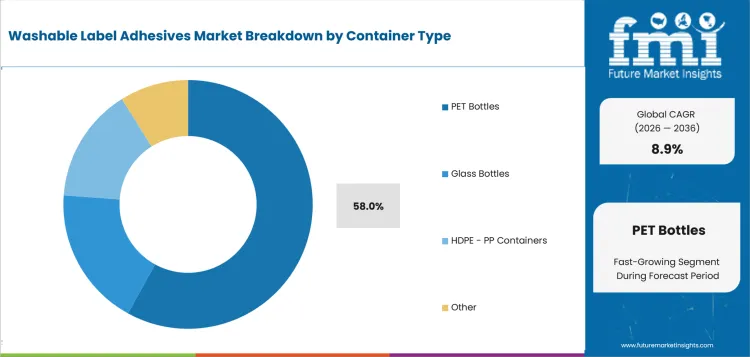
- PET Bottles are expected to account for 58.0% of container type demand in 2026 as bottle-to-bottle recycling places strict limits on adhesive contamination.
- PET applications demand stronger proof than other containers since adhesive residue can lower flake quality and weaken recycler acceptance for clear bottle streams.
How do buyers evaluate Beverage within the end use category?
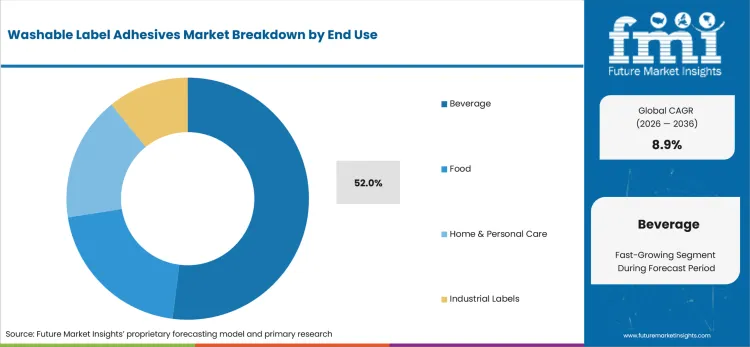
- Beverage is anticipated to represent 52.0% of end-use revenue in 2026 as drink containers sit at the center of deposit return and collection systems.
- Beverage buyers compare adhesive systems against wash temperature, ice-bucket resistance, and filling-line speed before approving labelstock for national packaging runs.
What market factors influence demand for Pressure-sensitive Labels?
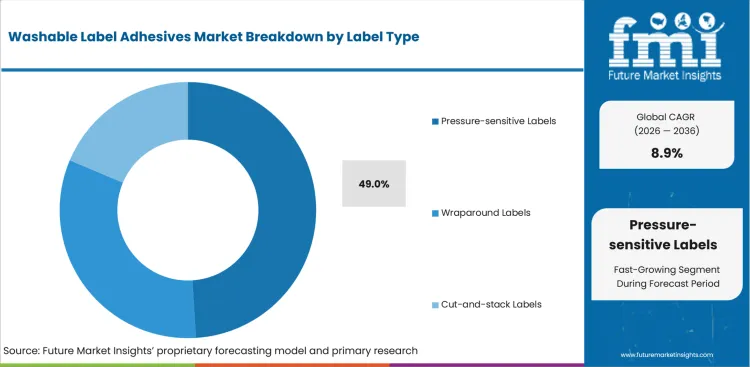
- Pressure-sensitive Labels are projected to account for 49.0% of label type demand in 2026 as premium packaging needs clean graphics and flexible decoration.
- Pressure-sensitive formats can carry variable branding and short-run designs, which makes wash-off performance especially important for seasonal beverage lines.
How does Direct to Label Converters affect the sales channel outlook?
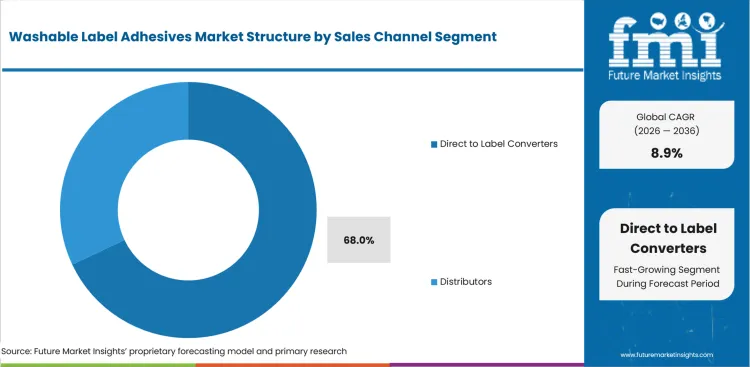
- Direct to Label Converters are expected to represent 68.0% of sales channel revenue in 2026 since converters approve adhesive choice before brands scale labels.
- Converter sales require technical trials, press compatibility checks, and recycling claims support, so suppliers with application labs have a clear channel advantage.
What drives and restrains the market?
Driver: Recycling-compatible label design is the notable driver as PET and HDPE recyclers penalize adhesive residue; restraint: Cold-chain beverage labels create a performance barrier as adhesives must resist moisture before releasing in wash systems; opportunity: HDPE and PP personal care containers create an opportunity as brands seek wash-off labels beyond PET bottles.
The market reflects a balance between the identified demand driver, adoption constraints, and the supplier opportunity outlined below.
- Driver: Recycling-compatible label design is the notable driver as PET and HDPE recyclers penalize adhesive residue.
- Restraint: Cold-chain beverage labels create a performance barrier as adhesives must resist moisture before releasing in wash systems.
- Opportunity: HDPE and PP personal care containers create an opportunity as brands seek wash-off labels beyond PET bottles.
PET Flake Residue Control: PET recycling value depends on flake cleanliness, so washable label adhesives are judged by what they leave behind after washing. Avery Dennison describes CleanFlake as a technology that allows pressure-sensitive label materials to separate from PET with no adhesive residue left on flakes. That type of evidence changes sales discussions with bottle brands and converters. The buyer is not just buying adhesion during use. The buyer is reducing the risk that a label lowers recycled PET quality after collection.
Low-temperature Wash-off Needs: Wash-off performance is extending beyond caustic PET wash systems into lower-temperature and water-based cleaning conditions. UPM Adhesive Materials describes its New Wave label material as washing off cleanly at 40°C using plain water without added chemicals. This matters for home and personal care packaging because HDPE and PP containers often move through different wash conditions than PET beverage bottles. Suppliers with lower-temperature release options can address a wider container pool and reduce dependence on one recycling process. Certification-linked Buyer Confidence: Buyer confidence improves when wash-off claims are backed by third-party recognition or recycling protocol evidence.
Which factors support expansion?
Commercial expansion is reinforced by the value, workflow, and recurring-demand factors below.
- Value is rising as brand owners treat label removal as a packaging design requirement instead of a recycler-only concern.
- PET bottle applications create a premium pool as suppliers must prove adhesion during use and clean separation during washing.
- Food and beverage buyers pay close attention to regulatory status since packaging adhesives can fall under food-contact requirements.
Which country markets are included in the CAGR comparison?
The selected CAGR comparison covers China (9.8%), India (9.5%), South Korea (9.2%), United Kingdom (8.7%), and Japan (8.6%) through 2036.
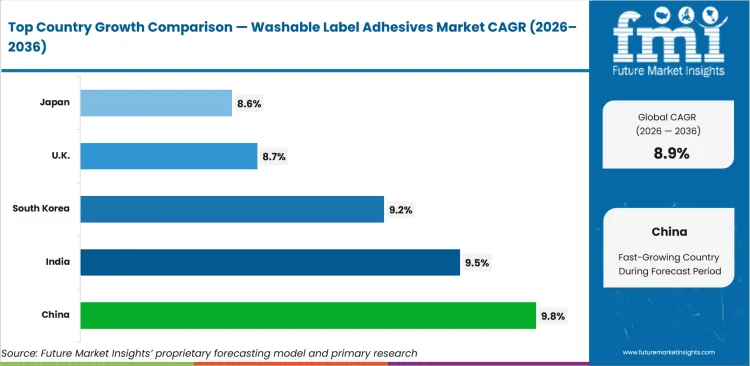
| Country | CAGR |
|---|---|
| China | 9.8% |
| India | 9.5% |
| South Korea | 9.2% |
| United Kingdom | 8.7% |
| Japan | 8.6% |
Source: Future Market Insights analysis.
How do country-level CAGRs compare?
- China (CAGR: 9.8%): High-volume bottled beverage packaging creates a large PET label opportunity.
- India (CAGR: 9.5%): Beverage, food, and personal care packaging create a broad rigid-container label opportunity.
- South Korea (CAGR: 9.2%): Clear PET sorting and label separation rules support interest in removable label systems.
- United Kingdom (CAGR: 8.7%): PET drink bottles drive near-term specification activity ahead of deposit return planning.
- Japan (CAGR: 8.6%): High PET bottle collection creates a strong need for labels that do not disrupt recycling.
The global Washable Label Adhesives Market is forecast to record a CAGR of 8.9% from 2026 to 2036. The study covers 30+ countries across the report regions.
How is the Washable Label Adhesives Market developing in China?
China is projected to record a CAGR of 9.8% through 2036. The country outlook identifies this demand signal: High-volume bottled beverage packaging creates a large PET label opportunity.
Country Market Snapshot
| Country | China |
|---|---|
| Forecast CAGR | 9.8% |
| Demand anchor | High-volume bottled beverage packaging creates a large PET label opportunity. |
| Pilot signal | A China beverage recycling project reported label removal above 99.9%. |
| Channel route | Major beverage brands and label converters drive trial adoption before wider scale-up. |
| Application mix | PET beverage labels dominate the first wave of high-value recyclable label projects. |
| Restraint | Regional recycling quality varies across cities and collection systems. |
| Company context | Companies active in or serving this market include UPM Adhesive Materials, Avery Dennison, Henkel, H.B. Fuller, and LINTEC. |
| Executive implication | Executive teams should compare qualification requirements, local service depth, and total implementation economics before selecting suppliers. |
Market Outlook
China is forecast to grow at a CAGR of 9.8% through 2036 as high-volume beverage packaging moves toward higher-quality recycled PET. In a China project involving UPM Raflatac (now UPM Adhesive Materials) and Nongfu Spring, RW85C PET wash-off labels achieved a label removal rate above 99.9% during trials. That proof point shows how large beverage owners can turn washable adhesives into a scale-ready packaging decision. Demand behavior in China is shaped by large brand trials before full commercial rollout.
Key Growth Drivers
- Large beverage groups can scale a verified wash-off label system across high-volume PET bottle lines.
- Recycled PET quality goals create demand for labels that separate without damaging clear flake streams.
- International supplier partnerships support knowledge transfer into China’s domestic packaging recovery systems.
- PET beverage labels dominate the first wave of high-value recyclable label projects.
Key Restraints
- Recycling infrastructure quality differs across regions, which weakens uniform national adoption timing.
- Cost pressure from high-volume beverage packs can slow conversion from standard label adhesives.
- Regional recycling quality varies across cities and collection systems.
Country Market FAQs
What should C-suite teams prioritize in China?
C-suite teams should prioritize qualification requirements, procurement routes, local service coverage, and implementation economics before committing capital or supplier volume.
How should suppliers approach the China market?
Suppliers should align technical evidence, local channel support, and account-specific commercial terms with the buying process used by major customers in China.
What can weaken the business case in China?
Regional recycling quality varies across cities and collection systems. Executives should test this exposure during supplier, investment, and rollout reviews.
How is the Washable Label Adhesives Market developing in India?
India is projected to record a CAGR of 9.5% through 2036. The country outlook identifies this demand signal: Beverage, food, and personal care packaging create a broad rigid-container label opportunity.
Country Market Snapshot
| Country | India |
|---|---|
| Forecast CAGR | 9.5% |
| Demand anchor | Beverage, food, and personal care packaging create a broad rigid-container label opportunity. |
| Policy context | Plastic packaging EPR rules push registered brand owners toward better recovery outcomes. |
| Compliance signal | India reported 60,128 registered producers, importers, and brand owners under plastic packaging EPR. |
| Channel route | Large FMCG brands influence converter trials through national packaging specifications. |
| Restraint | Price sensitivity among regional converters slows premium adhesive conversion. |
| Company context | Companies active in or serving this market include Avery Dennison India, UPM Adhesive Materials, Henkel India, H.B. Fuller India, and Bostik India. |
| Executive implication | Executive teams should compare qualification requirements, local service depth, and total implementation economics before selecting suppliers. |
Market Outlook
India is expected to grow at a CAGR of 9.5% through 2036 as EPR compliance moves packaging design higher on the brand agenda. India’s environment ministry reported 3,012 registered plastic waste processors under plastic packaging EPR. This creates a larger compliance network in which recyclable label design can gain attention. Indian demand will grow unevenly across large national brands and regional packaging users. FMCG and beverage companies can justify washable adhesives where recyclability claims and EPR documentation affect brand risk.
Key Growth Drivers
- EPR registration increases brand attention on packaging choices that support recycling outcomes.
- Beverage and FMCG brands create repeat demand for labels on PET and HDPE containers.
- Large converters can introduce washable adhesives during broader packaging redesign programs.
- Beverage, food, and personal care packaging create a broad rigid-container label opportunity.
Key Restraints
- Regional label printers may resist premium adhesive costs without clear brand reimbursement.
- Informal and uneven waste collection can reduce the near-term value of high-spec label systems.
- Price sensitivity among regional converters slows premium adhesive conversion.
Country Market FAQs
What should C-suite teams prioritize in India?
C-suite teams should prioritize qualification requirements, procurement routes, local service coverage, and implementation economics before committing capital or supplier volume.
How should suppliers approach the India market?
Suppliers should align technical evidence, local channel support, and account-specific commercial terms with the buying process used by major customers in India.
What can weaken the business case in India?
Price sensitivity among regional converters slows premium adhesive conversion. Executives should test this exposure during supplier, investment, and rollout reviews.
How is the Washable Label Adhesives Market developing in South Korea?
South Korea is projected to record a CAGR of 9.2% through 2036. The country outlook identifies this demand signal: Clear PET sorting and label separation rules support interest in removable label systems.
Country Market Snapshot
| Country | South Korea |
|---|---|
| Forecast CAGR | 9.2% |
| Demand anchor | Clear PET sorting and label separation rules support interest in removable label systems. |
| Policy context | Separate discharge marking guides how packaging materials are sorted by consumers. |
| Label signal | Korea’s marking system includes Clear PET and plastic container categories. |
| Application mix | Beverage and beauty packaging drive substantial label design pressure. |
| Restraint | Label-free PET bottles reduce adhesive use in selected beverage formats. |
| Company context | Companies active in or serving this market include Avery Dennison, UPM Adhesive Materials, Henkel, H.B. Fuller, and LINTEC. |
| Executive implication | Executive teams should compare qualification requirements, local service depth, and total implementation economics before selecting suppliers. |
Market Outlook
South Korea is expected to record a CAGR of 9.2% through 2036 as consumer-facing sorting rules shape packaging design. The Korea Environment Corporation describes a Separate Discharge Mark System that helps consumers sort packaging materials subject to recycling obligations. This makes label material choice more visible to both brands and recyclers. Korean demand is not limited to beverage bottles. Beauty and personal care packaging adds demand for labels that maintain appearance while supporting container recovery.
Key Growth Drivers
- Clear PET sorting guidance creates pressure for labels that do not disrupt bottle recycling.
- Beauty exporters need packaging that can support sustainability claims in overseas retail channels.
- Consumer sorting symbols make label material choices easier for brands to explain and defend.
- Clear PET sorting and label separation rules support interest in removable label systems.
Key Restraints
- Label-free bottle formats reduce addressable demand in some high-volume beverage categories.
- Local supplier visibility is fragmented, which increases the cost of competitive mapping and qualification.
- Label-free PET bottles reduce adhesive use in selected beverage formats.
Country Market FAQs
What should C-suite teams prioritize in South Korea?
C-suite teams should prioritize qualification requirements, procurement routes, local service coverage, and implementation economics before committing capital or supplier volume.
How should suppliers approach the South Korea market?
Suppliers should align technical evidence, local channel support, and account-specific commercial terms with the buying process used by major customers in South Korea.
What can weaken the business case in South Korea?
Label-free PET bottles reduce adhesive use in selected beverage formats. Executives should test this exposure during supplier, investment, and rollout reviews.
How is the Washable Label Adhesives Market developing in the United Kingdom?
The United Kingdom is projected to record a CAGR of 8.7% through 2036. The country outlook identifies this demand signal: PET drink bottles drive near-term specification activity ahead of deposit return planning.
Country Market Snapshot
| Country | United Kingdom |
|---|---|
| Forecast CAGR | 8.7% |
| Demand anchor | PET drink bottles drive near-term specification activity ahead of deposit return planning. |
| Policy context | The UK plans a deposit return scheme for October 2027 across England, Northern Ireland, and Scotland. |
| Waste signal | UK plastic packaging recycling reached 51.0% in 2024 under official waste reporting. |
| Channel route | Retailer packaging rules influence label choices across private label beverage and food lines. |
| Restraint | The deposit scheme excludes some materials and creates different priorities by container format. |
| Company context | Companies active in or serving this market include Avery Dennison, UPM Adhesive Materials, Henkel, H.B. Fuller, and Bostik. |
| Executive implication | Executive teams should compare qualification requirements, local service depth, and total implementation economics before selecting suppliers. |
Market Outlook
The United Kingdom market is expected to grow at a CAGR of 8.7% through 2036 as deposit return planning changes beverage packaging choices. The Department for Environment, Food & Rural Affairs said about 25 billion single-use drinks containers are bought each year across the UK. That scale gives label compatibility real commercial weight for beverage brands and converters. UK packaging buyers also face rising proof demands under EPR and recycling target systems.
Key Growth Drivers
- Deposit return planning creates stronger interest in PET bottle labels that release cleanly after collection.
- Retailer packaging scorecards push suppliers toward recyclable label structures for private label products.
- Converter trials are likely to increase as plastic packaging recycling targets rise through 2027.
- PET drink bottles drive near-term specification activity ahead of deposit return planning.
Key Restraints
- Deposit return scope differences can slow adoption for containers outside the main beverage stream.
- Small label printers may delay washable adhesive trials due to cost and technical support needs.
- The deposit scheme excludes some materials and creates different priorities by container format.
Country Market FAQs
What should C-suite teams prioritize in the United Kingdom?
C-suite teams should prioritize qualification requirements, procurement routes, local service coverage, and implementation economics before committing capital or supplier volume.
How should suppliers approach the United Kingdom market?
Suppliers should align technical evidence, local channel support, and account-specific commercial terms with the buying process used by major customers in the United Kingdom.
What can weaken the business case in the United Kingdom?
The deposit scheme excludes some materials and creates different priorities by container format. Executives should test this exposure during supplier, investment, and rollout reviews.
How is the Washable Label Adhesives Market developing in Japan?
Japan is projected to record a CAGR of 8.6% through 2036. The country outlook identifies this demand signal: High PET bottle collection creates a strong need for labels that do not disrupt recycling.
Country Market Snapshot
| Country | Japan |
|---|---|
| Forecast CAGR | 8.6% |
| Demand anchor | High PET bottle collection creates a strong need for labels that do not disrupt recycling. |
| Policy context | Industry-led PET recycling systems shape packaging design choices. |
| Recycling signal | Japan’s PET bottle collection rate reached 91.9% in 2024. |
| Channel route | Beverage companies and convenience retail systems influence packaging standards. |
| Restraint | Label-free bottles can reduce adhesive use in some water and tea formats. |
| Company context | Companies active in or serving this market include LINTEC, artience, Nitto Denko, Avery Dennison, and UPM Adhesive Materials. |
| Executive implication | Executive teams should compare qualification requirements, local service depth, and total implementation economics before selecting suppliers. |
Market Outlook
Japan is projected to grow at a CAGR of 8.6% through 2036 as clean PET recovery remains a high-value packaging priority. The PET Bottle Recycling Promotion Council reported 599,611 tonnes of PET bottle collection in 2024. This high recovery flow increases the cost of adhesive residue and label contamination. Japanese buyers tend to favor tested material changes over broad claims.
Key Growth Drivers
- High PET collection rates make label release performance important for recycled material quality.
- Beverage and convenience retail packaging cycles support repeat trials of removable label materials.
- Local labelstock expertise supports faster development of cold-chain compatible washable solutions.
- High PET bottle collection creates a strong need for labels that do not disrupt recycling.
Key Restraints
- Label-free PET bottles reduce addressable adhesive demand in selected clear beverage categories.
- Strict brand and retailer standards can lengthen qualification for new adhesive chemistries.
- Label-free bottles can reduce adhesive use in some water and tea formats.
Country Market FAQs
What should C-suite teams prioritize in Japan?
C-suite teams should prioritize qualification requirements, procurement routes, local service coverage, and implementation economics before committing capital or supplier volume.
How should suppliers approach the Japan market?
Suppliers should align technical evidence, local channel support, and account-specific commercial terms with the buying process used by major customers in Japan.
What can weaken the business case in Japan?
Label-free bottles can reduce adhesive use in some water and tea formats. Executives should test this exposure during supplier, investment, and rollout reviews.
Which companies are discussed in the Washable Label Adhesives Market?
The preview discusses Avery Dennison, UPM Adhesive Materials, H.B. Fuller, Henkel, and Bostik among the companies active in this market.
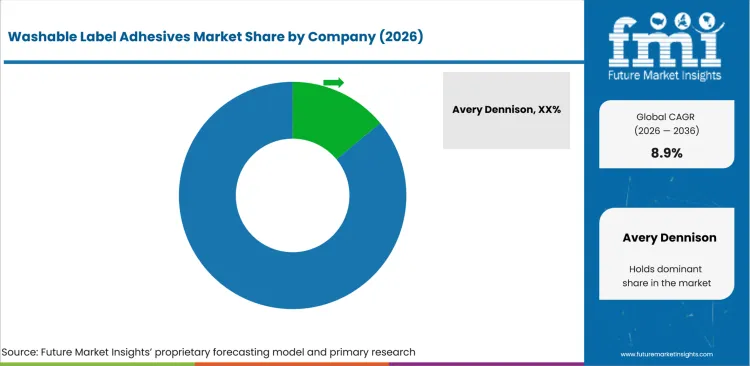
The market is moderately concentrated as global label material and adhesive suppliers control many proof-backed technologies. Established companies hold advantage through test data, food-contact knowledge, and converter support. Smaller firms compete in regional converter service and specialty removable adhesive niches.
Entry barriers are high where PET wash-off validation and line-speed performance must be proven. Certification depth and wash-temperature range decide which suppliers enter major brand specifications. Competitive behavior is shaped by proof, not by adhesive chemistry alone.
How is competition structured?
Competition reflects differences in specialization, portfolio scope, geographic reach, evidence, and customer access.
Competition is organized around adhesive formulators, label material suppliers, and converter-facing technical specialists.
- Label Material Leaders: Avery Dennison and UPM Adhesive Materials compete with proof-backed label material systems for PET and HDPE recycling.
- Adhesive Formulators: H.B. Fuller, Henkel, and Bostik compete through wash-off chemistry, cold-chain performance, and recycler-aligned product development. Their advantage is notable where converters need direct adhesive support for PET beverage labels or food-contact packaging conditions.
- Regional and Specialist Suppliers: HERMA and LINTEC compete through labelstock development, European wash-off material depth, and Japanese removable label expertise. Their position is notable in applications where converters need specialty face materials with adhesive systems tuned for local packaging rules.
How do selected companies compare?
The selected companies differ in portfolio focus, geographic reach, evidence depth, and channel strength.
| Company | Competitive position |
|---|---|
| Avery Dennison | Avery Dennison is assessed for formulation or material technology, technical support, qualification evidence, and regional channel reach. |
| UPM Adhesive Materials | UPM Adhesive Materials is assessed for formulation or material technology, technical support, qualification evidence, and regional channel reach. |
| H.B. Fuller | H.B. Fuller is assessed for formulation or material technology, technical support, qualification evidence, and regional channel reach. |
| Henkel | Henkel is assessed for formulation or material technology, technical support, qualification evidence, and regional channel reach. |
| Bostik | Bostik is assessed for formulation or material technology, technical support, qualification evidence, and regional channel reach. |
What are the key developments in the Washable Label Adhesives Market?
- In April 2024, Henkel announced cyclos-HTP certification for AQUENCE PS 3017 RE. The water-based acrylic PSA supports wash-off PET bottle labels.
- In May 2024, UPM Raflatac, now UPM Adhesive Materials, introduced New Wave label material for HDPE and PP packaging. The product washes off at 40°C using plain water.
- In March 2025, LINTEC launched removable labelstock using a low environmental impact hot-melt adhesive. The product can be applied as cold as minus 5°C.
Selected Companies in the Washable Label Adhesives Market
Companies referenced in this preview
- Avery Dennison.
- UPM Adhesive Materials.
- H.B. Fuller.
- Henkel.
- Bostik.
- LINTEC.
- artience.
- Nitto Denko.
Market Scope & Definition
| Metric | Value |
|---|---|
| Market definition | The Washable Label Adhesives Market covers adhesive systems used on labels that must separate from containers during washing, recycling, reuse, or cleaning. |
| Adhesive Types Covered | Wash-off Acrylics, Water-soluble Adhesives, Hot-melt Washable, Other |
| End-use industries | Beverage, Food, Home & Personal Care, Industrial Labels |
| Inclusions | Market scope covers adhesive types including Wash-off Acrylics, Water-soluble Adhesives, Hot-melt Washable, and Other grades; container types including PET Bottles, Glass Bottles, HDPE / PP Containers, and Other containers; end uses including Beverage, Food, Home & Personal Care, and Industrial Labels; label types including Pressure-sensitive Labels, Wraparound Labels, Cut-and-stack Labels. |
| Exclusions | The market excludes non-washable pressure-sensitive adhesives, permanent safety labels, carton glues, shipping labels, industrial bonding adhesives, sleeve films without adhesive layers, and direct-to-container printing systems. |
Research Methodology
| Metric | Value |
|---|---|
| Primary Research | FMI analysts reviewed inputs from label converters, packaging engineers, beverage packaging buyers, adhesive formulators, and recycling-system stakeholders. Interviews focused on wash-off performance, converter qualification, brand-owner specifications, and recycler acceptance. |
| Desk Research | used packaging waste rules, food-contact guidance, recycling protocols, and supplier technical information to define the addressable product pool. The review separated direct washable label adhesive evidence from broader packaging adhesive evidence. |
| Market Sizing and Forecasting | The model combined adhesive consumption by container type, label format use, regional packaging recovery pressure, and average selling prices. Forecast assumptions were adjusted for PET recycling intensity, converter adoption, and end-use packaging mix. |
| Data Validation | Forecasts were checked against packaging regulation signals, recycler compatibility protocols, and documented company product activity. Segment shares were cross-checked against beverage label use, PET bottle dominance, and direct converter purchasing behavior. |
What does the report cover?
The report covers adhesive type, container type, end use, label type, sales channel, and region across the 2026-2036 forecast period in 30+ countries.
| Metric | Value |
|---|---|
| Periods | Base year 2025; estimated year 2026; forecast period 2026-2036 |
| Segment axes | adhesive type, container type, end use, label type, sales channel, and region |
| Regions | Global analysis with selected country coverage limited to the countries listed below |
| Countries | United States, United Kingdom, Germany, France, Japan, China, South Korea, India and 30+ countries |
| Companies | Avery Dennison, UPM Adhesive Materials, H.B. Fuller, Henkel, Bostik, LINTEC, artience, Nitto Denko, and others |
| Approach | Hybrid bottom-up and top-down methodology using adhesive volume, packaging formats, converter qualification, and country-level recovery pressure. |
Market Segmentation Analysis
Segmented by Adhesive Type
- Wash-off Acrylics.
- Water-soluble Adhesives.
- Hot-melt Washable.
- Other.
Segmented by Container Type
- PET Bottles.
- Glass Bottles.
- HDPE / PP Containers.
- Other.
Segmented by End Use
- Beverage.
- Food.
- Home & Personal Care.
- Industrial Labels.
Segmented by Label Type
- Pressure-sensitive Labels.
- Wraparound Labels.
- Cut-and-stack Labels.
Segmented by Sales Channel
- Direct to Label Converters.
- Distributors.
By Region
- North America.
- United States.
- Western Europe.
- United Kingdom.
- Germany.
- France.
- East Asia.
- China.
- Japan.
- South Korea.
- South Asia and Pacific.
- India.
Research Sources and Bibliography
- European Commission. (2025). Packaging waste. European Commission.
- USA Food and Drug Administration. (2024). Food contact substances. USA Food and Drug Administration.
- RecyClass. (2025). RecyClass advances recyclability evaluation for labels and adhesives. RecyClass.
- H.B. Fuller. (2025). PET beverage labeling. H.B. Fuller.
- Avery Dennison. (2025). AD CleanFlake technology. Avery Dennison.
- Department for Environment, Food & Rural Affairs. (2025). Introducing the deposit return scheme for drinks containers. GOV.UK.
- Government of India. (2026). Plastic waste management and EPR guidelines update. Press Information Bureau.
- European Environment Agency. (2024). Country profile: France packaging waste. European Environment Agency.
- European Environment Agency. (2025). Country profile: Germany packaging waste. European Environment Agency.
- Department for Environment, Food & Rural Affairs. (2025). UK statistics on waste. GOV.UK.
- USA Environmental Protection Agency. (2026). Plastics: Material-specific data. USA Environmental Protection Agency.
- USA Plastics Pact. (2024). 2023-24 Impact Report. USA Plastics Pact.
- National Association for PET Container Resources. (2025). 2024 PET Recycling Report. NAPCOR.
- PET Bottle Recycling Promotion Council. (2025). PET bottle collection rate trend. PET Bottle Recycling Promotion Council.
- Korea Environment Corporation. (2025). Separate discharge indication system. Korea Environment Corporation.
- Henkel. (2024). Henkel’s innovative wash-off adhesive receives cyclos-HTP certification. Henkel.
The bibliography is provided for reader reference and uses government, regulatory, trade body, and official company publications.
This Report Answers
- What is the projected value of the Washable Label Adhesives Market in 2026?
- What value is forecast for the Washable Label Adhesives Market by 2036?
- What CAGR is forecast for the Washable Label Adhesives Market from 2026 to 2036?
- What 2026 share is projected for Wash-off Acrylics within the adhesive type category?
- What 2026 share is projected for PET Bottles within the container type category?
- Which demand factors support the Washable Label Adhesives Market outlook?
- Which restraints and opportunities affect adoption in the Washable Label Adhesives Market?
- How are country CAGR outlooks, including China at 9.8%, compared?
- Which companies and product developments are covered in the competitive analysis?
- What is included in the market scope, and how is the forecast validated?
Frequently Asked Questions
Why should executives track the Washable Label Adhesives Market?
Executives should track this market because it can affect capital allocation, supplier strategy, operating risk, and competitive positioning across commercial planning cycles.
What business problem does the Washable Label Adhesives Market address?
It helps executive teams judge where customer pain, supplier capability, compliance exposure, and implementation economics justify investment, procurement, or portfolio action.
What should procurement leaders evaluate before selecting suppliers?
Procurement leaders should assess evidence quality, integration fit, service coverage, compliance readiness, total cost of ownership, and supplier execution capability.
What can limit return on investment for buyers?
Return on investment can be limited by low utilization, integration delays, training gaps, unclear ownership, pricing pressure, or weak fit with existing workflows.
How can suppliers build executive confidence?
Suppliers can build confidence by proving implementation speed, risk reduction, support depth, reference use cases, and measurable outcomes for budget owners.
Preview the report firsthand - request a free sample
Get SampleGet the brochure for pricing and purchase details.
Get PDFTable of Content
- Key Takeaways
- Market Size and CAGR
- Top Growth Driver
- Fastest Growing Segment
- Leading Region
- Key Companies
- Emerging Opportunities
- Executive Summary
- Global Market Outlook
- Demand-side Trends
- Supply-side Trends
- Technology Roadmap Analysis
- Analysis and Recommendations
- Analyst Perspective (What is happening? Why now? What should investors know?)
- Key Questions Answered
- How large is the market?
- What is the CAGR?
- What are key trends?
- Which region dominates?
- Who are the leaders?
- Market Overview
- Market Coverage / Taxonomy
- Market Definition / Scope / Limitations
- Research Methodology
- Chapter Orientation
- Analytical Lens and Working Hypotheses
- Market Structure, Signals, and Trend Drivers
- Benchmarking and Cross-market Comparability
- Market Sizing, Forecasting, and Opportunity Mapping
- Research Design and Evidence Framework
- Desk Research Programme (Secondary Evidence)
- Expert Input and Fieldwork (Primary Evidence)
- Tooling, Models, and Reference Databases
- Data Engineering and Model Build
- Quality Assurance and Audit Trail
- Market Background
- Market Dynamics (Drivers, Restraints, Opportunity, Trends)
- Scenario Forecast (Optimistic, Likely, Conservative)
- Impact Analysis
- AI Impact
- Sustainability Impact
- Regulatory Impact
- Technology Impact
- Consumer / Buyer Analysis
- Purchase Drivers
- Adoption Barriers
- Buyer Journey
- Opportunity Map Analysis
- Product Life Cycle Analysis
- Supply Chain Analysis
- Investment Feasibility Matrix
- Value Chain Analysis
- PESTLE and Porter's Analysis
- Regulatory Landscape
- Regional Parent Market Outlook
- Production and Consumption Statistics
- Import and Export Statistics
- Global Market Analysis and Forecast, 2021 to 2036
- Historical Market Size Value (USD Million) & Volume (Unit) Analysis, 2021 to 2025
- Current and Future Market Size Value (USD Million) & Volume (Unit) Projections, 2026 to 2036
- Y-o-Y Growth Trend Analysis
- Absolute $ Opportunity Analysis
- Global Market Pricing Analysis, 2021 to 2036
- Global Market Analysis and Forecast, By Adhesive Type, 2021 to 2036
- Introduction / Key Findings
- Historical Market Size Value (USD Million) & Volume (Unit) Analysis By Adhesive Type, 2021 to 2025
- Current and Future Market Size Value (USD Million) & Volume (Unit) Analysis and Forecast By Adhesive Type, 2026 to 2036
- Wash-off Acrylics
- Water-soluble Adhesives
- Hot-melt Washable
- Other
- Wash-off Acrylics
- Y-o-Y Growth Trend Analysis By Adhesive Type, 2021 to 2025
- Absolute $ Opportunity Analysis By Adhesive Type, 2026 to 2036
- Global Market Analysis and Forecast, By Container Type, 2021 to 2036
- Introduction / Key Findings
- Historical Market Size Value (USD Million) & Volume (Unit) Analysis By Container Type, 2021 to 2025
- Current and Future Market Size Value (USD Million) & Volume (Unit) Analysis and Forecast By Container Type, 2026 to 2036
- PET Bottles
- Glass Bottles
- HDPE - PP Containers
- Other
- PET Bottles
- Y-o-Y Growth Trend Analysis By Container Type, 2021 to 2025
- Absolute $ Opportunity Analysis By Container Type, 2026 to 2036
- Global Market Analysis and Forecast, By End Use, 2021 to 2036
- Introduction / Key Findings
- Historical Market Size Value (USD Million) & Volume (Unit) Analysis By End Use, 2021 to 2025
- Current and Future Market Size Value (USD Million) & Volume (Unit) Analysis and Forecast By End Use, 2026 to 2036
- Beverage
- Food
- Home & Personal Care
- Industrial Labels
- Beverage
- Y-o-Y Growth Trend Analysis By End Use, 2021 to 2025
- Absolute $ Opportunity Analysis By End Use, 2026 to 2036
- Global Market Analysis and Forecast, By Label Type, 2021 to 2036
- Introduction / Key Findings
- Historical Market Size Value (USD Million) & Volume (Unit) Analysis By Label Type, 2021 to 2025
- Current and Future Market Size Value (USD Million) & Volume (Unit) Analysis and Forecast By Label Type, 2026 to 2036
- Pressure-sensitive Labels
- Wraparound Labels
- Cut-and-stack Labels
- Pressure-sensitive Labels
- Y-o-Y Growth Trend Analysis By Label Type, 2021 to 2025
- Absolute $ Opportunity Analysis By Label Type, 2026 to 2036
- Global Market Analysis and Forecast, By Sales Channel, 2021 to 2036
- Introduction / Key Findings
- Historical Market Size Value (USD Million) & Volume (Unit) Analysis By Sales Channel, 2021 to 2025
- Current and Future Market Size Value (USD Million) & Volume (Unit) Analysis and Forecast By Sales Channel, 2026 to 2036
- Direct to Label Converters
- Distributors
- Direct to Label Converters
- Y-o-Y Growth Trend Analysis By Sales Channel, 2021 to 2025
- Absolute $ Opportunity Analysis By Sales Channel, 2026 to 2036
- Global Market Analysis and Forecast, By Region, 2021 to 2036
- Introduction
- Historical Market Size Value (USD Million) & Volume (Unit) Analysis By Region, 2021 to 2025
- Current Market Size Value (USD Million) & Volume (Unit) Analysis and Forecast By Region, 2026 to 2036
- North America
- Latin America
- Western Europe
- Eastern Europe
- East Asia
- South Asia and Pacific
- Middle East & Africa
- Market Attractiveness Analysis By Region
- North America Market Analysis and Forecast, By Country, 2021 to 2036
- Historical Market Size Value (USD Million) & Volume (Unit) Trend Analysis By Market Taxonomy, 2021 to 2025
- Market Size Value (USD Million) & Volume (Unit) Forecast By Market Taxonomy, 2026 to 2036
- By Country
- USA
- Canada
- Mexico
- By Adhesive Type
- By Container Type
- By End Use
- By Label Type
- By Sales Channel
- By Country
- Market Attractiveness Analysis
- By Country
- By Adhesive Type
- By Container Type
- By End Use
- By Label Type
- By Sales Channel
- Key Takeaways
- Latin America Market Analysis and Forecast, By Country
- Historical Market Size Value (USD Million) & Volume (Unit) Trend Analysis By Market Taxonomy, 2021 to 2025
- Market Size Value (USD Million) & Volume (Unit) Forecast By Market Taxonomy, 2026 to 2036
- By Country
- Brazil
- Chile
- Rest of Latin America
- By Adhesive Type
- By Container Type
- By End Use
- By Label Type
- By Sales Channel
- By Country
- Market Attractiveness Analysis
- By Country
- By Adhesive Type
- By Container Type
- By End Use
- By Label Type
- By Sales Channel
- Key Takeaways
- Western Europe Market Analysis and Forecast, By Country
- Historical Market Size Value (USD Million) & Volume (Unit) Trend Analysis By Market Taxonomy, 2021 to 2025
- Market Size Value (USD Million) & Volume (Unit) Forecast By Market Taxonomy, 2026 to 2036
- By Country
- Germany
- UK
- Italy
- Spain
- France
- Nordic
- BENELUX
- Rest of Western Europe
- By Adhesive Type
- By Container Type
- By End Use
- By Label Type
- By Sales Channel
- By Country
- Market Attractiveness Analysis
- By Country
- By Adhesive Type
- By Container Type
- By End Use
- By Label Type
- By Sales Channel
- Key Takeaways
- Eastern Europe Market Analysis and Forecast, By Country
- Historical Market Size Value (USD Million) & Volume (Unit) Trend Analysis By Market Taxonomy, 2021 to 2025
- Market Size Value (USD Million) & Volume (Unit) Forecast By Market Taxonomy, 2026 to 2036
- By Country
- Russia
- Poland
- Hungary
- Balkan & Baltic
- Rest of Eastern Europe
- By Adhesive Type
- By Container Type
- By End Use
- By Label Type
- By Sales Channel
- By Country
- Market Attractiveness Analysis
- By Country
- By Adhesive Type
- By Container Type
- By End Use
- By Label Type
- By Sales Channel
- Key Takeaways
- East Asia Market Analysis and Forecast, By Country
- Historical Market Size Value (USD Million) & Volume (Unit) Trend Analysis By Market Taxonomy, 2021 to 2025
- Market Size Value (USD Million) & Volume (Unit) Forecast By Market Taxonomy, 2026 to 2036
- By Country
- China
- Japan
- South Korea
- By Adhesive Type
- By Container Type
- By End Use
- By Label Type
- By Sales Channel
- By Country
- Market Attractiveness Analysis
- By Country
- By Adhesive Type
- By Container Type
- By End Use
- By Label Type
- By Sales Channel
- Key Takeaways
- South Asia and Pacific Market Analysis and Forecast, By Country
- Historical Market Size Value (USD Million) & Volume (Unit) Trend Analysis By Market Taxonomy, 2021 to 2025
- Market Size Value (USD Million) & Volume (Unit) Forecast By Market Taxonomy, 2026 to 2036
- By Country
- India
- ASEAN
- Australia & New Zealand
- Rest of South Asia and Pacific
- By Adhesive Type
- By Container Type
- By End Use
- By Label Type
- By Sales Channel
- By Country
- Market Attractiveness Analysis
- By Country
- By Adhesive Type
- By Container Type
- By End Use
- By Label Type
- By Sales Channel
- Key Takeaways
- Middle East & Africa Market Analysis and Forecast, By Country
- Historical Market Size Value (USD Million) & Volume (Unit) Trend Analysis By Market Taxonomy, 2021 to 2025
- Market Size Value (USD Million) & Volume (Unit) Forecast By Market Taxonomy, 2026 to 2036
- By Country
- Kingdom of Saudi Arabia
- Other GCC Countries
- Türkiye
- South Africa
- Other African Union
- Rest of Middle East & Africa
- By Adhesive Type
- By Container Type
- By End Use
- By Label Type
- By Sales Channel
- By Country
- Market Attractiveness Analysis
- By Country
- By Adhesive Type
- By Container Type
- By End Use
- By Label Type
- By Sales Channel
- Key Takeaways
- Key Countries Market Analysis
- USA
- Pricing Analysis
- Market Share Analysis, 2025
- By Adhesive Type
- By Container Type
- By End Use
- By Label Type
- By Sales Channel
- Canada
- Pricing Analysis
- Market Share Analysis, 2025
- By Adhesive Type
- By Container Type
- By End Use
- By Label Type
- By Sales Channel
- Mexico
- Pricing Analysis
- Market Share Analysis, 2025
- By Adhesive Type
- By Container Type
- By End Use
- By Label Type
- By Sales Channel
- Brazil
- Pricing Analysis
- Market Share Analysis, 2025
- By Adhesive Type
- By Container Type
- By End Use
- By Label Type
- By Sales Channel
- Chile
- Pricing Analysis
- Market Share Analysis, 2025
- By Adhesive Type
- By Container Type
- By End Use
- By Label Type
- By Sales Channel
- Germany
- Pricing Analysis
- Market Share Analysis, 2025
- By Adhesive Type
- By Container Type
- By End Use
- By Label Type
- By Sales Channel
- UK
- Pricing Analysis
- Market Share Analysis, 2025
- By Adhesive Type
- By Container Type
- By End Use
- By Label Type
- By Sales Channel
- Italy
- Pricing Analysis
- Market Share Analysis, 2025
- By Adhesive Type
- By Container Type
- By End Use
- By Label Type
- By Sales Channel
- Spain
- Pricing Analysis
- Market Share Analysis, 2025
- By Adhesive Type
- By Container Type
- By End Use
- By Label Type
- By Sales Channel
- France
- Pricing Analysis
- Market Share Analysis, 2025
- By Adhesive Type
- By Container Type
- By End Use
- By Label Type
- By Sales Channel
- India
- Pricing Analysis
- Market Share Analysis, 2025
- By Adhesive Type
- By Container Type
- By End Use
- By Label Type
- By Sales Channel
- ASEAN
- Pricing Analysis
- Market Share Analysis, 2025
- By Adhesive Type
- By Container Type
- By End Use
- By Label Type
- By Sales Channel
- Australia & New Zealand
- Pricing Analysis
- Market Share Analysis, 2025
- By Adhesive Type
- By Container Type
- By End Use
- By Label Type
- By Sales Channel
- China
- Pricing Analysis
- Market Share Analysis, 2025
- By Adhesive Type
- By Container Type
- By End Use
- By Label Type
- By Sales Channel
- Japan
- Pricing Analysis
- Market Share Analysis, 2025
- By Adhesive Type
- By Container Type
- By End Use
- By Label Type
- By Sales Channel
- South Korea
- Pricing Analysis
- Market Share Analysis, 2025
- By Adhesive Type
- By Container Type
- By End Use
- By Label Type
- By Sales Channel
- Russia
- Pricing Analysis
- Market Share Analysis, 2025
- By Adhesive Type
- By Container Type
- By End Use
- By Label Type
- By Sales Channel
- Poland
- Pricing Analysis
- Market Share Analysis, 2025
- By Adhesive Type
- By Container Type
- By End Use
- By Label Type
- By Sales Channel
- Hungary
- Pricing Analysis
- Market Share Analysis, 2025
- By Adhesive Type
- By Container Type
- By End Use
- By Label Type
- By Sales Channel
- Kingdom of Saudi Arabia
- Pricing Analysis
- Market Share Analysis, 2025
- By Adhesive Type
- By Container Type
- By End Use
- By Label Type
- By Sales Channel
- Türkiye
- Pricing Analysis
- Market Share Analysis, 2025
- By Adhesive Type
- By Container Type
- By End Use
- By Label Type
- By Sales Channel
- South Africa
- Pricing Analysis
- Market Share Analysis, 2025
- By Adhesive Type
- By Container Type
- By End Use
- By Label Type
- By Sales Channel
- USA
- Market Structure Analysis
- Competition Dashboard
- Competition Benchmarking
- Market Share Analysis of Top Players
- By Regional
- By Adhesive Type
- By Container Type
- By End Use
- By Label Type
- By Sales Channel
- Emerging Startups
- Innovation Benchmarking
- Competition Analysis
- Competition Deep Dive
- Avery Dennison
- Overview
- Product Portfolio
- Profitability by Market Segments (Product/Region/Sales Channel)
- Sales Footprint
- Strategy Overview
- Marketing Strategy
- Product Strategy
- Channel Strategy
- UPM Adhesive Materials
- H.B. Fuller
- Henkel
- Bostik
- LINTEC
- artience
- Nitto Denko
- Avery Dennison
- Case Studies
- Success Stories
- Recent Developments
- Competition Deep Dive
- Assumptions & Acronyms Used


