
- Market Size (2026)
- USD 11.1 Bn
- Forecast (2036)
- USD 18.1 Bn
- CAGR (2026 to 2036)
- 5.0%
How big is the Well Intervention Market in 2026?
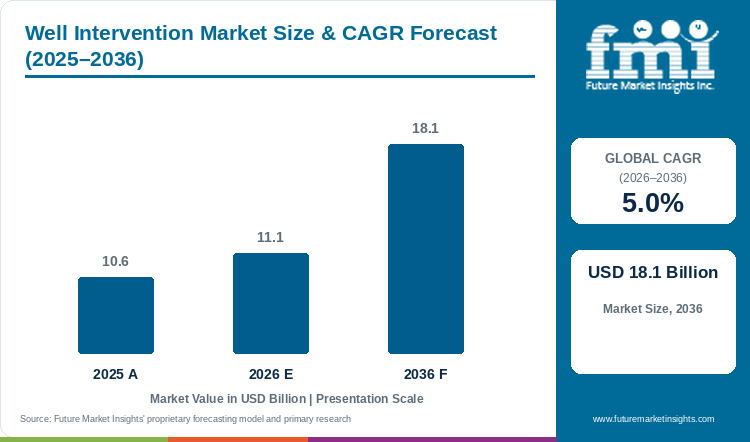
The Well Intervention Market is projected to reach USD 18.1 billion by 2036, growing at a 5.0% CAGR from 2026 to 2036. The market stands at USD 11.1 billion in 2026.
Well Intervention Market Size and Forecast
Table 1: Well Intervention Market Size and Forecast
| Market size and forecast | Value |
|---|---|
| Market size in 2025 | USD 10.6 billion |
| Estimated market size in 2026 | USD 11.1 billion |
| Projected market size by 2036 | USD 18.1 billion |
| CAGR from 2026 to 2036 | 5.0% |
Source: Future Market Insights analysis of the well intervention market, 2026.
The market was valued at USD 10.6 billion in 2025. SLB said on 23 October 2026 that Reservoir Performance revenue of USD 1.6 billion rose 5% sequentially. Higher intervention, evaluation and stimulation services drove the rise, particularly in the Middle East. Baker Hughes reported on 27 October 2026 that its Completions, Intervention, and Measurements product line earned USD 1.0 billion in the quarter. The line was up 7% on both the second quarter and the third quarter of 2025.
Oil price and well economics set the tone. The US Energy Information Administration's outlook of 6 October 2026 expects Brent to average USD 96 a barrel in 2026 and USD 105 in the fourth quarter. It then eases to USD 84 in 2027, assuming Middle East oil flows stay constrained through the fourth quarter . A higher oil price improves the return on restoring an existing well compared with drilling a new one. Pemex carried out 546 well interventions in the second quarter of 2026 alone, and the UK regulator's wells report counts 558 shut-in wells on the UK Continental Shelf. Expro said on 28 July 2026 that the conflict had lasted longer than it expected and tempered its second-quarter results.
Key Market Trends & Insights
- On 1 September 2026, Helix Energy Solutions and Hornbeck Offshore Services completed their merger. The combined company, renamed Hornbeck Offshore Services, Inc., trades on the New York Stock Exchange as HOS. Its well intervention segment earned USD 76.6 million of vessel revenue in September. The average dayrate was USD 362,162. The segment operated eight vessels after the merger, while the quarter's consolidation-weighted average fleet was 2.6 vessels.
- On 13 August 2026, the North Sea Transition Authority and leading operators signed a well decommissioning charter. The regulator cites industry figures suggesting that vessels, instead of rigs, could cut the cost of the remaining subsea wellhead removals by about 30%, or roughly GBP 200.0 million. More than 1,000 further UK wells are due for decommissioning over the next five years.
- Vessel-based and subsea methods are widening. Baker Hughes said on 27 October 2026 that it secured a bp award for integrated offshore production enhancement and stimulation services. The award uses a vessel-based solution featuring StimFORCE technology. Expro reported a UK well abandonment campaign of 2,490 hours with zero non-productive time in its second-quarter 2026 results.
Regional Highlights
- North America: Alberta's Directive 088 was updated with effect from 8 October 2026 and replaces the 21 April 2026 edition. The Inventory Reduction Program it governs predates the update, and its closure-quota table starts in 2022. SLB said North America grew in the third quarter on stronger US land evaluation and intervention services.
- Europe: the UK Continental Shelf carries 558 shut-in wells, and 398 interventions were carried out in 2025. The Netherlands drilled 12 hydrocarbon wells in 2025, 4 on land and 8 at sea.
- Mexico: Pemex completed 35 wells, performed 41 major workovers and carried out 546 interventions in the second quarter of 2026.
Analyst Perspective
“Intervention spending follows the installed well base, not the drilling cycle. Where oil prices are high and wells are shut in or declining, operators pay to restore output before they commit to new wells. The same logic applies when regulators push closures forward. Two things need watching: how many intervention days regulators and national companies schedule, and whether the vessel or crew is free when the work window opens. Multi-year agreements with a named asset and a defined downtime allowance protect the programme better than call-off pricing.”
- Sudip Saha, Principal Consultant, FMI
How is the Well Intervention Market segmented?
- By application: Onshore and Offshore
- By intervention type: Light Intervention, Medium Intervention and Heavy Intervention
- By service: Logging and Bottomhole Survey, Tubing / Packer Failure and Repair, Stimulation, Remedial Cementing, Zonal Isolation and Sand Control
- By region: North America and Europe
Why does Onshore lead by Application in the Well Intervention Market in 2026?
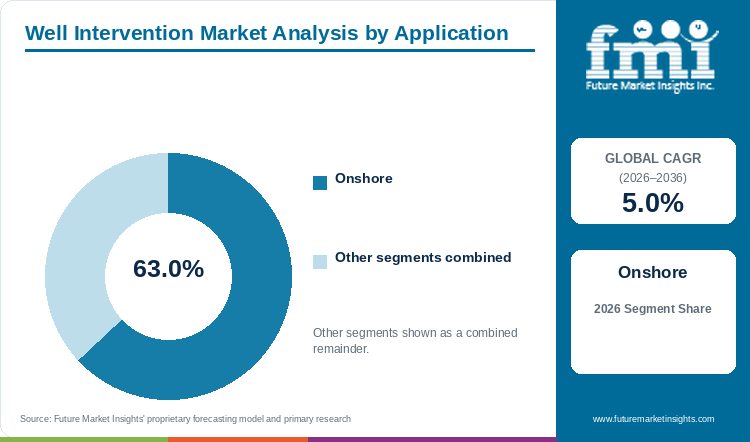
Onshore accounts for 63.0% of the Well Intervention Market by application in 2026. The size of the producing well stock and the low cost of each job drive this share. Pemex alone averaged 5,595 wells in operation in the second quarter of 2026. It logged 546 interventions in the quarter, of which 428 were minor workovers and 118 were well stimulation treatments [24]. SLB reported in the third quarter of 2026 that North America grew on stronger US land evaluation and intervention services [6]. Halliburton states that the oil and gas industry relies on well intervention to maintain, improve and restore well productivity [12]. Alberta's Directive 088, updated on 8 October 2026, sets closure quotas under its Inventory Reduction Program [25][27]. Offshore is the smaller share by value. A vessel job carries a high daily cost, but that alone does not explain the share. Hornbeck's average dayrate in well intervention was USD 362,162 in September 2026 [1].
Table 2: Application, 2026 Share
| Leading Share | 2026 market share |
|---|---|
| Onshore | 63.0% |
| All Other Segments Combined Share | 37.0% |
Source: Future Market Insights analysis of the well intervention market, 2026.
Why does Light Intervention lead by Intervention Type in the Well Intervention Market in 2026?
Light Intervention accounts for 49.0% of the Well Intervention Market by intervention type in 2026. Several profiled providers sell cable-based work or the equipment for it. Archer says it now provides the complete range of slickline and electric line wireline intervention services [16]. Hunting's Well Intervention Equipment division makes pressure control equipment, slickline equipment, E Line tools and thru-tubing technology [11]. The offshore version of light work is growing too. Oceaneering says its well intervention approach avoids the high costs and downtime of rig-based operations, and that its multi-service vessels can reduce project costs by up to 50% [18]. Halliburton says its subsea completion and intervention systems let operators clear blockages or re-perforate wells without costly drilling rigs [15]. Buyers comparing these services with coiled tubing should check which tools each supplier sells.
Table 3: Intervention Type, 2026 Share
| Leading Share | 2026 market share |
|---|---|
| Light Intervention | 49.0% |
| All Other Segments Combined Share | 51.0% |
Source: Future Market Insights analysis of the well intervention market, 2026.
Why does Logging and Bottomhole Survey lead by Service in the Well Intervention Market in 2026?
Logging and Bottomhole Survey accounts for 34.0% of the Well Intervention Market by service in 2026. Almost every other intervention starts with a measurement. Halliburton's cased hole tools cover production logging, cement evaluation through tubing before intervention, and corrosion evaluation. The corrosion work can pinpoint casing defects in up to seven tubular strings [13]. Baker Hughes lists a cement bond service that confirms hydraulic isolation between reservoir layers. It also lists a casing inspection service that finds corrosion or mechanical defects early enough for remedial action to be planned [14]. Expro lists well integrity surveillance and data management among its four intervention capabilities, aimed at barrier integrity and regulatory compliance [17]. A survey informs the choice among the other five services, and Halliburton positions its cement evaluation as a way to verify zonal isolation before intervention begins [13]. The UK regulator's wells report put the cost per barrel added through intervention at GBP 7.60 in 2025, down from GBP 9.60 in 2024 [21].
Table 4: Service, 2026 Share
| Leading Share | 2026 market share |
|---|---|
| Logging and Bottomhole Survey | 34.0% |
| All Other Segments Combined Share | 66.0% |
Source: Future Market Insights analysis of the well intervention market, 2026.
What are the key drivers, restraints and opportunities?
Driver
Shut-in and ageing wells. Operators prefer to restore existing wells when prices are firm. The UK regulator's Wells Insight report, summarised by the trade body ICoTA on 12 August 2026, says 56 wells were reinstated in 2025. Those wells added 16 million barrels of oil equivalent, and 558 wells remain shut in [21]. Pemex reported 41 major workovers and 546 interventions in the second quarter of 2026 [24]. Equinor said on 28 October 2026 that Norwegian shelf production stayed stable against the third quarter of 2025. New fields and new wells helped offset natural decline [22].
Firm oil prices. The EIA expects Brent to average USD 96 a barrel in 2026 and USD 105 in the fourth quarter [19]. SLB's Middle East business grew 13% sequentially in the third quarter of 2026, despite late-quarter disruptions [6]. Baker Hughes signed a multi-year contract with Oil & Gas Development Company to optimise production and recovery across more than 120 wells in Pakistan's mature fields [7]. Contracts like this tie spending to wells that already exist.
Restraint
Middle East disruption. Expro said the conflict has persisted longer than it had anticipated and temporarily moderated activity growth in its high-margin businesses in the region [4]. Hunting said in its third-quarter 2026 trading update that the protracted and deepening conflict affected its results in the third quarter and into the fourth. It now guides to full-year 2026 EBITDA of USD 128.0 million to USD 133.0 million [11].
Fewer jobs and limited vessels. The UK regulator flagged a drop in the total number of interventions carried out in 2025 [21]. Helix reported on 6 August 2026 that its Q4000 had an annual out-of-service period and that the Sea Helix 1 entered its scheduled five-year regulatory dry-docking/survey in mid-June [3]. Pemex's average wells in operation fell by 108 wells, or 1.9%, year on year in the second quarter of 2026 [24].
Opportunity
Vessel-based decommissioning. The NSTA charter of 13 August 2026 sets up a workgroup to define a cost-effective framework for wellhead severance by vessels instead of rigs, with a backlog of 500 inactive wells awaiting final abandonment [20]. Hornbeck has been awarded a two-year decommissioning contract for integrated well intervention services in the North Sea, starting in the second quarter of 2027 [1]. Buyers who need subsea equipment can compare the hardware side of the same offshore programmes.
Long-term integrated contracts. Hornbeck's third-quarter release describes five-year integrated services agreements with Shell in the US Gulf of America, starting in 2027. The release also reports a contracted revenue backlog of about USD 1.9 billion at 30 September 2026 [1]. Weatherford reported a five-year extension from Brunei Shell Petroleum for thru-tubing services across onshore and offshore wells [8].
Well Intervention Market by Country (2026 to 2036)
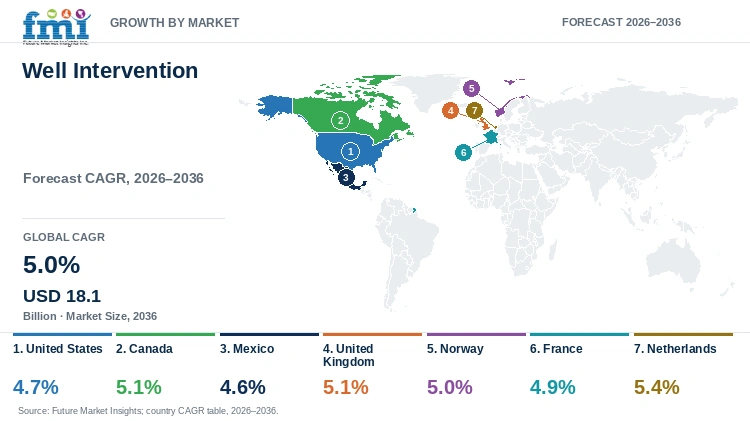
Table 5: Well Intervention Market Country Growth Forecast
| Country | CAGR, 2026 to 2036 |
|---|---|
| United States | 4.7% |
| Canada | 5.1% |
| Mexico | 4.6% |
| United Kingdom | 5.1% |
| Norway | 5.0% |
| France | 4.9% |
| Netherlands | 5.4% |
Source: Future Market Insights analysis of the well intervention market, 2026.
United States
Activity is supported by output and prices. The EIA's outlook of 6 October 2026 puts US crude oil production at 13.9 million barrels a day in 2026 and 14.3 million in 2027, up from 13.7 million in 2025, with Brent at USD 96 a barrel in 2026 [19].
Service companies describe land intervention as a growth area. SLB said in its 23 October 2026 report that North America increased on stronger US land evaluation and intervention services [6]. Halliburton reported North America revenue of USD 2.2 billion in the third quarter of 2026, against USD 3.5 billion internationally [5]. Its Completion and Production segment earned USD 3.1 billion of revenue and USD 457.0 million of operating income [5].
The Gulf of America is the vessel market. Hornbeck describes five-year integrated services agreements with Shell there, starting in 2027, and a total backlog of about USD 1.9 billion [1]. Helix said its Q7000 completed a Shell project in Brazil in April 2026 and then moved to West Africa [3]. Vessels in this niche move between basins.
Canada
Regulation is the main change. Alberta's Directive 088, Licensee Life-Cycle Management, took effect on 8 October 2026. It replaces the edition released on 21 April 2026 [25]. The Inventory Reduction Program it covers predates this edition, and its closure-quota table starts in 2022 [27]. It also covers financial, reserves, closure and compliance information used to assess licensees [25].
Producers are still adding wells. Vermilion's November 2026 corporate presentation outlines a 2027 budget in which Canada takes $385.0 million. The plan is to drill 41 wells in the Deep Basin and 13 in the Montney [26]. A producer drilling that many wells needs logging and completion support, plus a closure programme for the new quotas.
Contractors with abandonment capability gain from the new rule. Closure work uses cementing and zonal isolation. Service lines that once served declining wells now serve a compliance programme with a fixed calendar.
Mexico
Pemex gives the most detailed public record of intervention volumes in the region. Its second-quarter 2026 report, filed on 25 August 2026, shows liquids production of 1,658 thousand barrels a day, up 1.7% on the second quarter of 2025, with 35 wells completed [24]. It also shows 41 major workovers and 546 interventions, made up of 428 minor workovers and 118 well stimulation treatments [24].
Average wells in operation were 5,595, down 108 wells or 1.9% year on year [24]. A shrinking well count while production rises suggests a programme that keeps better wells running through repair work. Stimulation and tubing repair, which raise output per well, fit that programme.
International suppliers are active. SLB reported double-digit growth in Mexico in the third quarter of 2026 [6], and Weatherford reported a one-year integrated services contract with a major drilling contractor offshore Mexico [8]. Mexico's 4.6% forecast CAGR is the lowest of the seven profiled countries. It fits a maturing well base with fewer wells in operation.
United Kingdom
The regulator has set the agenda. On 13 August 2026, the North Sea Transition Authority and leading operators signed a well decommissioning charter. It aims to move final wellhead removal from rigs to vessels. Industry figures cited by the regulator put the saving at about 30%, or roughly GBP 200.0 million, on the remaining subsea wellhead removals [20].
The scale is large. In 2025, operators worked on 257 wells and took 114 to final abandonment. A backlog of 500 inactive wells awaits final abandonment. More than 1,000 further wells are due over five years, and about 1,000 subsea wells remain [20]. Industry spent GBP 2.6 billion on decommissioning in 2025 [20].
Intervention itself is a smaller activity. The Wells Insight report, as summarised by ICoTA, records 398 interventions in 2025 and 56 wells reinstated, adding 16 million barrels of oil equivalent. The cost per barrel added fell to GBP 7.60 from GBP 9.60 in 2024. The regulator noted a drop in the total number of interventions [21]. Expro's UK abandonment campaign of 2,490 hours with zero non-productive time shows the kind of record buyers ask for [4].
Norway
Equinor reported on 28 October 2026 that production on the Norwegian shelf remained high and stable compared with the third quarter of 2025. New fields such as Halten East and Verdande, along with new wells, offset natural decline and unplanned losses from Johan Castberg and Troll [22].
Suppliers are lining up for operator frameworks. Weatherford lists a two-year extension and a new offshore completions award from Equinor, covering the Statfjord and Oseberg licences, in its third-quarter 2026 release [8]. It is a completions award, not an intervention contract. It still shows the same suppliers holding frameworks on these licences.
Prices support keeping wells on line, since the EIA expects Brent at USD 105 in the fourth quarter of 2026 [19]. Hornbeck's two-year decommissioning contract for integrated well intervention services starts in the second quarter of 2027 in the North Sea, a basin Norway shares with the UK [1]. Norwegian demand is therefore steady. It ties to operator frameworks, not to a new regulatory programme.
France
Vermilion Energy describes itself in its November 2026 corporate presentation as the number one domestic oil producer in France, with two-thirds of the domestic industry, and lists an extensive inventory of workovers, recompletions and infill drilling there [26]. For France, workovers are the main way to maintain output from mature fields.
The same presentation says Vermilion has reduced its total well count by 50% since 2022 through asset high-grading and asset retirement obligation spending. It shows group asset retirement settlements of $62.0 million in 2025, with $55.0 million forecast for 2026 and $50.0 million for 2027 [26].
French oil is priced off Brent, which Vermilion cites as an exposure of its legacy oil assets [26], and the EIA expects Brent at USD 96 a barrel in 2026 [19]. A producer with firm prices and a low base decline can justify well-by-well repair work. One operator holds two-thirds of national oil output, so French intervention demand depends heavily on its capital plan.
Netherlands
The Netherlands is a small-field market. The national annual report for 2025, published on 14 October 2026, says total gas production was 8.1 billion normal cubic metres, with small land fields at 2.2 billion and fields at sea at 5.9 billion [23]. Production from small land fields fell 18.9% against 2024 [23].
Groningen is closed. The report states that the bill to end gas production from the Groningen field came into effect on 19 April 2024 and the field was permanently closed [23]. In 2025 operators drilled 12 hydrocarbon wells, 4 on land and 8 at sea, and one installation was decommissioned with its wells plugged with cement and abandoned [23].
Operators continue to invest in small fields. Vermilion's November 2026 presentation plans a Netherlands well (0.5 net) to be spud in the fourth quarter of 2026 with production expected in the first half of 2027, and two wells (1.0 net) in the 2027 budget [26]. With declining fields and steady plug and abandonment work, the 5.4% forecast CAGR is the highest of the seven profiled countries. Life extension and decommissioning services, not new drilling, are the likely drivers.
Who are the notable companies in the Well Intervention Market?
Notable companies in the Well Intervention Market include Archer, Baker Hughes, Expro, Halliburton, Hornbeck Offshore Services (formerly Helix Energy Solutions), Hunting, Oceaneering, SLB and Weatherford.
How the service reaches the well shapes the competitive set. Halliburton, SLB, Baker Hughes and Weatherford sell intervention as one line inside much larger businesses. Halliburton's Completion and Production segment earned USD 3.1 billion of revenue in the third quarter of 2026 [5]. SLB reports intervention inside Reservoir Performance [6]. Baker Hughes reports it inside Completions, Intervention, and Measurements [7]. Weatherford reports it inside Production and Intervention, which earned USD 314.0 million [8]. For these four, intervention is usually sold alongside logging, stimulation and artificial lift.
Specialists compete on a narrower offer. Archer lists slickline and electric line wireline among its well intervention services [16]. It reported third-quarter 2026 revenue of USD 267.6 million across Well Services, Platform Operations and Land Drilling [9]. Expro names production optimisation and remediation, well integrity surveillance, petrophysics support and deployment and conveyance as its intervention capabilities [17]. Hunting supplies the equipment through its Well Intervention Equipment division, which covers manufacturing and services for downhole intervention in producing wells [11].
Vessel owners compete on availability and day rate. Hornbeck's well intervention segment reported an average dayrate of USD 362,162 and 88.1% utilization for September 2026 [1]. Oceaneering presents well intervention as a route that avoids the cost and downtime of rig-based operations [18]. Downtime matters in this niche. Helix noted that the Q4000 had an annual out-of-service period, and the Sea Helix 1 began a five-year docking in mid-June 2026 [3].
Key Developments in the Well Intervention Market
- On 1 September 2026, Helix Energy Solutions and Hornbeck Offshore Services completed their merger, and the combined company was renamed Hornbeck Offshore Services, Inc. [2].
- On 4 November 2026, Hornbeck reported third-quarter results that include one month of legacy Helix operations. The results also describe five-year integrated services agreements with Shell in the US Gulf of America, starting in 2027. The release also covers a two-year decommissioning contract for integrated well intervention services in the North Sea, starting in the second quarter of 2027 [1].
- On 20 October 2026, Weatherford reported third-quarter results that include a five-year extension from Brunei Shell Petroleum for thru-tubing services across onshore and offshore wells [8].
- On 27 October 2026, Baker Hughes reported that it secured a bp award for integrated offshore production enhancement and stimulation services using a vessel-based solution featuring StimFORCE technology [7].
Key Players in the Well Intervention Market
- Archer Limited
- Baker Hughes Company
- Expro
- Halliburton Company
- Hornbeck Offshore Services, Inc. (formerly Helix Energy Solutions Group)
- Hunting PLC
- Oceaneering International, Inc.
- SLB
- Weatherford International plc
Well Intervention Market Report Scope
Table 6: Well Intervention Market Report Scope
| Coverage field | Report scope |
|---|---|
| Market definition | Services that access, evaluate, repair or change a producing or shut-in oil and gas well without a full drilling campaign, measured by the value of service sales |
| Application | Onshore, Offshore |
| Intervention Type | Light Intervention, Medium Intervention, Heavy Intervention |
| Service | Logging and Bottomhole Survey, Tubing / Packer Failure and Repair, Stimulation, Remedial Cementing, Zonal Isolation, Sand Control |
| Regions and profiled countries | North America and Europe. Profiled countries: United States, Canada, Mexico, United Kingdom, Norway, France and Netherlands. |
| Companies covered | Archer Limited, Baker Hughes Company, Expro, Halliburton Company, Hornbeck Offshore Services, Inc., Hunting PLC, Oceaneering International, Inc., SLB, Weatherford International plc |
| Forecast period | 2026 to 2036, with 2025 as the historical base year |
| Quantitative Units | USD billion |
Source: Future Market Insights analysis of the well intervention market, 2026.
Well Intervention Market by Segments
Well Intervention Market segmented by Application:
- Onshore
- Offshore
Well Intervention Market segmented by Intervention Type:
- Light Intervention
- Medium Intervention
- Heavy Intervention
Well Intervention Market segmented by Service:
- Logging and Bottomhole Survey
- Tubing / Packer Failure and Repair
- Stimulation
- Remedial Cementing
- Zonal Isolation
- Sand Control
Well Intervention Market by Region
- North America
- Europe
- United States
- Canada
- Mexico
- United Kingdom
- Norway
- France
- Netherlands
Research Sources and Bibliography
- [1] Hornbeck Offshore Services, Inc. (2026, November 4). Hornbeck Offshore Announces Third Quarter 2026 Results (Form 8-K, Exhibit 99.1). https://www.sec.gov/Archives/edgar/data/866829/000119312526447885/d134833dex991.htm
- [2] Hornbeck Offshore Services, Inc. (2026, September). Current report on completion of the mergers with Helix Energy Solutions Group, Inc. (Form 8-K). https://www.sec.gov/ix?doc=/Archives/edgar/data/866829/000119312526378529/d102206d8k.htm
- [3] Helix Energy Solutions Group, Inc. (2026, August 6). Second quarter 2026 results (Form 8-K, Exhibit 99.1). https://www.sec.gov/Archives/edgar/data/0000866829/000086682926000021/hlx-20260806xex99d1.htm
- [4] Expro Ltd. (2026, July 28). Expro Announces Second Quarter 2026 Results. https://s28.q4cdn.com/960448380/files/doc_financials/2026/q2/Expro-2026-Q2-ER-Final.pdf
- [5] Halliburton Company. (2026, October 20). Halliburton announces third quarter 2026 results. https://www.halliburton.com/en/about-us/press-release/halliburton-announces-third-quarter-2026-results
- [6] SLB Limited. (2026, October 23). Third quarter 2026 results (Form 8-K, Exhibit 99). https://www.sec.gov/Archives/edgar/data/87347/000119312526429435/d151271dex99.htm
- [7] Baker Hughes Company. (2026, October 27). Third quarter 2026 earnings release (Form 8-K, Exhibit 99.1). https://www.sec.gov/Archives/edgar/data/1701605/000170160526000033/earningsreleaseex991093020.htm
- [8] Weatherford International plc. (2026, October 20). Third quarter 2026 earnings release (Form 8-K, Exhibit 99.1). https://www.sec.gov/Archives/edgar/data/1603923/000160392326000118/a2026-q3ex991earningsrelea.htm
- [9] Archer Limited. (2026, October 21). Archer Limited: Q3 2026 trading and shareholder distribution update. https://archerwell.com/archer-limited-q3-2026-trading-and-shareholder-distribution-update/
- [10] Oceaneering International, Inc. (2026, October 21). Third quarter 2026 earnings release (Form 8-K, Exhibit 99.1). https://www.sec.gov/Archives/edgar/data/73756/000007375626000152/exhibit_991x8kx3qx2026.htm
- [11] Hunting PLC. (2026). Q3 2026 Trading Update. https://www.huntingplc.com/news/Q3-2026-Trading-Update
- [12] Halliburton Company. (n.d.). Well intervention and diagnostics. https://www.halliburton.com/en/completions/well-intervention-and-diagnostics
- [13] Halliburton Company. (n.d.). Wireline cased hole logging. https://www.halliburton.com/en/subsurface/formation-evaluation/wireline-cased-hole-logging
- [14] Baker Hughes Company. (n.d.). Wireline well integrity evaluation. https://www.bakerhughes.com/evaluation/wireline-well-integrity-evaluation
- [15] Halliburton Company. (n.d.). Subsea completion and intervention systems. https://www.halliburton.com/en/completions/well-intervention-and-diagnostics/subsea-completion-interventions-systems
- [16] Archer Limited. (n.d.). Well intervention and workover. https://archerwell.com/products-services/well-services/well-intervention-workover/
- [17] Expro. (n.d.). Well intervention and integrity. https://www.expro.com/products-services/well-intervention-and-integrity
- [18] Oceaneering International, Inc. (n.d.). Well intervention. https://www.oceaneering.com/well-intervention/
- [19] U.S. Energy Information Administration. (2026, October 6). Short-Term Energy Outlook. https://www.eia.gov/outlooks/steo/
- [20] North Sea Transition Authority. (2026, August 13). Leading North Sea operators back NSTA well decommissioning charter. https://www.nstauthority.co.uk/news-publications/leading-north-sea-operators-back-nsta-well-decommissioning-charter/
- [21] ICoTA. (2026, August 12). Well Interventions Deliver 16 Million Barrels: What the NSTA's Findings Mean for the Intervention Community. https://www.icota.com/news/well-interventions-deliver-16-million-barrels-what-the-nstas-findings-mean-for-the-intervention-community
- [22] Equinor. (2026, October 28). Equinor third quarter 2026 results. https://www.equinor.com/news/equinor-third-quarter-2026-results
- [23] TNO and Ministry of Economic Affairs and Climate Policy. (2026, October 14). Natural Resources and Geothermal Energy in the Netherlands, Annual Review 2025 (English version). https://www.nlog.nl/media/3781
- [24] Petroleos Mexicanos. (2026, August 25). Second quarter 2026 results (Form 6-K, translation). https://www.sec.gov/Archives/edgar/data/932782/000093278226000021/a2t-2026_traduccion.htm
- [25] Alberta Energy Regulator. (2026, October 8). Directive 088: Licensee Life-Cycle Management. https://www.aer.ca/regulating-development/rules-and-directives/directives/directive-088
- [26] Vermilion Energy Inc. (2026). Corporate Presentation, November 2026. https://www.vermilionenergy.com/wp-content/uploads/2026/11/Vermilion-Energy-Corporate-Presentation-November-2026.pdf
- [27] Alberta Energy Regulator. (n.d.). Inventory Reduction Program: closure quotas. https://www.aer.ca/regulations-and-compliance-enforcement/liability-management-programs/inventory-reduction-program/closure-quotas
Table of Content
- Key Takeaways
- Market Size and CAGR
- Top Growth Driver
- Fastest Growing Segment
- Leading Region
- Key Companies
- Emerging Opportunities
- Executive Summary
- Global Market Outlook
- Demand-side Trends
- Supply-side Trends
- Technology Roadmap Analysis
- Analysis and Recommendations
- Analyst Perspective (What is happening? Why now? What should investors know?)
- Key Questions Answered
- How large is the market?
- What is the CAGR?
- What are key trends?
- Which region dominates?
- Who are the leaders?
Read More...
- Market Overview
- Market Coverage / Taxonomy
- Market Definition / Scope / Limitations
- Research Methodology
- Chapter Orientation
- Analytical Lens and Working Hypotheses
- Market Structure, Signals, and Trend Drivers
- Benchmarking and Cross-market Comparability
- Market Sizing, Forecasting, and Opportunity Mapping
- Research Design and Evidence Framework
- Desk Research Programme (Secondary Evidence)
- Expert Input and Fieldwork (Primary Evidence)
- Tooling, Models, and Reference Databases
- Data Engineering and Model Build
- Quality Assurance and Audit Trail
- Market Background
- Market Dynamics (Drivers, Restraints, Opportunity, Trends)
- Scenario Forecast (Optimistic, Likely, Conservative)
- Impact Analysis
- AI Impact
- Sustainability Impact
- Regulatory Impact
- Technology Impact
- Consumer / Buyer Analysis
- Purchase Drivers
- Adoption Barriers
- Buyer Journey
- Opportunity Map Analysis
- Product Life Cycle Analysis
- Supply Chain Analysis
- Investment Feasibility Matrix
- Value Chain Analysis
- PESTLE and Porter's Analysis
- Regulatory Landscape
- Regional Parent Market Outlook
- Production and Consumption Statistics
- Import and Export Statistics
- Global Market Analysis and Forecast, 2021 to 2036
- Historical Market Size Value (USD Billion) Analysis, 2021 to 2025
- Current and Future Market Size Value (USD Billion) Projections, 2026 to 2036
- Y-o-Y Growth Trend Analysis
- Absolute $ Opportunity Analysis
- Global Market Pricing Analysis, 2021 to 2036
- Global Market Analysis and Forecast, By Application, 2021 to 2036
- Introduction / Key Findings
- Historical Market Size Value (USD Billion) Analysis By Application, 2021 to 2025
- Current and Future Market Size Value (USD Billion) Analysis and Forecast By Application, 2026 to 2036
- Onshore
- Offshore
- Y-o-Y Growth Trend Analysis By Application, 2021 to 2025
- Absolute $ Opportunity Analysis By Application, 2026 to 2036
- Global Market Analysis and Forecast, By Intervention Type, 2021 to 2036
- Introduction / Key Findings
- Historical Market Size Value (USD Billion) Analysis By Intervention Type, 2021 to 2025
- Current and Future Market Size Value (USD Billion) Analysis and Forecast By Intervention Type, 2026 to 2036
- Light Intervention
- Medium Intervention
- Heavy Intervention
- Y-o-Y Growth Trend Analysis By Intervention Type, 2021 to 2025
- Absolute $ Opportunity Analysis By Intervention Type, 2026 to 2036
- Global Market Analysis and Forecast, By Service, 2021 to 2036
- Introduction / Key Findings
- Historical Market Size Value (USD Billion) Analysis By Service, 2021 to 2025
- Current and Future Market Size Value (USD Billion) Analysis and Forecast By Service, 2026 to 2036
- Logging and Bottomhole Survey
- Tubing / Packer Failure and Repair
- Stimulation
- Remedial Cementing
- Zonal Isolation
- Sand Control
- Y-o-Y Growth Trend Analysis By Service, 2021 to 2025
- Absolute $ Opportunity Analysis By Service, 2026 to 2036
- Global Market Analysis and Forecast, By Region, 2021 to 2036
- Introduction
- Historical Market Size Value (USD Billion) Analysis By Region, 2021 to 2025
- Current Market Size Value (USD Billion) Analysis and Forecast By Region, 2026 to 2036
- North America
- Europe
- Market Attractiveness Analysis By Region
- North America Market Analysis and Forecast, By Country, 2021 to 2036
- Historical Market Size Value (USD Billion) Trend Analysis By Market Taxonomy, 2021 to 2025
- Market Size Value (USD Billion) Forecast By Market Taxonomy, 2026 to 2036
- By Country
- By Application
- By Intervention Type
- By Service
- Market Attractiveness Analysis
- By Country
- By Application
- By Intervention Type
- By Service
- Key Takeaways
- Europe Market Analysis and Forecast, By Country
- Historical Market Size Value (USD Billion) Trend Analysis By Market Taxonomy, 2021 to 2025
- Market Size Value (USD Billion) Forecast By Market Taxonomy, 2026 to 2036
- By Country
- United States
- Canada
- Mexico
- United Kingdom
- Norway
- France
- Netherlands
- By Application
- By Intervention Type
- By Service
- By Country
- Market Attractiveness Analysis
- By Country
- By Application
- By Intervention Type
- By Service
- Key Takeaways
- Key Countries Market Analysis
- United States
- Pricing Analysis
- Market Share Analysis, 2025
- By Application
- By Intervention Type
- By Service
- Canada
- Pricing Analysis
- Market Share Analysis, 2025
- By Application
- By Intervention Type
- By Service
- Mexico
- Pricing Analysis
- Market Share Analysis, 2025
- By Application
- By Intervention Type
- By Service
- United Kingdom
- Pricing Analysis
- Market Share Analysis, 2025
- By Application
- By Intervention Type
- By Service
- France
- Pricing Analysis
- Market Share Analysis, 2025
- By Application
- By Intervention Type
- By Service
- Norway
- Pricing Analysis
- Market Share Analysis, 2025
- By Application
- By Intervention Type
- By Service
- Netherlands
- Pricing Analysis
- Market Share Analysis, 2025
- By Application
- By Intervention Type
- By Service
- United States
- Market Structure Analysis
- Competition Dashboard
- Competition Benchmarking
- Market Share Analysis of Top Players
- By Regional
- By Application
- By Intervention Type
- By Service
- Emerging Startups
- Innovation Benchmarking
- Competition Analysis
- Competition Deep Dive
- Archer
- Overview
- Product Portfolio
- Profitability by Market Segments
- Sales Footprint
- Strategy Overview
- Marketing Strategy
- Product Strategy
- Channel Strategy
- Baker Hughes Company
- Expro
- Halliburton Company
- Hornbeck Offshore Services, Inc.
- Hunting PLC
- Oceaneering International, Inc.
- SLB
- Archer Limited
- Hornbeck Offshore Services, Inc. (formerly Helix Energy Solutions Group)
- Weatherford International plc
- Archer
- Case Studies
- Success Stories
- Recent Developments
- Competition Deep Dive
- Assumptions & Acronyms Used
List of Tables
- Table 1: Global Market Value (USD Billion) Forecast by Region, 2021 to 2036
- Table 2: Global Market Value (USD Billion) Forecast by Application, 2021 to 2036
- Table 3: Global Market Value (USD Billion) Forecast by Intervention Type, 2021 to 2036
- Table 4: Global Market Value (USD Billion) Forecast by Service, 2021 to 2036
- Table 5: North America Market Value (USD Billion) Forecast by Country, 2021 to 2036
- Table 6: North America Market Value (USD Billion) Forecast by Application, 2021 to 2036
- Table 7: North America Market Value (USD Billion) Forecast by Intervention Type, 2021 to 2036
- Table 8: North America Market Value (USD Billion) Forecast by Service, 2021 to 2036
- Table 9: Europe Market Value (USD Billion) Forecast by Country, 2021 to 2036
- Table 10: Europe Market Value (USD Billion) Forecast by Application, 2021 to 2036
- Table 11: Europe Market Value (USD Billion) Forecast by Intervention Type, 2021 to 2036
- Table 12: Europe Market Value (USD Billion) Forecast by Service, 2021 to 2036
List of Figures
- Figure 1: Global Market Pricing Analysis
- Figure 2: Global Market Value (USD Billion) Forecast 2021-2036
- Figure 3: Global Market Value Share and BPS Analysis by Application, 2026 and 2036
- Figure 4: Global Market Y-o-Y Growth Comparison by Application, 2026-2036
- Figure 5: Global Market Attractiveness Analysis by Application
- Figure 6: Global Market Value Share and BPS Analysis by Intervention Type, 2026 and 2036
- Figure 7: Global Market Y-o-Y Growth Comparison by Intervention Type, 2026-2036
- Figure 8: Global Market Attractiveness Analysis by Intervention Type
- Figure 9: Global Market Value Share and BPS Analysis by Service, 2026 and 2036
- Figure 10: Global Market Y-o-Y Growth Comparison by Service, 2026-2036
- Figure 11: Global Market Attractiveness Analysis by Service
- Figure 12: Global Market Value (USD Billion) Share and BPS Analysis by Region, 2026 and 2036
- Figure 13: Global Market Y-o-Y Growth Comparison by Region, 2026-2036
- Figure 14: Global Market Attractiveness Analysis by Region
- Figure 15: North America Market Incremental Dollar Opportunity, 2026-2036
- Figure 16: Europe Market Incremental Dollar Opportunity, 2026-2036
- Figure 17: North America Market Value Share and BPS Analysis by Country, 2026 and 2036
- Figure 18: North America Market Value Share and BPS Analysis by Application, 2026 and 2036
- Figure 19: North America Market Y-o-Y Growth Comparison by Application, 2026-2036
- Figure 20: North America Market Attractiveness Analysis by Application
- Figure 21: North America Market Value Share and BPS Analysis by Intervention Type, 2026 and 2036
- Figure 22: North America Market Y-o-Y Growth Comparison by Intervention Type, 2026-2036
- Figure 23: North America Market Attractiveness Analysis by Intervention Type
- Figure 24: North America Market Value Share and BPS Analysis by Service, 2026 and 2036
- Figure 25: North America Market Y-o-Y Growth Comparison by Service, 2026-2036
- Figure 26: North America Market Attractiveness Analysis by Service
- Figure 27: Europe Market Value Share and BPS Analysis by Country, 2026 and 2036
- Figure 28: Europe Market Value Share and BPS Analysis by Application, 2026 and 2036
- Figure 29: Europe Market Y-o-Y Growth Comparison by Application, 2026-2036
- Figure 30: Europe Market Attractiveness Analysis by Application
- Figure 31: Europe Market Value Share and BPS Analysis by Intervention Type, 2026 and 2036
- Figure 32: Europe Market Y-o-Y Growth Comparison by Intervention Type, 2026-2036
- Figure 33: Europe Market Attractiveness Analysis by Intervention Type
- Figure 34: Europe Market Value Share and BPS Analysis by Service, 2026 and 2036
- Figure 35: Europe Market Y-o-Y Growth Comparison by Service, 2026-2036
- Figure 36: Europe Market Attractiveness Analysis by Service
- Figure 37: Global Market - Tier Structure Analysis
- Figure 38: Global Market - Company Share Analysis
Frequently Asked Questions
How big is the well intervention market in 2026?
The Well Intervention Market is USD 11.1 billion in 2026, up from USD 10.6 billion in 2025. It is projected to reach USD 18.1 billion by 2036, a 5.0% CAGR from 2026 to 2036.
Which segments lead the well intervention market?
Onshore leads by application with 63.0% in 2026, Light Intervention leads by intervention type with 49.0%, and Logging and Bottomhole Survey leads by service with 34.0%. Pemex alone averaged 5,595 wells in operation and carried out 546 interventions in the second quarter of 2026 [24]. Halliburton's cased hole tools cover production logging, cement evaluation and corrosion evaluation [13].
Which other segments matter?
Offshore holds 37.0% by application. By intervention type, Medium Intervention holds 29.0% and Heavy Intervention 22.0%. By service, Tubing / Packer Failure and Repair holds 20.0%, Stimulation 15.0%, Remedial Cementing 12.0%, Zonal Isolation 10.0% and Sand Control 9.0%. Baker Hughes secured a bp award for integrated offshore production enhancement and stimulation services using a vessel-based solution [7].
Which profiled country is forecast to grow fastest?
The Netherlands has the highest forecast CAGR of the seven profiled countries at 5.4% from 2026 to 2036, ahead of Canada and the United Kingdom at 5.1% each and Norway at 5.0%. The Dutch annual review for 2025 reports gas production of 8.1 billion normal cubic metres, 12 hydrocarbon wells drilled and one installation decommissioned in 2025 [23].
Which regulations and programmes are driving demand?
In Canada, Alberta's Directive 088 was updated with effect from 8 October 2026. Its Inventory Reduction Program predates the update, and its closure-quota table starts in 2022 [25][27]. In the United Kingdom, the NSTA and leading operators signed a well decommissioning charter on 13 August 2026 that targets vessel-based wellhead removal, with a backlog of 500 inactive wells awaiting final abandonment [20].
What should an operator check when choosing an intervention provider?
Start with the type of job and the delivery route. Archer offers land crews with slickline and electric line wireline services [16]. Vessel-based work depends on dayrate and utilization, which Hornbeck reported at USD 362,162 and 88.1% for September 2026 [1]. Then check downtime records, since vessels can be out of service for annual or five-year dockings [3].
Preview the report firsthand - request a free sample
Get SampleGet the brochure for pricing and purchase details.
Get PDF
