Whitening Gold Peptide Complex Market Size and Share Forecast Outlook 2025 to 2035

The global Whitening Gold Peptide Complex Market is expected to record a valuation of USD 1,152.6 million in 2025 and USD 3,900.4 million in 2035, with an increase of USD 2,747.8 million, which equals a growth of 193% over the decade. The overall expansion represents a CAGR of 13.0% and more than a 3X increase in market size.
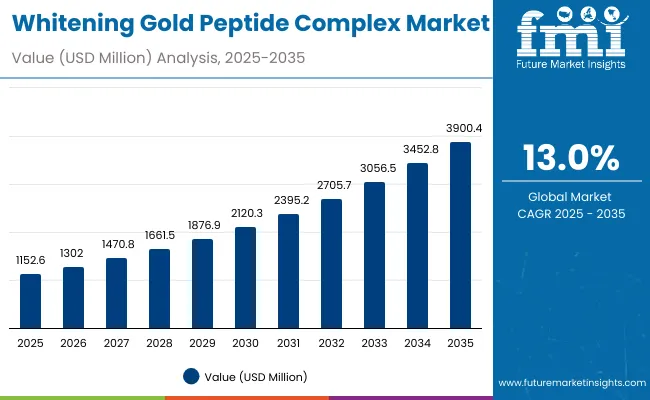
Quick Stats for Global Whitening Gold Peptide Complex Market

  • Whitening Gold Peptide Complex Market Value (2025): USD 1,152.6 million
  • Whitening Gold Peptide Complex Market Forecast Value (2035): USD 3,900.4 million
  • Whitening Gold Peptide Complex Market Forecast CAGR: 13.0%
  • Whitening Gold Peptide Complex Market Leading Segment in 2025: Brightening/whitening (58.6%)
  • Whitening Gold Peptide Complex Market Key Growth Regions: China, India, Japan, USATop Key Players: Shiseido, SK-II, Sulwhasoo, Guerlain, Orogold, Peter Thomas Roth, Tatcha, Kose, Kanebo, The History of Whoo

Whitening Gold Peptide Complex Market

Global Whitening Gold Peptide Complex Market Key Takeaways

Metric Value
Global Whitening Gold Peptide Complex Market Estimated Value in (2025E) USD 1,152.6 million
Global Whitening Gold Peptide Complex Market Forecast Value in (2035F) USD 3,900.4 million
Forecast CAGR (2025 to 2035) 13.0%

During the first five-year period from 2025 to 2030, the market increases from USD 1,152.6 million to USD 2,120.3 million, adding USD 967.7 million, which accounts for 35.2% of the total decade growth. This phase records steady adoption in premium skincare, especially in Asia’s beauty retail chains and e-commerce platforms. Brightening/whitening complexes dominate this period as they cater to over 58% of global demand, driven by consumer preference for even skin tone and reduction of dark spots. Serums, which provide high peptide absorption, lead this phase with nearly half the category value.

The second half from 2030 to 2035 contributes USD 1,780.1 million, equal to 64.8% of total growth, as the market jumps from USD 2,120.3 million to USD 3,900.4 million. This acceleration is powered by the integration of encapsulated gold systems with niacinamide complexes, supported by luxury/premium claims across e-commerce and pharmacy channels. By the end of the decade, demand consolidates in East Asia and North America, with China and India emerging as the fastest-growing markets. Dermatologist-tested, fragrance-free labels gain relevance, with clean-label positioning pushing adoption among younger demographics. The emphasis shifts from hardware-like serum vehicles alone to holistic ecosystem approaches, including masks, ampoules, and hybrid luxury formats.

From 2020 to 2024, the global Whitening Gold Peptide Complex Market grew steadily from a niche segment into a mainstream luxury skincare solution, largely driven by Asia-Pacific beauty retail chains. During this period, Japanese and Korean beauty giants such as Shiseido and Sulwhasoo dominated, supported by their regional expertise and innovation in gold-peptide integration. Competitive differentiation relied on premium positioning, clinical credibility, and sensory experience, while USA and European brands lagged in early adoption. Luxury serums and creams accounted for nearly 70% of total market growth during this phase, with ampoules gaining traction in Korea and Japan as a premium, single-dose innovation.

Demand for whitening gold peptide complexes will expand to USD 1,152.6 million in 2025, and the revenue mix will shift as premium and dermatologist-tested claims grow to dominate over 50% share. Traditional beauty leaders face rising competition from niche luxury entrants offering encapsulated gold delivery systems, hybrid peptide-niacinamide complexes, and fragrance-free clean formulations. Asian beauty conglomerates continue to lead global launches, while Western luxury houses like Guerlain and Peter Thomas Roth emphasize heritage-driven exclusivity. The competitive advantage is shifting away from standalone brightening serums to integrated luxury skincare systems that blend performance, dermatological validation, and aspirational branding.

Why the Global Whitening Gold Peptide Complex Market is Growing?

Advances in peptide biotechnology and gold conjugation systems have improved skin absorption, stability, and efficacy, allowing for targeted brightening and anti-aging benefits. Serums dominate in 2025 because they deliver concentrated gold-peptide complexes directly into the skin, driving faster results. The rise of niacinamide-peptide hybrids has further boosted consumer demand, as these combinations deliver dual action of whitening and barrier repair.

Expansion of Asia’s luxury skincare retail ecosystem especially in China, Japan, and Korea has fueled early adoption, while premium USA and European consumers are embracing gold-peptide complexes as part of multi-step regimens. Innovations in encapsulation technology and 24K gold sheet masks have opened new premium categories. Segment growth is expected to be led by brightening/whitening functions, luxury/premium claims, and serums, with fragrance-free and dermatologist-tested formats accelerating adoption among millennials and Gen Z.

Segmental Analysis

The global Whitening Gold Peptide Complex Market is segmented by complex type, function, product type, distribution channel, and claims. Complex types include gold-peptide conjugates, peptide + niacinamide complexes, encapsulated gold systems, and 24K gold masks/creams, highlighting the diversity in product innovation. Functions include brightening/whitening, dark spot reduction, radiance/glow, and firming, catering to both aesthetic appeal and dermatological needs. By product type, categories cover serums, creams, masks, and ampoules, with serums capturing the largest share due to their efficiency and ease of use.

Distribution channels include Asia beauty retail, e-commerce, pharmacies, and premium beauty retail, demonstrating the mix of traditional and digital sales strategies. Claims play a central role in marketing and consumer trust, with luxury/premium, dermatologist-tested, clean-label, and fragrance-free leading positioning strategies. Regionally, the scope spans North America, Latin America, Europe, East Asia, South Asia & Pacific, and Middle East & Africa, with China, India, and Japan showing the highest CAGR over the forecast period.
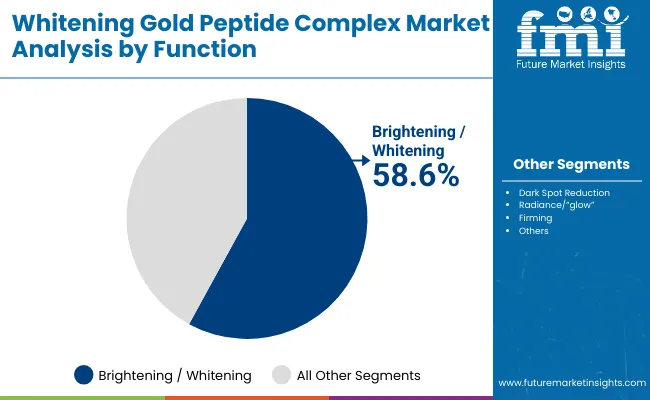
Insights into the Function Segment with Brightening/Whitening Leading in Market Share

Whitening Gold Peptide Complex Market By Function

Function Value Share% 2025
Brightening/whitening 58.6%
Others 41.4%

The brightening/whitening function segment is projected to contribute 58.6% of the global Whitening Gold Peptide Complex Market revenue in 2025, maintaining its lead as the dominant category. This leadership is driven by ongoing consumer demand for effective skin tone enhancement, reduction of hyperpigmentation, and a desire for radiant complexions across both Asia and Western markets. Brightening formulations leveraging gold-peptide conjugates are highly valued for their dual action of whitening and anti-aging, ensuring strong consumer loyalty.

The segment’s growth is also supported by innovations such as peptide + niacinamide hybrids that deliver both whitening and skin barrier repair. As dermatologist-tested and clean-label claims gain traction, brightening complexes are being reformulated to meet higher consumer standards of safety and efficacy. With rising adoption in e-commerce and luxury retail channels, the brightening/whitening segment is expected to remain the backbone of global demand in this market.
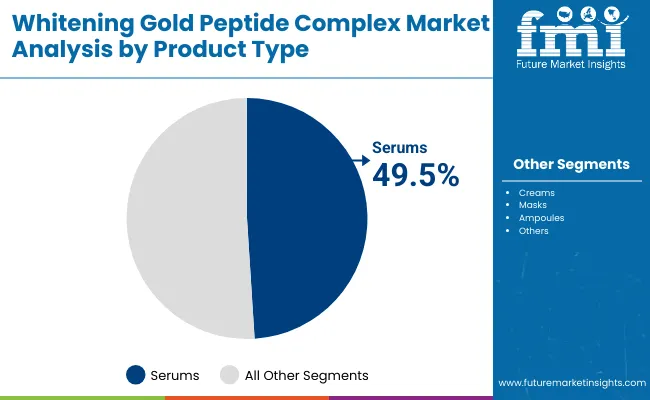
Insights into the Product Type Segment with Serums Dominating the Demand

Whitening Gold Peptide Complex Market By Product Type

Product Type Value Share% 2025
Serums 49.5%
Others 50.5%

The serums segment is forecasted to hold 49.5% of the market share in 2025, driven by its ability to deliver concentrated doses of gold-peptide complexes with superior absorption. Serums are favored for their lightweight formulations, fast action, and compatibility with multi-step skincare routines, making them the preferred choice in luxury beauty regimens. Their ability to integrate encapsulated gold systems has further enhanced efficacy, particularly in Asian beauty markets.

Their compact packaging, premium perception, and ease of layering within routines have fueled widespread adoption, especially among millennials and Gen Z consumers. The segment’s growth is bolstered by the increasing demand for high-performance skincare formats that deliver visible results quickly. As whitening gold peptide complexes expand into ampoules and hybrid delivery systems, serums are expected to continue dominating due to their role as the foundation of premium skincare routines worldwide.
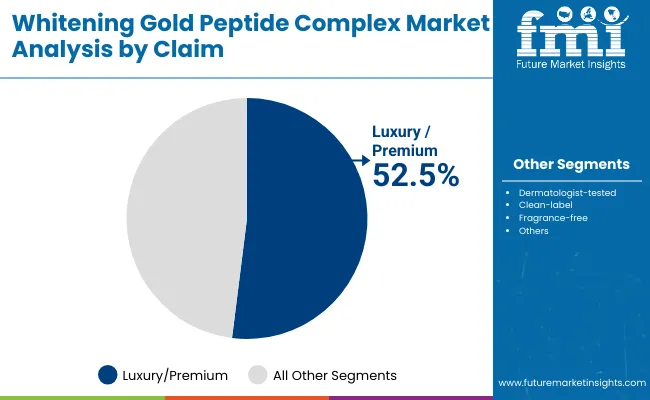
Insights into the Claim Segment with Luxury/Premium Leading in Market Share

Whitening Gold Peptide Complex Market By Claim

Claim Value Share% 2025
Luxury/premium 52.5%
Others 47.5%

The luxury/premium claim segment is projected to account for 52.5% of the global Whitening Gold Peptide Complex Market revenue in 2025, securing its position as the leading claim type. This dominance reflects the deep consumer association between gold-infused skincare and prestige, indulgence, and exclusivity. Products under this claim are preferred in high-end beauty retail and e-commerce channels, where gold-peptide branding aligns with aspirational lifestyles and skincare rituals.

Its suitability for serums, creams, and masks has ensured broad applicability across product formats, particularly in East Asia where K-beauty and J-beauty trends emphasize luxury ingredients. Advancements in encapsulation and 24K gold formulations have reinforced this premium positioning. Given its combination of performance, luxury perception, and consumer willingness to pay premium prices, the luxury/premium claim segment is expected to maintain its leading role in shaping brand strategies throughout the forecast period.

What are the Drivers, Restraints, and Key Trends of the Global Whitening Gold Peptide Complex Market?

Market Drivers

Rising Demand for Brightening/Whitening Functions in Asia (58.6% Share in 2025)

The brightening/whitening segment, with a 58.6% share in 2025 (USD 673.7 Mn), remains the strongest driver of this market. Asian consumers, particularly in China, Japan, and India, exhibit heightened demand for skin-lightening, hyperpigmentation reduction, and radiant skin tone products. This cultural emphasis on complexion refinement has created a robust pipeline of luxury skincare launches, with peptide-gold conjugates offering dual whitening and anti-aging benefits. The industry is responding by launching targeted serums and ampoules with encapsulated gold complexes to deliver visible results. As Asian beauty standards continue to influence Western skincare rituals, brightening/whitening products will secure the segment’s dominance and fuel growth globally.

Luxury and Premium Positioning Strengthening Retail Expansion (52.5% Share in 2025)

The luxury/premium claim segment accounts for 52.5% of global revenues in 2025 (USD 604.4 Mn), establishing itself as a growth engine. Consumers associate gold-infused peptides with prestige, exclusivity, and self-care indulgence. This has fueled a surge in premium beauty retail formats and e-commerce adoption, especially in urban centers of the USA, Europe, and Asia-Pacific. Luxury beauty houses such as Guerlain and SK-II are leveraging this demand to expand across multi-channel distribution. The ongoing focus on luxury positioning not only drives higher margins but also sustains brand equity, making premium claims one of the most critical drivers in this market.

Market Restraints

High Price Sensitivity and Limited Accessibility in Emerging Markets

Despite rapid growth in India (21.8% CAGR) and China (18.3% CAGR), accessibility remains a barrier. Whitening gold peptide products are priced as premium or luxury solutions, which restricts penetration among middle-income consumers in developing economies. While luxury positioning drives margins, it simultaneously creates price barriers in emerging markets where demand for affordable brightening products is high. Brands are experimenting with smaller pack sizes and e-commerce-driven discounts to expand accessibility. However, unless pricing models adapt, market growth may remain concentrated in high-income segments, limiting the industry’s full-scale expansion potential.

Growing Regulatory Scrutiny Around Whitening Claims

Governments in regions like the USA and Europe are increasingly scrutinizing skincare products that make explicit “whitening” or “lightening” claims due to cultural sensitivity and consumer protection. Regulatory frameworks are pushing brands to adopt alternative terminology such as “radiance” or “glow” instead of whitening, creating compliance costs for reformulation and rebranding. Companies investing heavily in whitening claims risk reputational challenges if regulations tighten further. As a result, firms are diversifying toward multi-functional positioning (firming + glow + anti-aging) to mitigate risks. This restraint underscores the delicate balance between market demand and ethical/regulatory compliance.

Key Trends

Encapsulated Gold Systems Gaining Traction in Premium Skincare

Encapsulated delivery systems are emerging as a defining trend in the global Whitening Gold Peptide Complex Market. Unlike traditional formulations, these systems protect active ingredients such as peptides and niacinamide, ensuring deeper skin penetration and prolonged stability. This innovation is particularly aligned with consumer preference for clean-label and dermatologist-tested formulations. As encapsulated complexes can combine whitening with hydration and firming, they are reshaping product launches in serums and ampoules. By 2030, encapsulated systems are expected to transition from niche offerings into mainstream luxury lines, reinforcing their role as a long-term growth trend.

Surge of E-commerce and Social Commerce Driving Consumer Reach

E-commerce, combined with social commerce platforms like TikTok and Instagram Shops, is transforming the way whitening gold peptide complexes reach consumers. Digital-first distribution offers brands direct-to-consumer channels to showcase premium claims, run influencer campaigns, and highlight before-and-after transformations. In markets like the USA (USD 232.2 Mn in 2025) and China (USD 123.9 Mn in 2025), e-commerce accounts for a rising share of retail sales, particularly among younger consumers. This trend is not only enhancing accessibility but also enabling micro-personalization and subscription-based sales, turning e-commerce into a dominant growth catalyst for the decade ahead.
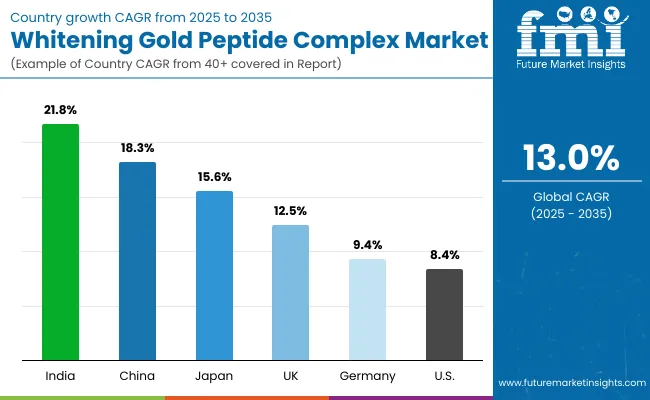
Analysis of Global Whitening Gold Peptide Complex Market By Key Countries

Country Wise Whitening Gold Peptide Complex Market

Countries Estimated CAGR (2025 to 2035)
China 18.3%
USA 8.4%
India 21.8%
UK 12.5%
Germany 9.4%
Japan 15.6%

Among the leading markets, India (21.8% CAGR) and China (18.3% CAGR) are projected to record the fastest growth, underscoring Asia’s dominance in driving whitening gold peptide complex demand. The cultural preference for brightening and even-toned skin, combined with a rapidly expanding middle-class consumer base, is fueling adoption in these regions. In India, growth is further amplified by the surge of e-commerce channels and the increasing popularity of luxury K-beauty and J-beauty inspired products. China, with its strong luxury retail ecosystem and government support for domestic beauty manufacturing, continues to attract global skincare brands. Together, these markets are expected to account for a substantial portion of global incremental revenues, making Asia-Pacific the powerhouse of expansion.

Mature markets such as the USA (8.4% CAGR), Germany (9.4% CAGR), and the UK (12.5% CAGR) are projected to grow steadily, driven by premium and dermatologist-tested claims. Consumers in these regions show strong interest in anti-aging, fragrance-free, and clean-label formulations, allowing gold-peptide complexes to position as luxury science-backed solutions rather than purely whitening products. Japan (15.6% CAGR) stands out as a balanced market where innovation in encapsulated gold systems and ampoule-based skincare is accelerating adoption. Overall, the global growth pattern highlights a clear divide between high-volume demand in Asia and premium-driven steady growth in Western markets, with Japan serving as a bridge between both trends.
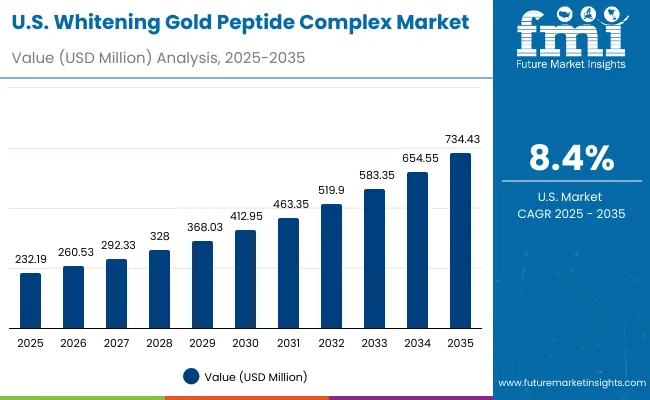
Sales Outlook for Whitening Gold Peptide Complex in the United States

Usa Whitening Gold Peptide Complex Market

Year USA Whitening Gold Peptide Complex Market (USD Million)
2025 232.19
2026 260.53
2027 292.33
2028 328.00
2029 368.03
2030 412.95
2031 463.35
2032 519.90
2033 583.35
2034 654.55
2035 734.43

The USA Whitening Gold Peptide Complex Market is projected to grow at a CAGR of 8.4%, with brightening/whitening products contributing nearly 59.9% of total revenues in 2025 (USD 139.0 Mn). Growth is led by rising consumer adoption of dermatologist-tested and fragrance-free formulations that emphasize safety alongside luxury. Premium beauty retailers and e-commerce channels are expanding their portfolios with serums and creams featuring encapsulated gold systems. Increasing demand among urban millennial and Gen Z consumers, combined with brand positioning in clean-label luxury, is boosting market penetration. Regulatory scrutiny around whitening claims is shaping repositioning strategies toward “radiance” and “glow,” further diversifying product lines.

  • Brightening/whitening serums dominate demand with nearly 60% share.
  • Dermatologist-tested, fragrance-free claims are accelerating trust-driven purchases.
  • E-commerce and premium retail channels are expanding product accessibility.

Growth and Expansion Outlook for Whitening Gold Peptide Complex in the United Kingdom

The UK Whitening Gold Peptide Complex Market is expected to grow at a CAGR of 12.5%, supported by demand for premium whitening, glow-enhancing, and anti-aging solutions. The country’s luxury skincare sector is highly receptive to gold-peptide conjugates due to their prestige positioning and dermatologist-backed efficacy. High-end beauty retailers and department stores are key sales channels, with luxury serums and creams forming the backbone of consumption. Cultural sensitivity around whitening claims has prompted a shift toward branding centered on radiance, glow, and firming, which has resonated strongly with consumers. E-commerce-led campaigns, influencer partnerships, and clean-label certifications are further stimulating growth.

  • Luxury retail chains are anchoring gold-peptide adoption in premium skincare.
  • Glow and radiance-focused branding is replacing direct whitening claims.
  • Social commerce and clean-label positioning are driving next-stage adoption.

Growth and Expansion Outlook for Whitening Gold Peptide Complex in India

India is witnessing the fastest growth globally, with the market forecast to expand at a CAGR of 21.8% through 2035. This surge is driven by a rising middle-class population, increased beauty awareness, and deepening penetration of e-commerce platforms. Demand is concentrated in brightening/whitening complexes, but there is a growing shift toward multi-functional claims such as spot reduction and glow enhancement. Premium beauty retailers and pharmacies are expanding gold-peptide based serums and masks in tier-1 cities, while online platforms are making them accessible to tier-2 cities. With India’s youth increasingly embracing K-beauty and J-beauty inspired routines, gold peptide serums are becoming a central part of aspirational skincare.

  • Expansion in tier-2 cities is fueled by e-commerce-driven accessibility.
  • Brightening/whitening serums dominate demand, supported by spot-reduction claims.
  • K-beauty and J-beauty routines are shaping gold-peptide adoption in urban India.

Sales Outlook for Whitening Gold Peptide Complex in China

The China Whitening Gold Peptide Complex Market is expected to grow at a CAGR of 18.3%, one of the highest among leading economies. Luxury/premium claims dominate, contributing 54.3% share in 2025 (USD 67.3 Mn), reflecting strong consumer preference for prestige skincare brands. Growth is being driven by China’s luxury retail ecosystem, digital-first adoption, and the role of local beauty tech firms introducing encapsulated gold and peptide-niacinamide hybrids. Municipal urbanization and digital beauty ecosystems, including social commerce platforms like Tmall and Douyin, are amplifying adoption. Affordable product variants alongside ultra-luxury creams and masks are expanding consumer reach, making China the largest incremental contributor to global revenues by 2035.
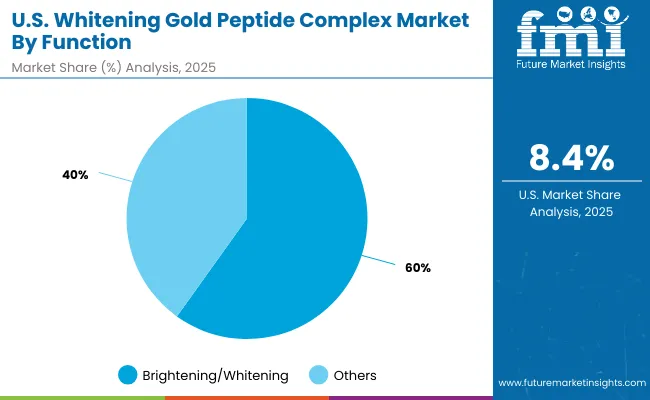
  • Luxury/premium claims dominate with over 54% market share.
  • E-commerce and social commerce platforms drive accessibility and consumer trust.
  • Encapsulated gold systems and peptide-niacinamide hybrids are reshaping product launches.

Opportunity Analysis of the USA Whitening Gold Peptide Complex Market

Usa Whitening Gold Peptide Complex Market By Function

USA by Function Value Share% 2025
Brightening/whitening 59.9%
Others 40.1%

The USA Whitening Gold Peptide Complex Market is valued at USD 232.2 million in 2025, with the brightening/whitening segment leading at 59.9% (USD 139.0 Mn). The dominance of this segment reflects American consumers’ preference for solutions targeting hyperpigmentation, dark spots, and uneven skin tone, particularly among urban populations exposed to lifestyle-related skin challenges. High interest in dermatologist-tested and fragrance-free claims has reinforced this demand, as consumers increasingly seek clinical safety and transparency in premium skincare.

This advantage positions brightening/whitening formulations as the core driver of the USA market, supported by retail expansion in premium department stores and robust growth across e-commerce. Secondary functions, such as radiance/glow and firming, are gaining traction but remain smaller in comparison. As brand strategies pivot toward multi-functional claims and regulatory-friendly messaging, the USA opportunity will expand through hybrid luxury formats that combine efficacy with clinical credibility.
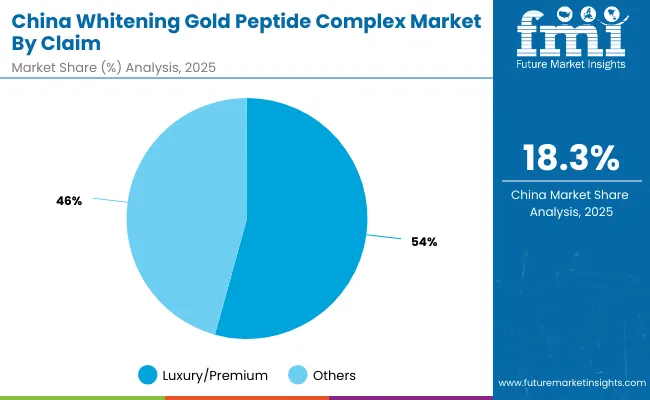
  • Market size for the USA in 2025: USD 232.2 million
  • Global market share: 20.1%
  • Brightening/whitening leads at 59.9% due to demand for hyperpigmentation and spot-correction solutions

Opportunity Analysis of the China Whitening Gold Peptide Complex Market

China Whitening Gold Peptide Complex Market By Claim

China by Claim Value Share% 2025
Luxury/premium 54.3%
Others 45.7%

The China Whitening Gold Peptide Complex Market is valued at USD 123.9 million in 2025, with luxury/premium claims leading at 54.3% (USD 67.3 Mn). The dominance of premium positioning reflects Chinese consumers’ deep association between gold-peptide complexes and prestige skincare, with aspirational lifestyles shaping demand. Strong cultural emphasis on fairer, luminous skin and the influence of K-beauty and J-beauty trends are further accelerating adoption.

This advantage positions luxury/premium claims as the central pillar of China’s opportunity, supported by e-commerce ecosystems like Tmall and Douyin that amplify direct-to-consumer engagement. Affordable gold-peptide variants are gradually expanding access in tier-2 and tier-3 cities, but luxury creams, serums, and masks dominate early growth. By 2035, China’s fast CAGR of 18.3% will make it one of the top contributors to global market expansion, securing a larger share of global revenues than today.
  • Market size for China in 2025: USD 123.9 million
  • Global market share: 10.7%
  • Luxury/premium leads at 54.3% due to prestige-driven demand and strong e-commerce penetration

Competitive Landscape of the Global Whitening Gold Peptide Complex Market

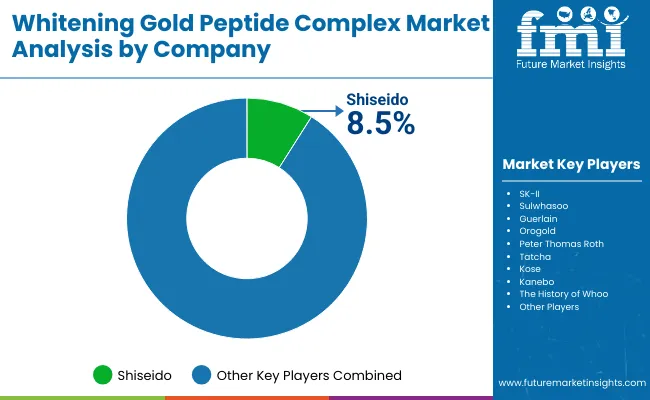
Whitening Gold Peptide Complex Market By Company

Company Global Value Share 2025
Shiseido 8.5%
Others 91.5%

The global Whitening Gold Peptide Complex Market is moderately fragmented, with luxury skincare giants, Asian beauty powerhouses, and niche-focused brands competing across diverse product categories. Shiseido, with an 8.5% global value share in 2025, leads through strong R&D, premium positioning, and Asia-focused retail dominance. Its innovations in peptide-gold conjugates and brightening complexes reinforce its leadership in Japan, China, and global luxury channels.

Other leading players, including SK-II, Sulwhasoo, Guerlain, and The History of Whoo, are consolidating their competitive edge through luxury/premium claims, clean-label certifications, and innovative formats such as serums and ampoules. These brands leverage regional strengths particularly in Asia-Pacific to expand into the USA and European markets. Mid-sized innovators like Orogold, Peter Thomas Roth, Tatcha, Kose, and Kanebo cater to niche demands, focusing on fragrance-free or dermatologist-tested lines, which resonate with Western consumers seeking safety-oriented premium products.Competitive differentiation is shifting away from single-function whitening creams toward integrated luxury ecosystems that combine encapsulated delivery systems, multi-functional claims, and digital-first retail strategies. The winners in this space are increasingly those that balance heritage-driven luxury branding with scientific credibility and digital accessibility, creating scalable global growth opportunities.

Key Developments in Global Whitening Gold Peptide Complex Market

  • On March 1, 2025, Shiseido launched the new Ultimune Power Infusion Serum in travel retail across Japan, Asia-Pacific, and European markets. The reformulation claims to be the “world’s first Memory T-cell anti-ageing serum,” with a new formula using fermented camellia extract (from camellia flowers on Gotoh Island) to help slow skin ageing, boosting skin regeneration, fortifying the skin barrier, and enhancing resistance to visible signs of ageing.
  • On March 10, 2025, Shiseido officially announced that its reformulated Ultimune Power Infusing Serum promises to slow down the skin’s aging process by 50%, attributing this to a patented fermentation process (ki-koji fermentation of camellia seeds) that enhances amino acid content, strengthens skin defence mechanisms, and improves cellular-level regeneration.

Scope of the Report

Item Value
Quantitative Units USD 1,152.6 million
Complex Type Gold-peptide conjugates, Peptide + Niacinamide complexes, Encapsulated gold systems, 24K gold masks/creams
Function Brightening/Whitening, Dark Spot Reduction, Radiance/“Glow”, Firming
Product Type Serums, Creams, Masks, Ampoules
Distribution Channel Asia Beauty Retail, E-commerce, Pharmacies, Premium Beauty Retail
Claims Luxury/Premium, Dermatologist-tested, Clean-label, Fragrance-free
Regions Covered North America, Europe, Asia-Pacific, Latin America, Middle East & Africa
Country Covered United States, Canada, Germany, France, United Kingdom, China, Japan, India, Brazil, South Africa
Key Companies Profiled Shiseido, SK-II, Sulwhasoo, Guerlain, Orogold, Peter Thomas Roth, Tatcha, Kose, Kanebo, The History of Whoo
Additional Attributes Dollar sales by function and product type, adoption trends in brightening/whitening skincare, rising demand for luxury serums and ampoules, segmental growth across e-commerce and premium beauty retail, claim-based revenue segmentation, integration of encapsulated gold with peptides and niacinamide, regional trends driven by Asia-Pacific luxury skincare demand, and innovations in clean-label and dermatologist-tested formulations. .

Key Segments

By Complex Type:

  • Gold-peptide conjugates
  • Peptide + niacinamide complexes
  • Encapsulated gold systems
  • 24K gold masks/creams

By Function:

  • Brightening/whitening
  • Dark spot reduction
  • Radiance/glow
  • Firming

By Product Type:

  • Serums
  • Creams
  • Masks
  • Ampoules

By Channel:

  • Asia beauty retail
  • E-commerce
  • Pharmacies
  • Premium beauty retail

By Claim:

  • Luxury/premium
  • Dermatologist-tested
  • Clean-label
  • Fragrance-free

By Region:

  • North America
  • Latin America
  • Europe
  • East Asia
  • South Asia & Pacific
  • Middle East and Africa

Table of Content

  1. Executive Summary
    • Global Market Outlook
    • Demand-side Trends
    • Supply-side Trends
    • Technology Roadmap Analysis
    • Analysis and Recommendations
  2. Market Overview
    • Market Coverage / Taxonomy
    • Market Definition / Scope / Limitations
  3. Market Background
    • Market Dynamics
      • Drivers
      • Restraints
      • Opportunity
      • Trends
    • Scenario Forecast
      • Demand in Optimistic Scenario
      • Demand in Likely Scenario
      • Demand in Conservative Scenario
    • Opportunity Map Analysis
    • Product Life Cycle Analysis
    • Supply Chain Analysis
    • Investment Feasibility Matrix
    • Value Chain Analysis
    • PESTLE and Porter’s Analysis
    • Regulatory Landscape
    • Regional Parent Market Outlook
    • Production and Consumption Statistics
    • Import and Export Statistics
  4. Global Analysis 2020 to 2024 and Forecast, 2025 to 2035
    • Historical Market Size Value (USD Million) & Volume(Units) Analysis, 2020 to 2024
    • Current and Future Market Size Value (USD Million) & Volume(Units) Projections, 2025 to 2035
      • Y-o-Y Growth Trend Analysis
      • Absolute $ Opportunity Analysis
  5. Global Pricing Analysis 2020 to 2024 and Forecast 2025 to 2035
  6. Global Analysis 2020 to 2024 and Forecast 2025 to 2035, By Complex Type
    • Introduction / Key Findings
    • Historical Market Size Value (USD Million) & Volume(Units) Analysis By Complex Type, 2020 to 2024
    • Current and Future Market Size Value (USD Million) & Volume(Units) Analysis and Forecast By Complex Type, 2025 to 2035
      • Gold–peptide conjugates
      • Peptide + niacinamide complexes
      • Encapsulated gold systems
      • 24K gold masks/creams
    • Y-o-Y Growth Trend Analysis By Complex Type, 2020 to 2024
    • Absolute $ Opportunity Analysis By Complex Type, 2025 to 2035
  7. Global Analysis 2020 to 2024 and Forecast 2025 to 2035, By Function
    • Introduction / Key Findings
    • Historical Market Size Value (USD Million) & Volume(Units) Analysis By Function, 2020 to 2024
    • Current and Future Market Size Value (USD Million) & Volume(Units) Analysis and Forecast By Function, 2025 to 2035
      • Brightening/whitening
      • Dark spot reduction
      • Radiance/glow
      • Firming
    • Y-o-Y Growth Trend Analysis By Function, 2020 to 2024
    • Absolute $ Opportunity Analysis By Function, 2025 to 2035
  8. Global Analysis 2020 to 2024 and Forecast 2025 to 2035, By Product Type
    • Introduction / Key Findings
    • Historical Market Size Value (USD Million) & Volume(Units) Analysis By Product Type, 2020 to 2024
    • Current and Future Market Size Value (USD Million) & Volume(Units) Analysis and Forecast By Product Type, 2025 to 2035
      • Serums
      • Creams
      • Masks
      • Ampoules
    • Y-o-Y Growth Trend Analysis By Product Type, 2020 to 2024
    • Absolute $ Opportunity Analysis By Product Type, 2025 to 2035
  9. Global Analysis 2020 to 2024 and Forecast 2025 to 2035, By Channel
    • Introduction / Key Findings
    • Historical Market Size Value (USD Million) & Volume(Units) Analysis By Channel, 2020 to 2024
    • Current and Future Market Size Value (USD Million) & Volume(Units) Analysis and Forecast By Channel, 2025 to 2035
      • Asia beauty retail
      • E-commerce
      • Pharmacies
      • Premium beauty retail
    • Y-o-Y Growth Trend Analysis By Channel, 2020 to 2024
    • Absolute $ Opportunity Analysis By Channel, 2025 to 2035
  10. Global Analysis 2020 to 2024 and Forecast 2025 to 2035, By Claim
    • Introduction / Key Findings
    • Historical Market Size Value (USD Million) & Volume(Units) Analysis By Claim, 2020 to 2024
    • Current and Future Market Size Value (USD Million) & Volume(Units) Analysis and Forecast By Claim, 2025 to 2035
      • Luxury/premium
      • Dermatologist-tested
      • Clean-label
      • Fragrance-free
    • Y-o-Y Growth Trend Analysis By Claim, 2020 to 2024
    • Absolute $ Opportunity Analysis By Claim, 2025 to 2035
  11. Global Analysis 2020 to 2024 and Forecast 2025 to 2035, By Region
    • Introduction
    • Historical Market Size Value (USD Million) & Volume(Units) Analysis By Region, 2020 to 2024
    • Current Market Size Value (USD Million) & Volume(Units) Analysis and Forecast By Region, 2025 to 2035
      • North America
      • Latin America
      • Europe
      • East Asia
      • South Asia & Pacific
      • Middle East and Africa
    • Market Attractiveness Analysis By Region
  12. North America Analysis 2020 to 2024 and Forecast 2025 to 2035, By Country
    • Historical Market Size Value (USD Million) & Volume(Units) Trend Analysis By Market Taxonomy, 2020 to 2024
    • Market Size Value (USD Million) & Volume(Units) Forecast By Market Taxonomy, 2025 to 2035
      • By Country
        • USA
        • Canada
      • By Complex Type
      • By Function
      • By Product Type
      • By Channel
      • By Claim
    • Market Attractiveness Analysis
      • By Country
      • By Complex Type
      • By Function
      • By Product Type
      • By Channel
      • By Claim
    • Key Takeaways
  13. Latin America Analysis 2020 to 2024 and Forecast 2025 to 2035, By Country
    • Historical Market Size Value (USD Million) & Volume(Units) Trend Analysis By Market Taxonomy, 2020 to 2024
    • Market Size Value (USD Million) & Volume(Units) Forecast By Market Taxonomy, 2025 to 2035
      • By Country
        • Brazil
        • Mexico
        • Colombia
        • Rest of Latin America
      • By Complex Type
      • By Function
      • By Product Type
      • By Channel
      • By Claim
    • Market Attractiveness Analysis
      • By Country
      • By Complex Type
      • By Function
      • By Product Type
      • By Channel
      • By Claim
    • Key Takeaways
  14. Europe Analysis 2020 to 2024 and Forecast 2025 to 2035, By Country
    • Historical Market Size Value (USD Million) & Volume(Units) Trend Analysis By Market Taxonomy, 2020 to 2024
    • Market Size Value (USD Million) & Volume(Units) Forecast By Market Taxonomy, 2025 to 2035
      • By Country
        • Germany
        • UK
        • France
        • Italy
        • Spain
        • Belgium
        • Netherlands
        • Nordic
        • Switzerland
        • Russia
        • Poland
        • Rest of Europe
      • By Complex Type
      • By Function
      • By Product Type
      • By Channel
      • By Claim
    • Market Attractiveness Analysis
      • By Country
      • By Complex Type
      • By Function
      • By Product Type
      • By Channel
      • By Claim
    • Key Takeaways
  15. East Asia Analysis 2020 to 2024 and Forecast 2025 to 2035, By Country
    • Historical Market Size Value (USD Million) & Volume(Units) Trend Analysis By Market Taxonomy, 2020 to 2024
    • Market Size Value (USD Million) & Volume(Units) Forecast By Market Taxonomy, 2025 to 2035
      • By Country
        • China
        • Japan
        • South Korea
      • By Complex Type
      • By Function
      • By Product Type
      • By Channel
      • By Claim
    • Market Attractiveness Analysis
      • By Country
      • By Complex Type
      • By Function
      • By Product Type
      • By Channel
      • By Claim
    • Key Takeaways
  16. South Asia & Pacific Analysis 2020 to 2024 and Forecast 2025 to 2035, By Country
    • Historical Market Size Value (USD Million) & Volume(Units) Trend Analysis By Market Taxonomy, 2020 to 2024
    • Market Size Value (USD Million) & Volume(Units) Forecast By Market Taxonomy, 2025 to 2035
      • By Country
        • India
        • Thailand
        • Malaysia
        • Indonesia
        • Singapore
        • Vietnam
        • Australia
        • New Zealand
        • Rest of South Asia
      • By Complex Type
      • By Function
      • By Product Type
      • By Channel
      • By Claim
    • Market Attractiveness Analysis
      • By Country
      • By Complex Type
      • By Function
      • By Product Type
      • By Channel
      • By Claim
    • Key Takeaways
  17. Middle East and Africa Analysis 2020 to 2024 and Forecast 2025 to 2035, By Country
    • Historical Market Size Value (USD Million) & Volume(Units) Trend Analysis By Market Taxonomy, 2020 to 2024
    • Market Size Value (USD Million) & Volume(Units) Forecast By Market Taxonomy, 2025 to 2035
      • By Country
        • Turkey
        • UAE
        • Saudi Arabia
        • Israel
        • Other GCC Countries
        • North Africa
        • South Africa
      • By Complex Type
      • By Function
      • By Product Type
      • By Channel
      • By Claim
    • Market Attractiveness Analysis
      • By Country
      • By Complex Type
      • By Function
      • By Product Type
      • By Channel
      • By Claim
    • Key Takeaways
  18. Key Countries Analysis
    • USA
      • Pricing Analysis
      • Market Share Analysis, 2024
        • By Complex Type
        • By Function
        • By Product Type
        • By Channel
        • By Claim
    • Canada
      • Pricing Analysis
      • Market Share Analysis, 2024
        • By Complex Type
        • By Function
        • By Product Type
        • By Channel
        • By Claim
    • Mexico
      • Pricing Analysis
      • Market Share Analysis, 2024
        • By Complex Type
        • By Function
        • By Product Type
        • By Channel
        • By Claim
    • Brazil
      • Pricing Analysis
      • Market Share Analysis, 2024
        • By Complex Type
        • By Function
        • By Product Type
        • By Channel
        • By Claim
    • Chile
      • Pricing Analysis
      • Market Share Analysis, 2024
        • By Complex Type
        • By Function
        • By Product Type
        • By Channel
        • By Claim
    • Germany
      • Pricing Analysis
      • Market Share Analysis, 2024
        • By Complex Type
        • By Function
        • By Product Type
        • By Channel
        • By Claim
    • UK
      • Pricing Analysis
      • Market Share Analysis, 2024
        • By Complex Type
        • By Function
        • By Product Type
        • By Channel
        • By Claim
    • Italy
      • Pricing Analysis
      • Market Share Analysis, 2024
        • By Complex Type
        • By Function
        • By Product Type
        • By Channel
        • By Claim
    • Spain
      • Pricing Analysis
      • Market Share Analysis, 2024
        • By Complex Type
        • By Function
        • By Product Type
        • By Channel
        • By Claim
    • France
      • Pricing Analysis
      • Market Share Analysis, 2024
        • By Complex Type
        • By Function
        • By Product Type
        • By Channel
        • By Claim
    • India
      • Pricing Analysis
      • Market Share Analysis, 2024
        • By Complex Type
        • By Function
        • By Product Type
        • By Channel
        • By Claim
    • ASEAN
      • Pricing Analysis
      • Market Share Analysis, 2024
        • By Complex Type
        • By Function
        • By Product Type
        • By Channel
        • By Claim
    • Australia & New Zealand
      • Pricing Analysis
      • Market Share Analysis, 2024
        • By Complex Type
        • By Function
        • By Product Type
        • By Channel
        • By Claim
    • China
      • Pricing Analysis
      • Market Share Analysis, 2024
        • By Complex Type
        • By Function
        • By Product Type
        • By Channel
        • By Claim
    • Japan
      • Pricing Analysis
      • Market Share Analysis, 2024
        • By Complex Type
        • By Function
        • By Product Type
        • By Channel
        • By Claim
    • South Korea
      • Pricing Analysis
      • Market Share Analysis, 2024
        • By Complex Type
        • By Function
        • By Product Type
        • By Channel
        • By Claim
    • Russia
      • Pricing Analysis
      • Market Share Analysis, 2024
        • By Complex Type
        • By Function
        • By Product Type
        • By Channel
        • By Claim
    • Poland
      • Pricing Analysis
      • Market Share Analysis, 2024
        • By Complex Type
        • By Function
        • By Product Type
        • By Channel
        • By Claim
    • Hungary
      • Pricing Analysis
      • Market Share Analysis, 2024
        • By Complex Type
        • By Function
        • By Product Type
        • By Channel
        • By Claim
    • Kingdom of Saudi Arabia
      • Pricing Analysis
      • Market Share Analysis, 2024
        • By Complex Type
        • By Function
        • By Product Type
        • By Channel
        • By Claim
    • Turkiye
      • Pricing Analysis
      • Market Share Analysis, 2024
        • By Complex Type
        • By Function
        • By Product Type
        • By Channel
        • By Claim
    • South Africa
      • Pricing Analysis
      • Market Share Analysis, 2024
        • By Complex Type
        • By Function
        • By Product Type
        • By Channel
        • By Claim
  19. Market Structure Analysis
    • Competition Dashboard
    • Competition Benchmarking
    • Market Share Analysis of Top Players
      • By Regional
      • By Complex Type
      • By Function
      • By Product Type
      • By Channel
      • By Claim
  20. Competition Analysis
    • Competition Deep Dive
      • Shiseido
        • Overview
        • Product Portfolio
        • Profitability by Market Segments (Product/Age /Sales Channel/Region)
        • Sales Footprint
        • Strategy Overview
        • SK-II
        • Sulwhasoo
        • Guerlain
        • Orogold
        • Peter Thomas Roth
        • Tatcha
        • Kose
        • Kanebo
        • The History of Whoo
    • Assumptions & Acronyms Used
    • Research Methodology

List of Tables

  • Table 1: Global Value (USD Million) Forecast by Region, 2020-2035
  • Table 2: Global Volume(Units) Forecast by Region, 2020-2035
  • Table 3: Global Value (USD Million) Forecast by Complex Type, 2020-2035
  • Table 4: Global Volume(Units) Forecast by Complex Type, 2020-2035
  • Table 5: Global Value (USD Million) Forecast by Function, 2020-2035
  • Table 6: Global Volume(Units) Forecast by Function, 2020-2035
  • Table 7: Global Value (USD Million) Forecast by Product Type, 2020-2035
  • Table 8: Global Volume(Units) Forecast by Product Type, 2020-2035
  • Table 9: Global Value (USD Million) Forecast by Channel, 2020-2035
  • Table 10: Global Volume(Units) Forecast by Channel, 2020-2035
  • Table 11: Global Value (USD Million) Forecast by Claim, 2020-2035
  • Table 12: Global Volume(Units) Forecast by Claim, 2020-2035
  • Table 13: North America Value (USD Million) Forecast by Country, 2020-2035
  • Table 14: North America Volume(Units) Forecast by Country, 2020-2035
  • Table 15: North America Value (USD Million) Forecast by Complex Type, 2020-2035
  • Table 16: North America Volume(Units) Forecast by Complex Type, 2020-2035
  • Table 17: North America Value (USD Million) Forecast by Function, 2020-2035
  • Table 18: North America Volume(Units) Forecast by Function, 2020-2035
  • Table 19: North America Value (USD Million) Forecast by Product Type, 2020-2035
  • Table 20: North America Volume(Units) Forecast by Product Type, 2020-2035
  • Table 21: North America Value (USD Million) Forecast by Channel, 2020-2035
  • Table 22: North America Volume(Units) Forecast by Channel, 2020-2035
  • Table 23: North America Value (USD Million) Forecast by Claim, 2020-2035
  • Table 24: North America Volume(Units) Forecast by Claim, 2020-2035
  • Table 25: Latin America Value (USD Million) Forecast by Country, 2020-2035
  • Table 26: Latin America Volume(Units) Forecast by Country, 2020-2035
  • Table 27: Latin America Value (USD Million) Forecast by Complex Type, 2020-2035
  • Table 28: Latin America Volume(Units) Forecast by Complex Type, 2020-2035
  • Table 29: Latin America Value (USD Million) Forecast by Function, 2020-2035
  • Table 30: Latin America Volume(Units) Forecast by Function, 2020-2035
  • Table 31: Latin America Value (USD Million) Forecast by Product Type, 2020-2035
  • Table 32: Latin America Volume(Units) Forecast by Product Type, 2020-2035
  • Table 33: Latin America Value (USD Million) Forecast by Channel, 2020-2035
  • Table 34: Latin America Volume(Units) Forecast by Channel, 2020-2035
  • Table 35: Latin America Value (USD Million) Forecast by Claim, 2020-2035
  • Table 36: Latin America Volume(Units) Forecast by Claim, 2020-2035
  • Table 37: Europe Value (USD Million) Forecast by Country, 2020-2035
  • Table 38: Europe Volume(Units) Forecast by Country, 2020-2035
  • Table 39: Europe Value (USD Million) Forecast by Complex Type, 2020-2035
  • Table 40: Europe Volume(Units) Forecast by Complex Type, 2020-2035
  • Table 41: Europe Value (USD Million) Forecast by Function, 2020-2035
  • Table 42: Europe Volume(Units) Forecast by Function, 2020-2035
  • Table 43: Europe Value (USD Million) Forecast by Product Type, 2020-2035
  • Table 44: Europe Volume(Units) Forecast by Product Type, 2020-2035
  • Table 45: Europe Value (USD Million) Forecast by Channel, 2020-2035
  • Table 46: Europe Volume(Units) Forecast by Channel, 2020-2035
  • Table 47: Europe Value (USD Million) Forecast by Claim, 2020-2035
  • Table 48: Europe Volume(Units) Forecast by Claim, 2020-2035
  • Table 49: East Asia Value (USD Million) Forecast by Country, 2020-2035
  • Table 50: East Asia Volume(Units) Forecast by Country, 2020-2035
  • Table 51: East Asia Value (USD Million) Forecast by Complex Type, 2020-2035
  • Table 52: East Asia Volume(Units) Forecast by Complex Type, 2020-2035
  • Table 53: East Asia Value (USD Million) Forecast by Function, 2020-2035
  • Table 54: East Asia Volume(Units) Forecast by Function, 2020-2035
  • Table 55: East Asia Value (USD Million) Forecast by Product Type, 2020-2035
  • Table 56: East Asia Volume(Units) Forecast by Product Type, 2020-2035
  • Table 57: East Asia Value (USD Million) Forecast by Channel, 2020-2035
  • Table 58: East Asia Volume(Units) Forecast by Channel, 2020-2035
  • Table 59: East Asia Value (USD Million) Forecast by Claim, 2020-2035
  • Table 60: East Asia Volume(Units) Forecast by Claim, 2020-2035
  • Table 61: South Asia & Pacific Value (USD Million) Forecast by Country, 2020-2035
  • Table 62: South Asia & Pacific Volume(Units) Forecast by Country, 2020-2035
  • Table 63: South Asia & Pacific Value (USD Million) Forecast by Complex Type, 2020-2035
  • Table 64: South Asia & Pacific Volume(Units) Forecast by Complex Type, 2020-2035
  • Table 65: South Asia & Pacific Value (USD Million) Forecast by Function, 2020-2035
  • Table 66: South Asia & Pacific Volume(Units) Forecast by Function, 2020-2035
  • Table 67: South Asia & Pacific Value (USD Million) Forecast by Product Type, 2020-2035
  • Table 68: South Asia & Pacific Volume(Units) Forecast by Product Type, 2020-2035
  • Table 69: South Asia & Pacific Value (USD Million) Forecast by Channel, 2020-2035
  • Table 70: South Asia & Pacific Volume(Units) Forecast by Channel, 2020-2035
  • Table 71: South Asia & Pacific Value (USD Million) Forecast by Claim, 2020-2035
  • Table 72: South Asia & Pacific Volume(Units) Forecast by Claim, 2020-2035
  • Table 73: Middle East and Africa Value (USD Million) Forecast by Country, 2020-2035
  • Table 74: Middle East and Africa Volume(Units) Forecast by Country, 2020-2035
  • Table 75: Middle East and Africa Value (USD Million) Forecast by Complex Type, 2020-2035
  • Table 76: Middle East and Africa Volume(Units) Forecast by Complex Type, 2020-2035
  • Table 77: Middle East and Africa Value (USD Million) Forecast by Function, 2020-2035
  • Table 78: Middle East and Africa Volume(Units) Forecast by Function, 2020-2035
  • Table 79: Middle East and Africa Value (USD Million) Forecast by Product Type, 2020-2035
  • Table 80: Middle East and Africa Volume(Units) Forecast by Product Type, 2020-2035
  • Table 81: Middle East and Africa Value (USD Million) Forecast by Channel, 2020-2035
  • Table 82: Middle East and Africa Volume(Units) Forecast by Channel, 2020-2035
  • Table 83: Middle East and Africa Value (USD Million) Forecast by Claim, 2020-2035
  • Table 84: Middle East and Africa Volume(Units) Forecast by Claim, 2020-2035

List of Figures

  • Figure 1: Global Volume(Units) Forecast 2020-2035
  • Figure 2: Global Pricing Analysis
  • Figure 3: Global Value (USD Million) Forecast 2020-2035
  • Figure 4: Global Value Share and BPS Analysis by Complex Type, 2025 and 2035
  • Figure 5: Global Y-o-Y Growth Comparison by Complex Type, 2025-2035
  • Figure 6: Global Attractiveness Analysis by Complex Type
  • Figure 7: Global Value Share and BPS Analysis by Function, 2025 and 2035
  • Figure 8: Global Y-o-Y Growth Comparison by Function, 2025-2035
  • Figure 9: Global Attractiveness Analysis by Function
  • Figure 10: Global Value Share and BPS Analysis by Product Type, 2025 and 2035
  • Figure 11: Global Y-o-Y Growth Comparison by Product Type, 2025-2035
  • Figure 12: Global Attractiveness Analysis by Product Type
  • Figure 13: Global Value Share and BPS Analysis by Channel, 2025 and 2035
  • Figure 14: Global Y-o-Y Growth Comparison by Channel, 2025-2035
  • Figure 15: Global Attractiveness Analysis by Channel
  • Figure 16: Global Value Share and BPS Analysis by Claim, 2025 and 2035
  • Figure 17: Global Y-o-Y Growth Comparison by Claim, 2025-2035
  • Figure 18: Global Attractiveness Analysis by Claim
  • Figure 19: Global Value (USD Million) Share and BPS Analysis by Region, 2025 and 2035
  • Figure 20: Global Y-o-Y Growth Comparison by Region, 2025-2035
  • Figure 21: Global Attractiveness Analysis by Region
  • Figure 22: North America Incremental $ Opportunity, 2025-2035
  • Figure 23: Latin America Incremental $ Opportunity, 2025-2035
  • Figure 24: Europe Incremental $ Opportunity, 2025-2035
  • Figure 25: East Asia Incremental $ Opportunity, 2025-2035
  • Figure 26: South Asia & Pacific Incremental $ Opportunity, 2025-2035
  • Figure 27: Middle East and Africa Incremental $ Opportunity, 2025-2035
  • Figure 28: North America Value Share and BPS Analysis by Country, 2025 and 2035
  • Figure 29: North America Value Share and BPS Analysis by Complex Type, 2025 and 2035
  • Figure 30: North America Y-o-Y Growth Comparison by Complex Type, 2025-2035
  • Figure 31: North America Attractiveness Analysis by Complex Type
  • Figure 32: North America Value Share and BPS Analysis by Function, 2025 and 2035
  • Figure 33: North America Y-o-Y Growth Comparison by Function, 2025-2035
  • Figure 34: North America Attractiveness Analysis by Function
  • Figure 35: North America Value Share and BPS Analysis by Product Type, 2025 and 2035
  • Figure 36: North America Y-o-Y Growth Comparison by Product Type, 2025-2035
  • Figure 37: North America Attractiveness Analysis by Product Type
  • Figure 38: North America Value Share and BPS Analysis by Channel, 2025 and 2035
  • Figure 39: North America Y-o-Y Growth Comparison by Channel, 2025-2035
  • Figure 40: North America Attractiveness Analysis by Channel
  • Figure 41: North America Value Share and BPS Analysis by Claim, 2025 and 2035
  • Figure 42: North America Y-o-Y Growth Comparison by Claim, 2025-2035
  • Figure 43: North America Attractiveness Analysis by Claim
  • Figure 44: Latin America Value Share and BPS Analysis by Country, 2025 and 2035
  • Figure 45: Latin America Value Share and BPS Analysis by Complex Type, 2025 and 2035
  • Figure 46: Latin America Y-o-Y Growth Comparison by Complex Type, 2025-2035
  • Figure 47: Latin America Attractiveness Analysis by Complex Type
  • Figure 48: Latin America Value Share and BPS Analysis by Function, 2025 and 2035
  • Figure 49: Latin America Y-o-Y Growth Comparison by Function, 2025-2035
  • Figure 50: Latin America Attractiveness Analysis by Function
  • Figure 51: Latin America Value Share and BPS Analysis by Product Type, 2025 and 2035
  • Figure 52: Latin America Y-o-Y Growth Comparison by Product Type, 2025-2035
  • Figure 53: Latin America Attractiveness Analysis by Product Type
  • Figure 54: Latin America Value Share and BPS Analysis by Channel, 2025 and 2035
  • Figure 55: Latin America Y-o-Y Growth Comparison by Channel, 2025-2035
  • Figure 56: Latin America Attractiveness Analysis by Channel
  • Figure 57: Latin America Value Share and BPS Analysis by Claim, 2025 and 2035
  • Figure 58: Latin America Y-o-Y Growth Comparison by Claim, 2025-2035
  • Figure 59: Latin America Attractiveness Analysis by Claim
  • Figure 60: Europe Value Share and BPS Analysis by Country, 2025 and 2035
  • Figure 61: Europe Value Share and BPS Analysis by Complex Type, 2025 and 2035
  • Figure 62: Europe Y-o-Y Growth Comparison by Complex Type, 2025-2035
  • Figure 63: Europe Attractiveness Analysis by Complex Type
  • Figure 64: Europe Value Share and BPS Analysis by Function, 2025 and 2035
  • Figure 65: Europe Y-o-Y Growth Comparison by Function, 2025-2035
  • Figure 66: Europe Attractiveness Analysis by Function
  • Figure 67: Europe Value Share and BPS Analysis by Product Type, 2025 and 2035
  • Figure 68: Europe Y-o-Y Growth Comparison by Product Type, 2025-2035
  • Figure 69: Europe Attractiveness Analysis by Product Type
  • Figure 70: Europe Value Share and BPS Analysis by Channel, 2025 and 2035
  • Figure 71: Europe Y-o-Y Growth Comparison by Channel, 2025-2035
  • Figure 72: Europe Attractiveness Analysis by Channel
  • Figure 73: Europe Value Share and BPS Analysis by Claim, 2025 and 2035
  • Figure 74: Europe Y-o-Y Growth Comparison by Claim, 2025-2035
  • Figure 75: Europe Attractiveness Analysis by Claim
  • Figure 76: East Asia Value Share and BPS Analysis by Country, 2025 and 2035
  • Figure 77: East Asia Value Share and BPS Analysis by Complex Type, 2025 and 2035
  • Figure 78: East Asia Y-o-Y Growth Comparison by Complex Type, 2025-2035
  • Figure 79: East Asia Attractiveness Analysis by Complex Type
  • Figure 80: East Asia Value Share and BPS Analysis by Function, 2025 and 2035
  • Figure 81: East Asia Y-o-Y Growth Comparison by Function, 2025-2035
  • Figure 82: East Asia Attractiveness Analysis by Function
  • Figure 83: East Asia Value Share and BPS Analysis by Product Type, 2025 and 2035
  • Figure 84: East Asia Y-o-Y Growth Comparison by Product Type, 2025-2035
  • Figure 85: East Asia Attractiveness Analysis by Product Type
  • Figure 86: East Asia Value Share and BPS Analysis by Channel, 2025 and 2035
  • Figure 87: East Asia Y-o-Y Growth Comparison by Channel, 2025-2035
  • Figure 88: East Asia Attractiveness Analysis by Channel
  • Figure 89: East Asia Value Share and BPS Analysis by Claim, 2025 and 2035
  • Figure 90: East Asia Y-o-Y Growth Comparison by Claim, 2025-2035
  • Figure 91: East Asia Attractiveness Analysis by Claim
  • Figure 92: South Asia & Pacific Value Share and BPS Analysis by Country, 2025 and 2035
  • Figure 93: South Asia & Pacific Value Share and BPS Analysis by Complex Type, 2025 and 2035
  • Figure 94: South Asia & Pacific Y-o-Y Growth Comparison by Complex Type, 2025-2035
  • Figure 95: South Asia & Pacific Attractiveness Analysis by Complex Type
  • Figure 96: South Asia & Pacific Value Share and BPS Analysis by Function, 2025 and 2035
  • Figure 97: South Asia & Pacific Y-o-Y Growth Comparison by Function, 2025-2035
  • Figure 98: South Asia & Pacific Attractiveness Analysis by Function
  • Figure 99: South Asia & Pacific Value Share and BPS Analysis by Product Type, 2025 and 2035
  • Figure 100: South Asia & Pacific Y-o-Y Growth Comparison by Product Type, 2025-2035
  • Figure 101: South Asia & Pacific Attractiveness Analysis by Product Type
  • Figure 102: South Asia & Pacific Value Share and BPS Analysis by Channel, 2025 and 2035
  • Figure 103: South Asia & Pacific Y-o-Y Growth Comparison by Channel, 2025-2035
  • Figure 104: South Asia & Pacific Attractiveness Analysis by Channel
  • Figure 105: South Asia & Pacific Value Share and BPS Analysis by Claim, 2025 and 2035
  • Figure 106: South Asia & Pacific Y-o-Y Growth Comparison by Claim, 2025-2035
  • Figure 107: South Asia & Pacific Attractiveness Analysis by Claim
  • Figure 108: Middle East and Africa Value Share and BPS Analysis by Country, 2025 and 2035
  • Figure 109: Middle East and Africa Value Share and BPS Analysis by Complex Type, 2025 and 2035
  • Figure 110: Middle East and Africa Y-o-Y Growth Comparison by Complex Type, 2025-2035
  • Figure 111: Middle East and Africa Attractiveness Analysis by Complex Type
  • Figure 112: Middle East and Africa Value Share and BPS Analysis by Function, 2025 and 2035
  • Figure 113: Middle East and Africa Y-o-Y Growth Comparison by Function, 2025-2035
  • Figure 114: Middle East and Africa Attractiveness Analysis by Function
  • Figure 115: Middle East and Africa Value Share and BPS Analysis by Product Type, 2025 and 2035
  • Figure 116: Middle East and Africa Y-o-Y Growth Comparison by Product Type, 2025-2035
  • Figure 117: Middle East and Africa Attractiveness Analysis by Product Type
  • Figure 118: Middle East and Africa Value Share and BPS Analysis by Channel, 2025 and 2035
  • Figure 119: Middle East and Africa Y-o-Y Growth Comparison by Channel, 2025-2035
  • Figure 120: Middle East and Africa Attractiveness Analysis by Channel
  • Figure 121: Middle East and Africa Value Share and BPS Analysis by Claim, 2025 and 2035
  • Figure 122: Middle East and Africa Y-o-Y Growth Comparison by Claim, 2025-2035
  • Figure 123: Middle East and Africa Attractiveness Analysis by Claim
  • Figure 124: Global - Tier Structure Analysis
  • Figure 125: Global - Company Share Analysis

Frequently Asked Questions

How big is the Global Whitening Gold Peptide Complex Market in 2025?

The global Whitening Gold Peptide Complex Market is estimated to be valued at USD 1,152.6 million in 2025.

What will be the size of the Global Whitening Gold Peptide Complex Market in 2035?

The market size is projected to reach USD 3,900.4 million by 2035.

How much will the market grow between 2025 and 2035?

The Whitening Gold Peptide Complex Market is expected to grow at a 13.0% CAGR between 2025 and 2035, more than tripling in size over the decade.

What are the key product types in the Whitening Gold Peptide Complex Market?

The key product types are Serums, Creams, Masks, and Ampoules.

Which function segment will contribute the most in 2025?

In terms of function, the Brightening/Whitening segment will command 58.6% share of the global market in 2025.

Explore Similar Insights

Future Market Insights

Whitening Gold Peptide Complex Market

Chat With

MaRIA

Hi There, I am MaRIA, Your Market Research Intelligence Assistant. How may I help you?