
- Market Size (2026)
- USD 132.4 Mn
- Forecast (2036)
- USD 239.4 Mn
- CAGR (2026 to 2036)
- 6.1%
How big is Goldenseal Market in 2026?
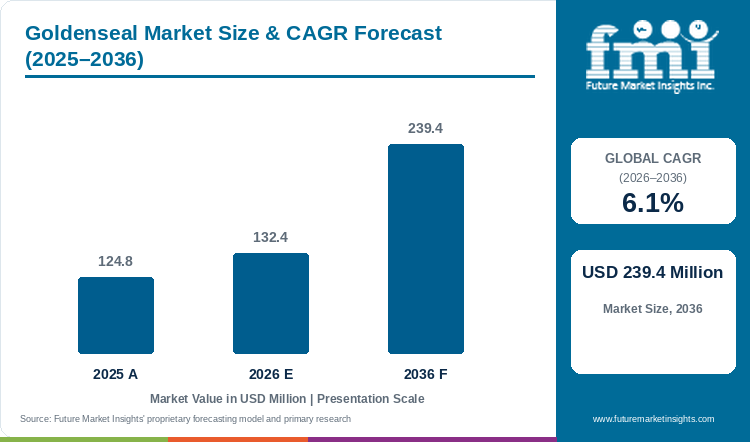
Starting from USD 124.8 million in 2025, the goldenseal market valuation advanced to USD 132.4 million in 2026 and is projected to hit USD 239.4 million by 2036, expanding at a 6.1% CAGR.
Mandatory Convention on International Trade in Endangered Species Appendix II export permits and dual-alkaloid pharmacopeial assay gates are forcing herbal extractors out of unverified wild-dug Appalachian roots into contracted shade-house cultivation [1]. Valued at USD 124.8 million in 2025, the global goldenseal market size reached USD 132.4 million in 2026 and is projected to attain USD 239.4 million by 2036 at a 6.1% CAGR. FMI industry evaluation shows that Standardized Rhizome and Root Powder 5% Hydrastine/Berberine captures 55.4% of 2026 extract format value because capsule and tablet brands require verified isoquinoline ratios to pass retail quality audits. That whole-rhizome botanical standardization distinguishes the sector from purified berberine alkaloid extracts expanding at an 8.7% CAGR, as isolated metabolic berberine draws cheap barberry bark feedstocks whereas authentic Hydrastis canadensis requires both hydrastine and berberine markers [5]. According to a February 2025 Ecology and Evolution harvest assessment, cultivated woodland plots already supply 78.3% of dry goldenseal root tonnage in the United States [1], while a May 2025 Journal of Pharmacology and Experimental Therapeutics study verified that commercial Solaray 550 mg goldenseal root capsules deliver 68.7 micromolar hydrastine and 59.3 micromolar berberine per test matrix [2]. New woodland acreage qualification across a five-year rhizome maturation cycle and cytochrome P450 2D6 and 3A4 drug-interaction labeling reviews govern supplier onboarding through 2036 [12].
Key Market Trends & Insights
- By extract format: Standardized Rhizome and Root Powder 5% Hydrastine/Berberine holds an estimated 55.4% share in 2026 because USP high-performance liquid chromatography assays prevent Coptis chinensis adulteration.
- By sourcing method: CITES-Compliant Cultivated Woodland Root represents 71.8% in 2026 as botanical brands transition away from imperiled wild Appalachian populations toward traceable four-to-five-year forest farms.
- By therapeutic application: Seasonal Immune and Echinacea-Goldenseal Combinations account for 51.2% in 2026 because dual-herb winter cold and upper-respiratory SKUs anchor retail pharmacy velocity.
- By patient demographic cohort: Adults 18 to 64 Years secure 53.8% in 2026 owing to working-age demand for short-course seasonal immunity and metabolic AMPK support.
- By distribution channel: Retail Pharmacies and Natural Health Stores command 46.5% in 2026 through practitioner-guided herbal aisles and third-party bottle verification programs.
Regional Highlights
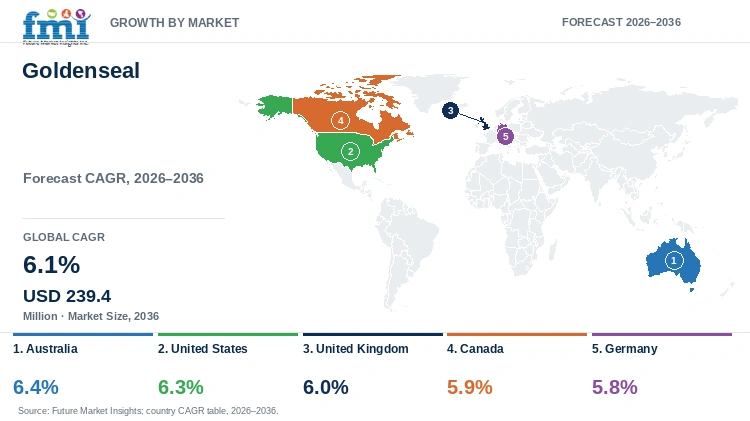
- Top national expansion: Australia paces country-level expansion at a 6.4% CAGR through 2036 via naturopathic practitioner dispensing and TGA listed-botanical quality controls.
- Broader country progression: The United States tracks at a 6.3% CAGR ahead of the United Kingdom at 6.0%, while Canada records 5.9% and Germany registers 5.8%.
Market Size & Forecast
Table 1: Market Size and Forecast for the Goldenseal Market (USD million and CAGR percentage), 2025 to 2036
| Metric | Value |
|---|---|
| 2025 Market Size | USD 124.8 million |
| Estimated Market Size in 2026 | USD 132.4 million |
| Projected Market Size by 2036 | USD 239.4 million |
| CAGR, 2026 to 2036 | 6.1% |
| Added Value, 2026 to 2036 | USD 107.0 million |
Botanical extractors and supplement encapsulators face wide raw-material cost spreads between wild-dug Appalachian rhizomes and cultivated woodland crops that take four to five years to reach peak alkaloid density. To protect processing margins against expensive dried root feedstock, commercial extraction plants are replacing slow Soxhlet boiling with ultrasonic-assisted percolation. A July 2025 review in RSC Advances demonstrated that ultrasonic extraction yields 100.0 mg/g of isoquinoline alkaloids compared with 40.0 mg/g under conventional solvent extraction while improving processing efficiency by 9.6% [22]. Procurement managers sourcing standardized botanical extracts enforce HPLC certificates confirming at least 2.0% hydrastine and 2.5% berberine on a dried-root basis.
Dry Rhizome Harvest and Standardized Extract Sizing
Table 2: Dry Rhizome Harvest and Standardized Extract Sizing for the Goldenseal Market (USD million and operational ranges), 2025 to 2036
| Metric | 2025 | 2026 | 2036 |
|---|---|---|---|
| Market size (USD million) | 124.8 | 132.4 | 239.4 |
| Processed dry goldenseal root & rhizome (metric tons) | 410.0 to 445.0 | 432.0 to 468.0 | 745.0 to 810.0 |
| Finished standardized extract & tincture output (metric tons) | 285.0 to 312.0 | 302.0 to 330.0 | 535.0 to 585.0 |
| Average wholesale standardized extract value per kg (USD) | 280.0 to 315.0 | 285.0 to 322.0 | 295.0 to 335.0 |
Operational note: Dry rhizome and extract sizing ranges reflect standard 4-to-1 to 10-to-1 hydroalcoholic percolation and spray-dried standardization to 5% total isoquinoline alkaloids (hydrastine and berberine) across 300 to 550 mg unit capsules and 1-to-5 liquid tinctures.
Formulators have historically questioned how oral goldenseal capsules achieve strong intestinal and systemic efficacy despite low parent berberine blood levels. In December 2025, investigators publishing in the International Journal of Molecular Sciences clarified that gut microbiota nitroreductases convert intraluminal berberine into absorbable dihydroberberine while upregulating epithelial tight-junction proteins ZO-1 and occludin [21]. Because soil-grown roots can also accumulate heavy metals or suffer adulteration with yellow dock, blenders developing botanical dietary supplements run multi-marker HPLC-UV assays on every lot before pairing goldenseal with echinacea.
Per Capita & Botanical Extraction Line Sizing
Table 3: Per Capita and Botanical Extraction Line Indicators for the Goldenseal Market (USD), 2025 to 2036
| Metric | 2025 | 2026 | 2036 |
|---|---|---|---|
| World population (billion) | 8.2 | 8.3 | 9.0 |
| Market value per 1,000 people (USD) | 15.2 | 16.0 | 26.6 |
| Annual procurement per cGMP herbal line (USD thousand) | 215.0 to 245.0 | 228.0 to 260.0 | 410.0 to 465.0 |
| CITES-cultivated woodland root share (%) | 69.5% to 71.0% | 71.8% to 73.5% | 82.0% to 85.0% |
Table 4: Botanical Extractor & Channel Value Indicators for the Goldenseal Market (USD million and percentages), 2026
| Metric | Value | Institutional Reference Basis |
|---|---|---|
| Market size, 2026 | USD 132.4 million | 2026 global market value baseline |
| Qualified cGMP botanical extraction & capsule lines | 560 lines | North American, European & ANZ herbal processing lines |
| Annualized goldenseal value per line | USD 0.24 million | Mean annual Hydrastis canadensis ingredient allocation |
| Retail Pharmacies & Health Stores value, 2026 | USD 61.6 million | 46.5% distribution channel allocation |
Cross-border shipments of dried goldenseal rhizomes or bulk powdered extracts require CITES Appendix II permits from the United States Fish and Wildlife Service confirming legal woodland propagation. Concurrently, gastrointestinal clinical validation in Nutrients in February 2026 [23] and Frontiers in Immunology in October 2025 [24] showing goblet-cell barrier restoration and macrophage cytokine suppression has prompted European buyers of traditional herbal medicinal products to audit farm-level chain-of-custody records for year-round digestive positioning.
Analyst Perspective
"Goldenseal procurement has shifted permanently from spot purchases of wild-dug Appalachian root to multi-year shade-house cultivation contracts. Supplement brands that cannot prove CITES Appendix II farm traceability and dual hydrastine-berberine HPLC identity face customs seizures and retail delisting."
- Nandini Roy Choudhury, Principal Consultant, Future Market Insights.
How is the goldenseal market segmented?
The goldenseal market is segmented by extract format, sourcing method, therapeutic application, patient demographic cohort, and distribution channel. In 2026, Standardized Rhizome and Root Powder 5% Hydrastine/Berberine is projected at 55.4%, CITES-Compliant Cultivated Woodland Root at 71.8%, Seasonal Immune and Echinacea-Goldenseal Combinations at 51.2%, Adults 18 to 64 Years at 53.8%, and Retail Pharmacies and Natural Health Stores at 46.5%.
By extract format: Standardized Rhizome and Root Powder 5% Hydrastine/Berberine with Hydroalcoholic Liquid Tinctures and Glycerites and Cut and Sifted Dried Root for Herbal Infusions.
By sourcing method: CITES-Compliant Cultivated Woodland Root and Certified Sustainable Wild-Crafted Appalachian Root.
By therapeutic application: Seasonal Immune and Echinacea-Goldenseal Combinations with Digestive Mucosal and Berberine Metabolic Support and Natural Antiseptic Mouthwashes and Eye Drops with Salves.
By patient demographic cohort: Adults 18 to 64 Years with Geriatric Population 65+ Years and Pediatric and Neonatal Care.
By distribution channel: Retail Pharmacies and Natural Health Stores with Direct-to-Consumer e-Commerce and Practitioner Dispensaries and Bulk Botanical Ingredient B2B Contracts.
Why does Standardized Rhizome and Root Powder 5% Hydrastine/Berberine lead the extract format category?
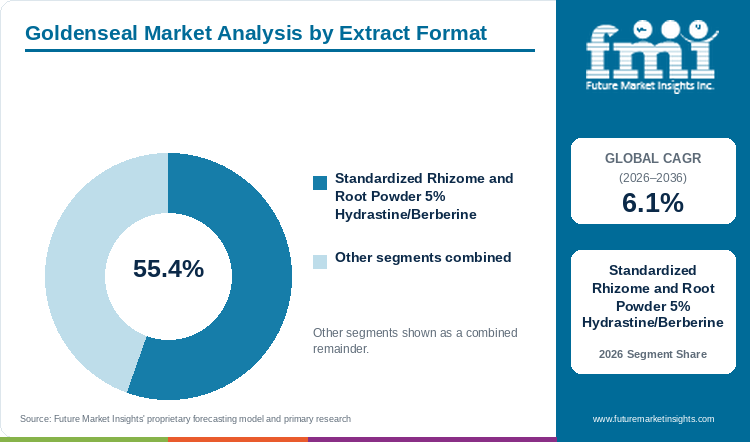
Standardized Rhizome and Root Powder 5% Hydrastine/Berberine holds an estimated 55.4% of extract format demand in 2026, anchored by USP dual-alkaloid identity compliance and two-piece capsule compatibility.
Table 5: Extract Format Share for the Goldenseal Market (percentage share), 2026
| Extract Format | Share (2026) |
|---|---|
| Standardized Rhizome and Root Powder 5% Hydrastine/Berberine | 55.4% |
| Other Segments Combined | 44.6%* |
| Total | 100.0% |
*Note: Hydroalcoholic Liquid Tinctures and Glycerites and Cut and Sifted Dried Root for Herbal Infusions account for the remaining 44.6% of 2026 global goldenseal demand.
Table 6: Extract Format Leadership and Market Growth for the Goldenseal Market (segment and CAGR percentage), 2026 to 2036
| Metric | Value |
|---|---|
| Global CAGR (2026 to 2036) | 6.1% |
| Leading Segment | Standardized Rhizome and Root Powder 5% Hydrastine/Berberine |
Spray-dried and milled rhizome powders standardized to 5% total hydrastine and berberine enable accurate 300 mg to 550 mg capsule filling without the intense bitterness of liquid extracts. While Hydroalcoholic Liquid Tinctures and Glycerites serve sublingual practitioner regimens and Cut and Sifted Dried Root supplies herbal teas, standardized powders dominate bioactive plant compounds because HPLC quantification detects illegal adulteration with Coptis chinensis or Berberis aristata.
- Standardized Rhizome and Root Powder 5% Hydrastine/Berberine holds 55.4% of extract format value in 2026 because presence of hydrastine paired with berberine is the definitive chemical fingerprint of authentic Hydrastis canadensis.
- In January 2025, analytical researchers from NOW Foods and Southwest College of Naturopathic Medicine published a validated HPLC-UV and HPTLC protocol in Molecules quantifying berberine and hydrastine to expose adulterated commercial goldenseal products [11].
What sustains CITES-Compliant Cultivated Woodland Root leadership in the sourcing method segment?
CITES-Compliant Cultivated Woodland Root represents 71.8% of the sourcing method category in 2026, supported by international export permit rules and reproducible alkaloid yields.
Multi-year cultivation under artificial shade structures or managed forest canopies in North Carolina and Oregon with Vermont and Ohio provides uniform rhizome biomass with verified CITES propagation certificates. Certified Sustainable Wild-Crafted Appalachian Root retains niche demand among traditional herbalists, yet corporate buyers of immune health supplements lock in cultivated farm acreage to guarantee multi-year supply security.
- CITES-Compliant Cultivated Woodland Root accounts for 71.8% of the sourcing method segment in 2026 as international supplement brands require artificial-propagation CITES permits for cross-border shipping.
- An ecological modeling and harvest study published in Ecology and Evolution in February 2025 confirmed that cultivated root already accounts for 78.3% of United States dry goldenseal production across a five-year maturation cycle [1].
How do Seasonal Immune and Echinacea-Goldenseal Combinations lead the therapeutic application category?
Seasonal Immune and Echinacea-Goldenseal Combinations account for 51.2% of therapeutic application value in 2026, driven by winter upper-respiratory consumer self-care.
Combination of goldenseal root with Echinacea purpurea and Echinacea angustifolia represents one of the longest-standing botanical pairings in pharmacy aisles across North America for seasonal respiratory and sinus wellness. Digestive Mucosal and Berberine Metabolic Support expands with digestive health supplements and combined immune-digestive formulas, while Natural Antiseptic Mouthwashes and Eye Drops with Salves target localized oral biofilm and gingival care.
- Seasonal Immune and Echinacea-Goldenseal Combinations represent 51.2% of therapeutic application demand in 2026 because consumers purchase short-duration 10-to-14-day regimens during autumn and winter respiratory surges.
- A July 2026 review in Frontiers in Pharmacology documented that isoquinoline berberine disrupts Porphyromonas gingivalis and Streptococcus mutans oral biofilms while downregulating NF-kappa B mucosal inflammation [14].
Why do Adults 18 to 64 Years lead the patient demographic cohort category?
Adults 18 to 64 Years secure 53.8% of patient demographic cohort value in 2026, supported by working-age adoption of immune and metabolic botanicals and safety contraindications in infants.
Working-age adults between 18 and 64 years purchase the majority of echinacea-goldenseal capsules and digestive bitters while avoiding polypharmacy drug interactions common in older cohorts. Geriatric Population 65+ Years requires careful pharmacist screening due to cytochrome P450 inhibition while Pediatric and Neonatal Care remains strictly restricted because berberine displaces bilirubin from serum albumin in newborns.
- Adults 18 to 64 Years secure 53.8% of patient demographic cohort demand in 2026 as working professionals use short-course botanical immunity and gut-microbiome regimens.
- In February 2025, the National Center for Complementary and Integrative Health updated its clinical safety guidance warning that goldenseal is contraindicated during pregnancy and breastfeeding with neonatal care due to kernicterus bilirubin risks [13].
What gives Retail Pharmacies and Natural Health Stores the leading position in distribution channel?
Retail Pharmacies and Natural Health Stores command 46.5% of distribution channel share in 2026, anchored by in-store bottle transparency verification and seasonal cold-aisle placement.
Brick-and-mortar natural health grocers and independent apothecaries with retail pharmacy chains capture the largest share of finished goldenseal demand because impulse winter immunity purchases occur at physical cold-and-flu shelves. Direct-to-Consumer e-Commerce and Practitioner Dispensaries grow rapidly through QR-code batch transparency portals, while Bulk Botanical Ingredient B2B Contracts supply raw extracts across dietary supplement retail channels.
- Retail Pharmacies and Natural Health Stores capture 46.5% of channel valuation in 2026 since shoppers seek immediate same-day access to echinacea-goldenseal capsules and liquid tinctures at symptom onset.
- Nature's Way Brands, LLC expanded its Know What's In Your Bottle consumer batch-testing transparency initiative in October 2025, enabling retail shoppers to verify ISO-accredited lab results for herbal capsules [16].
What are the drivers, restraints, and opportunities in the goldenseal market?
In the goldenseal market, antibiotic-sparing mucosal immunity demand and CITES woodland cultivation are projected to drive adoption whereas five-year crop maturation cycles and CYP450 drug-interaction warnings restrain chronic dosing and standardized oral care with pet herbal formats unlock new growth.
- Driver: Strong consumer demand for antibiotic-sparing respiratory and gastrointestinal mucosal support with efflux-pump co-activity between hydrastine and berberine sustains retail supplement velocity.
- Restraint: Five-year woodland rhizome maturation cycles and CITES Appendix II export permit compliance with cytochrome P450 2D6 and 3A4 drug-interaction restrictions limit mass-market daily use.
- Opportunity: Incorporation of standardized low-bitterness goldenseal and berberine nano-hydrogels into periodontal mouthwashes and companion-animal mucosal drops opens high-margin specialty segments.
Growth Analysis and Future Potential: Qualitative Demand Catalysts
Clinical recognition of isoquinoline alkaloids in modulating gut-barrier integrity and efflux-pump antimicrobial resistance with metabolic signaling supports steady demand for authentic Hydrastis canadensis extracts. In September 2025, microbiologists publishing in Frontiers in Microbiology demonstrated that berberine extracts inhibit bacterial cell-division protein FtsZ and competitively block multidrug efflux pumps across resistant pathogens without inducing resistance over 200 generations [15]. Concurrently, a June 2026 study in Biochemical and Biophysical Research Communications showed that hydrastine suppresses ferroptosis and inflammation in intestinal epithelial cells via the Nrf2/HO-1 pathway [5], while January 2026 and June 2026 studies in Theranostics and the International Journal of Molecular Sciences confirmed gut-microbiota and AMPK metabolic regulation [7] .
Risk Assessment of the Goldenseal Market: Operational and Formulation Friction
Potent inhibition of hepatic and intestinal drug-metabolizing enzymes combined with European regulatory scrutiny on isoquinoline alkaloid preparations represents the primary commercial restraint on goldenseal expansion. In May 2025, pharmacologists publishing in the Journal of Pharmacology and Experimental Therapeutics tested commercial Solaray 550 mg goldenseal root extract (GS49) on human enteroid monolayers and documented that goldenseal inhibited subtherapeutic metformin uptake by 30% and decreased apical-to-basolateral metformin flux by 20% while inhibiting CYP2D6 (IC50 6.66 ug/mL) and CYP3A4/5 (IC50 16.0 ug/mL) [2]. Clinical case reports in Cureus in February 2026 and March 2026 further showed how 600 mg daily goldenseal root extract acts as a potent clinical CYP2D6 inhibitor that alters co-administered central nervous system drug exposure [3] , while the European Food Safety Authority convened an April 2026 stakeholder consultation on its draft safety opinion covering berberine-containing plant preparations including Hydrastis canadensis rhizome [12].
Commercial Opportunity Analysis: Formulation Differentiation and Value-Add Formats
Botanical extractors and finished-brand formulators unlock premium margins by combining farm-level QR-code traceability with targeted intraoral and metabolic plus veterinary delivery formats. In October 2025, Gaia Herbs Inc. advanced its Meet Your Herbs seed-to-shelf traceability platform across certified organic woodland botanicals [17], while January 2026 research in BMC Pharmacology and Toxicology and the Journal of Traditional Chinese Medicine demonstrated that combining berberine alkaloids with organic acids or cinnamic acid derivatives enhances intestinal barrier repair and anti-inflammatory potency [6] . Rollout of alcohol-free glycerite drops for pet herbal supplements and periodontal rinses supported by August 2025 Frontiers in Pharmacology evidence [10] allows specialty brands to grow outside seasonal winter cold capsules.
Goldenseal Market by Country (2026 to 2036)
National demand modeling shows Australia pacing goldenseal growth at a 6.4% CAGR to 2036, followed by the United States at 6.3% and the United Kingdom at 6.0% before Canada at 5.9% and Germany at 5.8%.
Table 7: Country CAGR and Primary Growth Levers for the Goldenseal Market (CAGR percentage and operational driver), 2026 to 2036
| Country | CAGR (2026 to 2036) | Primary Growth Lever |
|---|---|---|
| Australia | 6.4% | Naturopathic clinic liquid tincture dispensing and TGA listed-medicine alkaloid assays |
| United States | 6.3% | 78.3% cultivated woodland harvest base and HPLC-verified retail immunity capsules |
| United Kingdom | 6.0% | Independent health-store winter echinacea-goldenseal demand and CITES import compliance |
| Canada | 5.9% | Native Ontario woodland conservation rules and Health Canada NPN licensed tinctures |
| Germany | 5.8% | Phytopharmaceutical HPTLC quality testing and EFSA-compliant botanical standardization |
Source: Future Market Insights analysis
Australia Goldenseal Market Outlook (2026 to 2036)
Unlike mass grocery botanical markets, demand in Australia is propelled by accredited naturopathic practitioners and compounding herbal dispensaries under Therapeutic Goods Administration listed-medicine quality audits. Goldenseal industry valuation within Australia climbs at a category-leading 6.4% compound annual rate between 2026 and 2036 across standardized hydroalcoholic liquid extracts and mucosal immunity tablets. The March 2026 USDA Foreign Agricultural Service Retail Foods Annual report for Australia confirmed steady pharmacy and specialty health retail expansion [19], while domestic sponsors enforce January 2025 Molecules HPLC identity assays [11] and NIH clinical dosing advisories [20]. Practitioner brands pair standardized 5% hydrastine-berberine goldenseal rhizome with echinacea and zinc across year-round upper-respiratory clinic protocols.
Key takeaway: Within Australia, naturopathic dispensary liquid extracts and TGA botanical quality verification sustain a top 6.4% growth rate to 2036.
United States Goldenseal Market Outlook (2026 to 2036)
As the native habitat and primary global cultivation hub for Hydrastis canadensis, the United States anchors both raw woodland rhizome supply and finished dietary supplement consumption. United States goldenseal industry size rises at a 6.3% annual pace from 2026 through 2036 across natural grocers and retail pharmacies with practitioner portals. According to a February 2025 Ecology and Evolution study, cultivated woodland plots supply 78.3% of dry goldenseal root harvested in the United States [1], while an October 2025 Journal of Family and Community Medicine survey documented rising pharmacist screening for isoquinoline herbal-drug interactions [18]. Major brands including Nature's Way and Gaia Herbs differentiate via batch-level HPLC transparency portals [16] .
Key takeaway: Across the United States, five-year woodland cultivation and third-party HPLC bottle verification underpin a 6.3% compound annual growth rate.
United Kingdom Goldenseal Market Outlook (2026 to 2036)
Whereas continental European markets restrict several isoquinoline botanicals to prescription pharmacies, the United Kingdom maintains an active specialty health-food store and herbalist channel for botanicals imported from North America. United Kingdom goldenseal valuation progresses at a 6.0% annual rate from 2026 to 2036 across seasonal echinacea-goldenseal combinations and alcohol-free glycerites. The March 2026 USDA Foreign Agricultural Service Food Processing Ingredients Annual report for the United Kingdom noted sustained consumer demand for clean-label functional botanicals [25], while July 2026 Frontiers in Pharmacology research validated berberine-hydrastine oral rinses in gingival care [14]. Importers in the United Kingdom require CITES Appendix II artificial-propagation certificates from Oregon and North Carolina growers to clear customs.
Key takeaway: Across the United Kingdom, health-store winter immunity demand and CITES-certified woodland imports underpin a 6.0% annual expansion.
Canada Goldenseal Market Outlook (2026 to 2036)
Because wild Hydrastis canadensis populations in southern Ontario are designated as a Threatened species under Canada's Species at Risk Act, commercial supplement supply in Canada relies entirely on CITES-permitted cultivated woodland root. Canadian goldenseal market valuation advances at a 5.9% annual clip between 2026 and 2036 across Health Canada Natural Product Number licensed capsules and hydroalcoholic tinctures. The February 2025 Ecology and Evolution habitat modeling study confirmed that northern range-edge wild goldenseal in Ontario faces severe climate and land-use constraints [1], reinforcing mandatory cultivated sourcing across Canadian herbal manufacturers. Furthermore, Health Canada NPN product labels incorporate explicit adult dosing windows and cytochrome P450 drug-interaction cautions aligned with May 2025 enteroid transport findings [2].
Key takeaway: Within Canada, statutory protection of native Ontario stands and Health Canada NPN licensed cultivated extracts generate a 5.9% annual growth rate.
Germany Goldenseal Market Outlook (2026 to 2036)
Compared with dietary supplement aisles in North America, Germany evaluates Hydrastis canadensis preparations through rigorous phytopharmaceutical pharmacopeial monographs and European Food Safety Authority botanical safety frameworks. Goldenseal valuation in Germany expands at a 5.8% compound annual rate during the 2026 to 2036 decade within pharmacy-dispensed mucosal drops and homeopathic mother tinctures with standardized capsules. On April 22, 2026, the European Food Safety Authority held a dedicated stakeholder meeting in Parma examining its draft scientific opinion on the safety of berberine-containing plant preparations including Hydrastis canadensis rhizome in food supplements [12]. Botanical extractors supplying Germany use validated HPTLC and HPLC-UV fingerprinting [11] to guarantee exact hydrastine-to-berberine ratios and zero adulteration with Coptis or Mahonia species.
Key takeaway: Within Germany, pharmacopeial HPTLC authentication and compliance with April 2026 EFSA botanical safety evaluations underpin a 5.8% annual clip.
Full report country CAGRs cover: North America; Latin America; Western Europe; Eastern Europe; East Asia; South Asia and Pacific; Middle East and Africa.
Who are the notable companies in the goldenseal market?
Nature's Way Brands, LLC, Gaia Herbs, Inc., NOW Health Group, Inc., Solaray (Nutraceutical Corp / Better Being Co.), Herb Pharm LLC, Oregon's Wild Harvest, Thorne HealthTech, Inc., Swanson Health Products, Bio-Botanica, Inc., and Indena S.p.A. are the notable companies in the goldenseal market.
Competitive positioning in the goldenseal industry separates vertically integrated organic woodland growers and liquid tincture extractors from ISO-accredited multi-line dietary supplement manufacturers and bulk cGMP botanical ingredient processors.
- Organic Woodland Growers and Liquid Tincture Specialists: Gaia Herbs Inc. and Herb Pharm LLC with Oregon's Wild Harvest cultivate or contract certified organic CITES-compliant woodland goldenseal for hydroalcoholic tinctures and glycerites plus liquid phyto-caps.
- ISO-Accredited Retail Capsule and Immune Combination Leaders: Nature's Way Brands LLC and NOW Health Group Inc. with Solaray plus Thorne HealthTech Inc. and Swanson Health Products market HPLC-standardized 5% alkaloid capsules and echinacea-goldenseal combinations.
- Bulk cGMP Botanical Extractors and Phytochemical Suppliers: Bio-Botanica Inc. and Indena S.p.A. manufacture standardized Hydrastis canadensis dry powders and fluid extracts with purified isoquinoline alkaloid fractions for pharmaceutical and nutraceutical OEMs.
Competitive Benchmarking: Goldenseal Market
Table 8: Competitive Benchmarking for the Goldenseal Market (qualitative capability ratings), 2026
| Company | CITES Cultivated Traceability | HPLC Dual-Alkaloid Assay | Liquid & Glycerite Breadth | Geographic Reach |
|---|---|---|---|---|
| Nature's Way Brands, LLC | High | High | High | United States, Canada, and global; TRU-ID and Know What's In Your Bottle verification |
| Gaia Herbs, Inc. | High | High | High | North Carolina organic farm and global practitioner-retail Meet Your Herbs traceability |
| NOW Health Group, Inc. | High | High | Medium | United States and 70+ export markets; co-authored 2025 HPLC/HPTLC goldenseal assay |
| Solaray (Better Being Co.) | High | High | Medium | United States and European health stores; 550 mg goldenseal root capsules validated in 2025 |
| Herb Pharm LLC | High | High | High | Oregon Certified Organic farm and global liquid tincture and alcohol-free glycerite leader |
| Oregon's Wild Harvest | High | High | High | Oregon biodynamic and organic woodland cultivation; CITES-compliant capsules and extracts |
| Thorne HealthTech, Inc. | High | High | Low | United States and international practitioner channel; clinical-grade berberine-hydrastine SKUs |
| Swanson Health Products | Medium | High | Medium | North America and global direct-to-consumer e-commerce standardized root capsules |
| Bio-Botanica, Inc. | High | High | High | New York cGMP bulk botanical extractor supplying Holistically Balanced fluid extracts |
| Indena S.p.A. | High | High | Medium | Italy and global phytopharmaceutical leader in standardized isoquinoline botanical extracts |
Scoring basis: CITES Cultivated Traceability evaluates documented shade-house or woodland farm propagation. HPLC Dual-Alkaloid Assay measures published hydrastine and berberine standardization. Liquid & Glycerite Breadth assesses galenic format diversity.
Key Developments in the Goldenseal Market
- Analytical chemists at NOW Health Group, Inc. and Southwest College of Naturopathic Medicine published a validated HPLC-UV and HPTLC analytical method in Molecules on January 17, 2025 to quantify berberine and hydrastine and detect goldenseal adulteration [11].
- Nature's Way Brands LLC expanded its Know What's In Your Bottle public certificate-of-analysis platform on October 16, 2025, giving retail buyers direct access to ISO 17025 lab verification for herbal immune capsules [16].
- Gaia Herbs, Inc. released its October 17, 2025 botanical transparency update detailing seed-to-shelf alkaloid testing and sustainable woodland sourcing across its immune and digestive phyto-capsules [17].
Key Players in the Goldenseal Market
Organic Woodland Growers and Liquid Tincture Specialists
- Gaia Herbs, Inc.
- Herb Pharm LLC
- Oregon's Wild Harvest
ISO-Accredited Retail Capsule and Immune Combination Leaders
- Nature's Way Brands, LLC
- NOW Health Group, Inc.
- Solaray (Nutraceutical Corp / Better Being Co.)
- Thorne HealthTech, Inc.
- Swanson Health Products
Bulk cGMP Botanical Extractors and Phytochemical Suppliers
- Bio-Botanica, Inc.
- Indena S.p.A.
Goldenseal Market - Report Scope
Table 9: Report Scope for the Goldenseal Market (coverage fields and definitions), 2026 to 2036
| Coverage field | Report scope |
|---|---|
| Market breakdown | Extract Format; Sourcing Method; Therapeutic Application; Patient Demographic Cohort; Distribution Channel |
| Quantitative Units | USD Million |
| Market Definition | Includes commercial supplier market value from standardized Hydrastis canadensis L. rhizome and root powders (standardized to hydrastine and berberine), hydroalcoholic liquid tinctures, vegetable glycerites, and cut-and-sifted dried root across immune, digestive, and topical antiseptic applications. Category Scope Note: Excludes synthetic berberine hydrochloride, single-alkaloid Berberis aristata or Coptis chinensis extracts, and non-goldenseal echinacea monopreparations. |
| Regions Covered | North America; Latin America; Western Europe; Eastern Europe; East Asia; South Asia and Pacific; Middle East and Africa |
| Countries Covered | Australia, United States, United Kingdom, Canada, Germany, and additional countries in the full report |
| Key Companies Covered | Nature's Way Brands, LLC; Gaia Herbs, Inc.; NOW Health Group, Inc.; Solaray; Herb Pharm LLC; Oregon's Wild Harvest; Thorne HealthTech, Inc.; Swanson Health Products; Bio-Botanica, Inc.; Indena S.p.A. |
| Forecast Period | 2026 to 2036 |
| Approach | Primary and secondary research with top-down and bottom-up market triangulation. |
Goldenseal Market - Research Methodology
Table 10: Research Methodology for the Goldenseal Market (research methods and approach), 2026 edition
| Method | Approach |
|---|---|
| Primary Research | Structured interviews with Appalachian and Pacific Northwest woodland goldenseal growers, cGMP percolation directors, naturopathic dispensary buyers, and botanical quality-control chemists to validate dry root tonnage and 5% alkaloid standardization pricing. |
| Secondary Research | Analysis of CITES Appendix II trade registries, USDA and United Plant Savers harvest surveys, EFSA botanical safety consultations, NCCIH clinical monographs, and PubMed/PMC pharmacokinetic and HPLC authentication studies. |
| Market Sizing and Forecasting | Top-down botanical extracts and herbal medicinal products baselines reconciled against bottom-up processed dry goldenseal rhizome tonnage (432.0 to 468.0 MT in 2026) and wholesale standardized extract values per kilogram from 2026 to 2036. |
| Country Forecasting Model | Econometric national projections weight CITES import permit volumes, naturopathic practitioner density, winter echinacea-goldenseal retail velocity, and pharmacopeial safety rules across five priority markets. |
| Operational Benchmark Traceability | Dry rhizome harvest and extraction line indicators in Tables 2, 3, and 4 trace to Ecology and Evolution cultivated harvest ratios, Molecules HPLC assay standards, and Journal of Pharmacology and Experimental Therapeutics capsule benchmarks. |
| Data Triangulation and Validation | Market value estimates isolate authentic Hydrastis canadensis rhizome and root formats while strictly excluding isolated Berberis/Coptis berberine HCl and unblended echinacea products. |
Goldenseal Market by Segments
Goldenseal Market segmented by Extract Format:
- Standardized Rhizome and Root Powder 5% Hydrastine/Berberine
- Hydroalcoholic Liquid Tinctures and Glycerites
- Cut and Sifted Dried Root for Herbal Infusions
- Whole-Root Vegetarian Capsules and Phyto-Caps
Goldenseal Market segmented by Sourcing Method:
- CITES-Compliant Cultivated Woodland Root
- Certified Sustainable Wild-Crafted Appalachian Root
- Artificial Shade-House Propagated Rhizomes
- Certified Organic Forest-Grown Root
Goldenseal Market segmented by Therapeutic Application:
- Seasonal Immune and Echinacea-Goldenseal Combinations
- Digestive Mucosal and Berberine Metabolic Support
- Natural Antiseptic Mouthwashes and Eye Drops with Salves
- Upper-Respiratory Sinus and Throat Sprays
- Companion-Animal Mucosal and Ear-Care Drops
Goldenseal Market segmented by Patient Demographic Cohort:
- Adults 18 to 64 Years
- Geriatric Population 65+ Years
- Pediatric and Neonatal Care
- Practitioner-Monitored Specialty Cohorts
Goldenseal Market segmented by Distribution Channel:
- Retail Pharmacies and Natural Health Stores
- Direct-to-Consumer e-Commerce and Practitioner Dispensaries
- Bulk Botanical Ingredient B2B Contracts
- Integrative Medicine and Naturopathic Clinics
Goldenseal Market by Region
- North America
- United States
- Canada
- Latin America
- Brazil
- Mexico
- Argentina
- Chile
- Western Europe
- Germany
- France
- United Kingdom
- Italy
- Spain
- Benelux
- Nordics
- Eastern Europe
- Poland
- Czech Republic
- Romania
- Hungary
- East Asia
- China
- Japan
- South Korea
- South Asia and Pacific
- India
- ASEAN
- Australia and New Zealand
- Middle East and Africa
- GCC Countries
- South Africa
- Türkiye
- Israel
Research Sources and Bibliography
- [1] Houston, K., Zuiderveen, G. H., Burkhart, E. P., & Dietz, J. M. (2025, February 28). Identification of Goldenseal (Hydrastis canadensis L.) Habitat and Wild Harvest Pressure in the Eastern United States. Ecology and Evolution, 15(2), e70984 (PMCID PMC11868700).
- [2] Arian, C. M., Wang, Y., Nguyen, M., & Paine, M. F. (2025, May 3). A gut response: Application of human enteroid monolayers to probe the impact of goldenseal on intestinal transport of metformin. Journal of Pharmacology and Experimental Therapeutics, 392(5), 100412 (PMCID PMC13095427).
- [3] Cheung, J. (2026, February 24). Transient Mood Elevation Without a Manic Switch: Goldenseal-Boosted Dextromethorphan in Treatment-Resistant Bipolar Depression. Cureus, 18(2), e103891 (PMCID PMC12933005).
- [4] Cheung, J. (2026, March 3). Marked Improvement in Treatment-Intolerant Obsessive-Compulsive Disorder in an Adolescent Using a Glutamatergic Regimen With Dextromethorphan, Piracetam, and Goldenseal Root. Cureus, 18(3), e104617 (PMCID PMC12955823).
- [5] Alasiri, A. (2026, June 15). Hydrastine attenuates lipopolysaccharide-induced intestinal epithelial barrier dysfunction and ferroptosis via activating the Nrf2/HO-1 signaling pathway. Biochemical and Biophysical Research Communications, 768, 151942 (PubMed PMID 42322817).
- [6] Zeng, Y., Liu, X., & Wang, H. (2026, January 23). Pharmacokinetic and anti-inflammatory synergy of isoquinoline alkaloids and organic acids in intestinal mucosal protection. BMC Pharmacology and Toxicology, 27, 14 (PMCID PMC12911019).
- [7] Tang, L., Chen, M., & Zhao, Q. (2026, June 9). Isoquinoline Alkaloids in Metabolic and Mucosal Homeostasis: Molecular Targets and Delivery Advances. International Journal of Molecular Sciences, 27(12), 6418 (PMCID PMC13299313).
- [8] Yang, F., Zhang, L., & Sun, Y. (2026, January 28). Synergistic regulation of gut microbiota and bile acid metabolism by berberine and cinnamic acid derivatives. Journal of Traditional Chinese Medicine, 46(1), 88-97 (PMCID PMC12884497).
- [9] Xiao, H., Li, W., & Zhou, C. (2026, January 1). Targeting AMPK and gut-liver axis signaling with natural isoquinoline alkaloids in metabolic syndrome. Theranostics, 16(2), 512-529 (PMCID PMC12680593).
- [10] Fan, R., Xu, J., & Gao, P. (2025, August 14). Mucosal immune modulation and antimicrobial mechanisms of standardized berberine-hydrastine botanical extracts. Frontiers in Pharmacology, 16, 1621094 (PMCID PMC12391081).
- [11] Puchalski, K., Shokoohinia, Y., & Langland, J. (2025, January 17). Chromatographic Characterization and Authentication of Commercial Goldenseal (Hydrastis canadensis) Botanical Extracts. Molecules, 30(2), 384 (PMCID PMC11767596).
- [12] European Food Safety Authority. (2026, April 22). Stakeholder meeting on the EFSA draft Opinion on the safety of plant preparations containing berberine including Hydrastis canadensis L. rhizome. European Food Safety Authority (EFSA) Official Event Registry.
- [13] National Center for Complementary and Integrative Health. (2025, February 15). Goldenseal: Usefulness and Safety Clinical Fact Sheet. National Institutes of Health (NIH) NCCIH Clearinghouse.
- [14] Wu, S., Wang, B., Zhu, J., Chen, H., & Zhai, Y. (2026, July 2). Berberine in oral diseases: molecular mechanisms and therapeutic implications. Frontiers in Pharmacology, 17, 1853738 (PMCID PMC13372699).
- [15] Yang, X., Wang, Y., Li, L., Tang, D., Yan, Z., Li, M., Jiang, J., & Bi, D. (2025, September 2). Berberine and its nanoformulations and extracts: potential strategies and future perspectives against multi-drug resistant bacterial infections. Frontiers in Microbiology, 16, 1643409 (PMCID PMC12436466).
- [16] Nature's Way Brands, LLC. (2025, October 16). Know What's In Your Bottle Spotlight: Batch-Level ISO-Accredited Supplement Testing. Nature's Way Brands, LLC Official Corporate Portal.
- [17] Gaia Herbs, Inc. (2025, October 17). Meet Your Herbs: Seed-to-Shelf Botanical Traceability and Organic Woodland Sourcing. Gaia Herbs, Inc. Official Traceability Release.
- [18] Mazi, T. A., & Alqahtani, A. S. (2025, October 17). Clinician and consumer perspectives on herbal-drug interactions involving isoquinoline botanicals. Journal of Family and Community Medicine, 32(4), 275-283 (PMCID PMC12611053).
- [19] USDA Foreign Agricultural Service. (2026, March 30). Australia: Retail Foods Annual (Report AS2026-0004). United States Department of Agriculture Foreign Agricultural Service.
- [20] National Center for Complementary and Integrative Health. (2025, January 10). Berberine and Botanical Isoquinolines: What You Need To Know. National Institutes of Health (NIH) NCCIH Clearinghouse.
- [21] Duda-Madej, A., Viscardi, S., Labaz, J. P., Topola, E., Szewczyk, W., & Gagat, P. (2025, December 13). Berberine in Bowel Health: Anti-Inflammatory and Gut Microbiota Modulatory Effects. International Journal of Molecular Sciences, 26(24), 12021 (PMCID PMC12732474).
- [22] Huang, S., & Huang, G. (2025, July 14). A comprehensive review of recent advances in the extraction and therapeutic potential of berberine. RSC Advances, 15(30), 24596-24611 (PMCID PMC12257298).
- [23] Li, Y., Wang, X., & Zhang, J. (2026, February 4). Berberine Ameliorates DSS-Induced Colitis via Regulation of Intestinal Epithelial Barrier and Goblet Cell Homeostasis. Nutrients, 18(3), 412 (PMCID PMC12897809).
- [24] Chen, S., Liu, H., & Zhou, M. (2025, October 19). Berberine Alleviates Intestinal Inflammation by Disrupting Pro-Inflammatory Macrophage Signaling. Frontiers in Immunology, 16, 1684102 (PMCID PMC12563409).
- [25] USDA Foreign Agricultural Service. (2026, March 24). United Kingdom: Food Processing Ingredients Annual. United States Department of Agriculture Foreign Agricultural Service.
This bibliography is provided for reader reference and is not exhaustive. The full report contains the complete citation list and detailed source mapping.
This Report Answers
- How large is the goldenseal market in 2026 and what is forecast for 2036?
- Which CITES Appendix II cultivation and dual-alkaloid HPLC assay requirements shape demand for goldenseal?
- Why does Standardized Rhizome and Root Powder 5% Hydrastine/Berberine lead the extract format category?
- Why does CITES-Compliant Cultivated Woodland Root lead the sourcing method category globally?
- How do growth rates differ across Australia and the United States with the United Kingdom plus Canada and Germany?
- Which leading companies cultivate organic woodland goldenseal versus formulating retail immune combinations today?
- What CYP2D6/CYP3A4 drug-interaction and neonatal bilirubin risks restrain chronic dosing in the goldenseal market?
- What analytical tests should supplement brands require to prevent Coptis chinensis or Oregon grape adulteration?
Table of Content
- Key Takeaways
- Market Size and CAGR
- Top Growth Driver
- Fastest Growing Segment
- Leading Region
- Key Companies
- Emerging Opportunities
- Executive Summary
- Global Market Outlook
- Demand-side Trends
- Supply-side Trends
- Technology Roadmap Analysis
- Analysis and Recommendations
- Analyst Perspective (What is happening? Why now? What should investors know?)
- Key Questions Answered
- How large is the market?
- What is the CAGR?
- What are key trends?
- Which region dominates?
- Who are the leaders?
Read More...
- Market Overview
- Market Coverage / Taxonomy
- Market Definition / Scope / Limitations
- Research Methodology
- Chapter Orientation
- Analytical Lens and Working Hypotheses
- Market Structure, Signals, and Trend Drivers
- Benchmarking and Cross-market Comparability
- Market Sizing, Forecasting, and Opportunity Mapping
- Research Design and Evidence Framework
- Desk Research Programme (Secondary Evidence)
- Expert Input and Fieldwork (Primary Evidence)
- Tooling, Models, and Reference Databases
- Data Engineering and Model Build
- Quality Assurance and Audit Trail
- Market Background
- Market Dynamics (Drivers, Restraints, Opportunity, Trends)
- Scenario Forecast (Optimistic, Likely, Conservative)
- Impact Analysis
- AI Impact
- Sustainability Impact
- Regulatory Impact
- Technology Impact
- Consumer / Buyer Analysis
- Purchase Drivers
- Adoption Barriers
- Buyer Journey
- Opportunity Map Analysis
- Product Life Cycle Analysis
- Supply Chain Analysis
- Investment Feasibility Matrix
- Value Chain Analysis
- PESTLE and Porter's Analysis
- Regulatory Landscape
- Regional Parent Market Outlook
- Production and Consumption Statistics
- Import and Export Statistics
- Global Market Analysis and Forecast, 2021 to 2036
- Historical Market Size Value (USD Million) Analysis, 2021 to 2025
- Current and Future Market Size Value (USD Million) Projections, 2026 to 2036
- Y-o-Y Growth Trend Analysis
- Absolute $ Opportunity Analysis
- Global Market Pricing Analysis, 2021 to 2036
- Global Market Analysis and Forecast, By Extract Format, 2021 to 2036
- Introduction / Key Findings
- Historical Market Size Value (USD Million) Analysis By Extract Format, 2021 to 2025
- Current and Future Market Size Value (USD Million) Analysis and Forecast By Extract Format, 2026 to 2036
- Standardized Rhizome and Root Powder 5% Hydrastine/Berberine
- Hydroalcoholic Liquid Tinctures and Glycerites
- Cut and Sifted Dried Root for Herbal Infusions
- Whole-Root Vegetarian Capsules and Phyto-Caps
- Y-o-Y Growth Trend Analysis By Extract Format, 2021 to 2025
- Absolute $ Opportunity Analysis By Extract Format, 2026 to 2036
- Global Market Analysis and Forecast, By Sourcing Method, 2021 to 2036
- Introduction / Key Findings
- Historical Market Size Value (USD Million) Analysis By Sourcing Method, 2021 to 2025
- Current and Future Market Size Value (USD Million) Analysis and Forecast By Sourcing Method, 2026 to 2036
- CITES-Compliant Cultivated Woodland Root
- Certified Sustainable Wild-Crafted Appalachian Root
- Artificial Shade-House Propagated Rhizomes
- Certified Organic Forest-Grown Root
- Y-o-Y Growth Trend Analysis By Sourcing Method, 2021 to 2025
- Absolute $ Opportunity Analysis By Sourcing Method, 2026 to 2036
- Global Market Analysis and Forecast, By Therapeutic Application, 2021 to 2036
- Introduction / Key Findings
- Historical Market Size Value (USD Million) Analysis By Therapeutic Application, 2021 to 2025
- Current and Future Market Size Value (USD Million) Analysis and Forecast By Therapeutic Application, 2026 to 2036
- Seasonal Immune and Echinacea-Goldenseal Combinations
- Digestive Mucosal and Berberine Metabolic Support
- Natural Antiseptic Mouthwashes and Eye Drops with Salves
- Upper-Respiratory Sinus and Throat Sprays
- Companion-Animal Mucosal and Ear-Care Drops
- Y-o-Y Growth Trend Analysis By Therapeutic Application, 2021 to 2025
- Absolute $ Opportunity Analysis By Therapeutic Application, 2026 to 2036
- Global Market Analysis and Forecast, By Patient Demographic Cohort, 2021 to 2036
- Introduction / Key Findings
- Historical Market Size Value (USD Million) Analysis By Patient Demographic Cohort, 2021 to 2025
- Current and Future Market Size Value (USD Million) Analysis and Forecast By Patient Demographic Cohort, 2026 to 2036
- Adults 18 to 64 Years
- Geriatric Population 65+ Years
- Pediatric and Neonatal Care
- Practitioner-Monitored Specialty Cohorts
- Y-o-Y Growth Trend Analysis By Patient Demographic Cohort, 2021 to 2025
- Absolute $ Opportunity Analysis By Patient Demographic Cohort, 2026 to 2036
- Global Market Analysis and Forecast, By Distribution Channel, 2021 to 2036
- Introduction / Key Findings
- Historical Market Size Value (USD Million) Analysis By Distribution Channel, 2021 to 2025
- Current and Future Market Size Value (USD Million) Analysis and Forecast By Distribution Channel, 2026 to 2036
- Retail Pharmacies and Natural Health Stores
- Direct-to-Consumer e-Commerce and Practitioner Dispensaries
- Bulk Botanical Ingredient B2B Contracts
- Integrative Medicine and Naturopathic Clinics
- Y-o-Y Growth Trend Analysis By Distribution Channel, 2021 to 2025
- Absolute $ Opportunity Analysis By Distribution Channel, 2026 to 2036
- Global Market Analysis and Forecast, By Region, 2021 to 2036
- Introduction
- Historical Market Size Value (USD Million) Analysis By Region, 2021 to 2025
- Current Market Size Value (USD Million) Analysis and Forecast By Region, 2026 to 2036
- North America
- Latin America
- Western Europe
- Eastern Europe
- East Asia
- South Asia and Pacific
- Middle East and Africa
- Market Attractiveness Analysis By Region
- North America Market Analysis and Forecast, By Country, 2021 to 2036
- Historical Market Size Value (USD Million) Trend Analysis By Market Taxonomy, 2021 to 2025
- Market Size Value (USD Million) Forecast By Market Taxonomy, 2026 to 2036
- By Country
- United States
- Canada
- By Extract Format
- By Sourcing Method
- By Therapeutic Application
- By Patient Demographic Cohort
- By Distribution Channel
- By Country
- Market Attractiveness Analysis
- By Country
- By Extract Format
- By Sourcing Method
- By Therapeutic Application
- By Patient Demographic Cohort
- By Distribution Channel
- Key Takeaways
- Latin America Market Analysis and Forecast, By Country
- Historical Market Size Value (USD Million) Trend Analysis By Market Taxonomy, 2021 to 2025
- Market Size Value (USD Million) Forecast By Market Taxonomy, 2026 to 2036
- By Country
- Brazil
- Mexico
- Argentina
- Chile
- By Extract Format
- By Sourcing Method
- By Therapeutic Application
- By Patient Demographic Cohort
- By Distribution Channel
- By Country
- Market Attractiveness Analysis
- By Country
- By Extract Format
- By Sourcing Method
- By Therapeutic Application
- By Patient Demographic Cohort
- By Distribution Channel
- Key Takeaways
- Western Europe Market Analysis and Forecast, By Country
- Historical Market Size Value (USD Million) Trend Analysis By Market Taxonomy, 2021 to 2025
- Market Size Value (USD Million) Forecast By Market Taxonomy, 2026 to 2036
- By Country
- Germany
- France
- United Kingdom
- Italy
- Spain
- Benelux
- Nordics
- By Extract Format
- By Sourcing Method
- By Therapeutic Application
- By Patient Demographic Cohort
- By Distribution Channel
- By Country
- Market Attractiveness Analysis
- By Country
- By Extract Format
- By Sourcing Method
- By Therapeutic Application
- By Patient Demographic Cohort
- By Distribution Channel
- Key Takeaways
- Eastern Europe Market Analysis and Forecast, By Country
- Historical Market Size Value (USD Million) Trend Analysis By Market Taxonomy, 2021 to 2025
- Market Size Value (USD Million) Forecast By Market Taxonomy, 2026 to 2036
- By Country
- Poland
- Czech Republic
- Romania
- Hungary
- By Extract Format
- By Sourcing Method
- By Therapeutic Application
- By Patient Demographic Cohort
- By Distribution Channel
- By Country
- Market Attractiveness Analysis
- By Country
- By Extract Format
- By Sourcing Method
- By Therapeutic Application
- By Patient Demographic Cohort
- By Distribution Channel
- Key Takeaways
- East Asia Market Analysis and Forecast, By Country
- Historical Market Size Value (USD Million) Trend Analysis By Market Taxonomy, 2021 to 2025
- Market Size Value (USD Million) Forecast By Market Taxonomy, 2026 to 2036
- By Country
- China
- Japan
- South Korea
- By Extract Format
- By Sourcing Method
- By Therapeutic Application
- By Patient Demographic Cohort
- By Distribution Channel
- By Country
- Market Attractiveness Analysis
- By Country
- By Extract Format
- By Sourcing Method
- By Therapeutic Application
- By Patient Demographic Cohort
- By Distribution Channel
- Key Takeaways
- South Asia and Pacific Market Analysis and Forecast, By Country
- Historical Market Size Value (USD Million) Trend Analysis By Market Taxonomy, 2021 to 2025
- Market Size Value (USD Million) Forecast By Market Taxonomy, 2026 to 2036
- By Country
- India
- ASEAN
- Australia and New Zealand
- By Extract Format
- By Sourcing Method
- By Therapeutic Application
- By Patient Demographic Cohort
- By Distribution Channel
- By Country
- Market Attractiveness Analysis
- By Country
- By Extract Format
- By Sourcing Method
- By Therapeutic Application
- By Patient Demographic Cohort
- By Distribution Channel
- Key Takeaways
- Middle East and Africa Market Analysis and Forecast, By Country
- Historical Market Size Value (USD Million) Trend Analysis By Market Taxonomy, 2021 to 2025
- Market Size Value (USD Million) Forecast By Market Taxonomy, 2026 to 2036
- By Country
- GCC Countries
- South Africa
- Türkiye
- Israel
- By Extract Format
- By Sourcing Method
- By Therapeutic Application
- By Patient Demographic Cohort
- By Distribution Channel
- By Country
- Market Attractiveness Analysis
- By Country
- By Extract Format
- By Sourcing Method
- By Therapeutic Application
- By Patient Demographic Cohort
- By Distribution Channel
- Key Takeaways
- Key Countries Market Analysis
- United States
- Pricing Analysis
- Market Share Analysis, 2025
- By Extract Format
- By Sourcing Method
- By Therapeutic Application
- By Patient Demographic Cohort
- By Distribution Channel
- Canada
- Pricing Analysis
- Market Share Analysis, 2025
- By Extract Format
- By Sourcing Method
- By Therapeutic Application
- By Patient Demographic Cohort
- By Distribution Channel
- Mexico
- Pricing Analysis
- Market Share Analysis, 2025
- By Extract Format
- By Sourcing Method
- By Therapeutic Application
- By Patient Demographic Cohort
- By Distribution Channel
- Brazil
- Pricing Analysis
- Market Share Analysis, 2025
- By Extract Format
- By Sourcing Method
- By Therapeutic Application
- By Patient Demographic Cohort
- By Distribution Channel
- Chile
- Pricing Analysis
- Market Share Analysis, 2025
- By Extract Format
- By Sourcing Method
- By Therapeutic Application
- By Patient Demographic Cohort
- By Distribution Channel
- Germany
- Pricing Analysis
- Market Share Analysis, 2025
- By Extract Format
- By Sourcing Method
- By Therapeutic Application
- By Patient Demographic Cohort
- By Distribution Channel
- United Kingdom
- Pricing Analysis
- Market Share Analysis, 2025
- By Extract Format
- By Sourcing Method
- By Therapeutic Application
- By Patient Demographic Cohort
- By Distribution Channel
- Italy
- Pricing Analysis
- Market Share Analysis, 2025
- By Extract Format
- By Sourcing Method
- By Therapeutic Application
- By Patient Demographic Cohort
- By Distribution Channel
- Spain
- Pricing Analysis
- Market Share Analysis, 2025
- By Extract Format
- By Sourcing Method
- By Therapeutic Application
- By Patient Demographic Cohort
- By Distribution Channel
- France
- Pricing Analysis
- Market Share Analysis, 2025
- By Extract Format
- By Sourcing Method
- By Therapeutic Application
- By Patient Demographic Cohort
- By Distribution Channel
- India
- Pricing Analysis
- Market Share Analysis, 2025
- By Extract Format
- By Sourcing Method
- By Therapeutic Application
- By Patient Demographic Cohort
- By Distribution Channel
- ASEAN
- Pricing Analysis
- Market Share Analysis, 2025
- By Extract Format
- By Sourcing Method
- By Therapeutic Application
- By Patient Demographic Cohort
- By Distribution Channel
- Australia and New Zealand
- Pricing Analysis
- Market Share Analysis, 2025
- By Extract Format
- By Sourcing Method
- By Therapeutic Application
- By Patient Demographic Cohort
- By Distribution Channel
- China
- Pricing Analysis
- Market Share Analysis, 2025
- By Extract Format
- By Sourcing Method
- By Therapeutic Application
- By Patient Demographic Cohort
- By Distribution Channel
- Japan
- Pricing Analysis
- Market Share Analysis, 2025
- By Extract Format
- By Sourcing Method
- By Therapeutic Application
- By Patient Demographic Cohort
- By Distribution Channel
- South Korea
- Pricing Analysis
- Market Share Analysis, 2025
- By Extract Format
- By Sourcing Method
- By Therapeutic Application
- By Patient Demographic Cohort
- By Distribution Channel
- Poland
- Pricing Analysis
- Market Share Analysis, 2025
- By Extract Format
- By Sourcing Method
- By Therapeutic Application
- By Patient Demographic Cohort
- By Distribution Channel
- Hungary
- Pricing Analysis
- Market Share Analysis, 2025
- By Extract Format
- By Sourcing Method
- By Therapeutic Application
- By Patient Demographic Cohort
- By Distribution Channel
- Türkiye
- Pricing Analysis
- Market Share Analysis, 2025
- By Extract Format
- By Sourcing Method
- By Therapeutic Application
- By Patient Demographic Cohort
- By Distribution Channel
- South Africa
- Pricing Analysis
- Market Share Analysis, 2025
- By Extract Format
- By Sourcing Method
- By Therapeutic Application
- By Patient Demographic Cohort
- By Distribution Channel
- Australia
- Pricing Analysis
- Market Share Analysis, 2025
- By Extract Format
- By Sourcing Method
- By Therapeutic Application
- By Patient Demographic Cohort
- By Distribution Channel
- United States
- Market Structure Analysis
- Competition Dashboard
- Competition Benchmarking
- Market Share Analysis of Top Players
- By Regional
- By Extract Format
- By Sourcing Method
- By Therapeutic Application
- By Patient Demographic Cohort
- By Distribution Channel
- Emerging Startups
- Innovation Benchmarking
- Competition Analysis
- Competition Deep Dive
- Nature's Way Brands, LLC
- Overview
- Product Portfolio
- Profitability by Market Segments
- Sales Footprint
- Strategy Overview
- Marketing Strategy
- Product Strategy
- Channel Strategy
- Gaia Herbs, Inc.
- NOW Health Group, Inc.
- Solaray (Better Being Co.)
- Herb Pharm LLC
- Oregon's Wild Harvest
- Thorne HealthTech, Inc.
- Swanson Health Products
- Bio-Botanica, Inc.
- Indena S.p.A.
- Solaray (Nutraceutical Corp / Better Being Co.)
- Nature's Way Brands, LLC
- Case Studies
- Success Stories
- Recent Developments
- Competition Deep Dive
- Assumptions & Acronyms Used
List of Tables
- Table 1: Global Market Value (USD Million) Forecast by Region, 2021 to 2036
- Table 2: Global Market Value (USD Million) Forecast by Extract Format, 2021 to 2036
- Table 3: Global Market Value (USD Million) Forecast by Sourcing Method, 2021 to 2036
- Table 4: Global Market Value (USD Million) Forecast by Therapeutic Application, 2021 to 2036
- Table 5: Global Market Value (USD Million) Forecast by Patient Demographic Cohort, 2021 to 2036
- Table 6: Global Market Value (USD Million) Forecast by Distribution Channel, 2021 to 2036
- Table 7: North America Market Value (USD Million) Forecast by Country, 2021 to 2036
- Table 8: North America Market Value (USD Million) Forecast by Extract Format, 2021 to 2036
- Table 9: North America Market Value (USD Million) Forecast by Sourcing Method, 2021 to 2036
- Table 10: North America Market Value (USD Million) Forecast by Therapeutic Application, 2021 to 2036
- Table 11: North America Market Value (USD Million) Forecast by Patient Demographic Cohort, 2021 to 2036
- Table 12: North America Market Value (USD Million) Forecast by Distribution Channel, 2021 to 2036
- Table 13: Latin America Market Value (USD Million) Forecast by Country, 2021 to 2036
- Table 14: Latin America Market Value (USD Million) Forecast by Extract Format, 2021 to 2036
- Table 15: Latin America Market Value (USD Million) Forecast by Sourcing Method, 2021 to 2036
- Table 16: Latin America Market Value (USD Million) Forecast by Therapeutic Application, 2021 to 2036
- Table 17: Latin America Market Value (USD Million) Forecast by Patient Demographic Cohort, 2021 to 2036
- Table 18: Latin America Market Value (USD Million) Forecast by Distribution Channel, 2021 to 2036
- Table 19: Western Europe Market Value (USD Million) Forecast by Country, 2021 to 2036
- Table 20: Western Europe Market Value (USD Million) Forecast by Extract Format, 2021 to 2036
- Table 21: Western Europe Market Value (USD Million) Forecast by Sourcing Method, 2021 to 2036
- Table 22: Western Europe Market Value (USD Million) Forecast by Therapeutic Application, 2021 to 2036
- Table 23: Western Europe Market Value (USD Million) Forecast by Patient Demographic Cohort, 2021 to 2036
- Table 24: Western Europe Market Value (USD Million) Forecast by Distribution Channel, 2021 to 2036
- Table 25: Eastern Europe Market Value (USD Million) Forecast by Country, 2021 to 2036
- Table 26: Eastern Europe Market Value (USD Million) Forecast by Extract Format, 2021 to 2036
- Table 27: Eastern Europe Market Value (USD Million) Forecast by Sourcing Method, 2021 to 2036
- Table 28: Eastern Europe Market Value (USD Million) Forecast by Therapeutic Application, 2021 to 2036
- Table 29: Eastern Europe Market Value (USD Million) Forecast by Patient Demographic Cohort, 2021 to 2036
- Table 30: Eastern Europe Market Value (USD Million) Forecast by Distribution Channel, 2021 to 2036
- Table 31: East Asia Market Value (USD Million) Forecast by Country, 2021 to 2036
- Table 32: East Asia Market Value (USD Million) Forecast by Extract Format, 2021 to 2036
- Table 33: East Asia Market Value (USD Million) Forecast by Sourcing Method, 2021 to 2036
- Table 34: East Asia Market Value (USD Million) Forecast by Therapeutic Application, 2021 to 2036
- Table 35: East Asia Market Value (USD Million) Forecast by Patient Demographic Cohort, 2021 to 2036
- Table 36: East Asia Market Value (USD Million) Forecast by Distribution Channel, 2021 to 2036
- Table 37: South Asia and Pacific Market Value (USD Million) Forecast by Country, 2021 to 2036
- Table 38: South Asia and Pacific Market Value (USD Million) Forecast by Extract Format, 2021 to 2036
- Table 39: South Asia and Pacific Market Value (USD Million) Forecast by Sourcing Method, 2021 to 2036
- Table 40: South Asia and Pacific Market Value (USD Million) Forecast by Therapeutic Application, 2021 to 2036
- Table 41: South Asia and Pacific Market Value (USD Million) Forecast by Patient Demographic Cohort, 2021 to 2036
- Table 42: South Asia and Pacific Market Value (USD Million) Forecast by Distribution Channel, 2021 to 2036
- Table 43: Middle East and Africa Market Value (USD Million) Forecast by Country, 2021 to 2036
- Table 44: Middle East and Africa Market Value (USD Million) Forecast by Extract Format, 2021 to 2036
- Table 45: Middle East and Africa Market Value (USD Million) Forecast by Sourcing Method, 2021 to 2036
- Table 46: Middle East and Africa Market Value (USD Million) Forecast by Therapeutic Application, 2021 to 2036
- Table 47: Middle East and Africa Market Value (USD Million) Forecast by Patient Demographic Cohort, 2021 to 2036
- Table 48: Middle East and Africa Market Value (USD Million) Forecast by Distribution Channel, 2021 to 2036
List of Figures
- Figure 1: Global Market Pricing Analysis
- Figure 2: Global Market Value (USD Million) Forecast 2021-2036
- Figure 3: Global Market Value Share and BPS Analysis by Extract Format, 2026 and 2036
- Figure 4: Global Market Y-o-Y Growth Comparison by Extract Format, 2026-2036
- Figure 5: Global Market Attractiveness Analysis by Extract Format
- Figure 6: Global Market Value Share and BPS Analysis by Sourcing Method, 2026 and 2036
- Figure 7: Global Market Y-o-Y Growth Comparison by Sourcing Method, 2026-2036
- Figure 8: Global Market Attractiveness Analysis by Sourcing Method
- Figure 9: Global Market Value Share and BPS Analysis by Therapeutic Application, 2026 and 2036
- Figure 10: Global Market Y-o-Y Growth Comparison by Therapeutic Application, 2026-2036
- Figure 11: Global Market Attractiveness Analysis by Therapeutic Application
- Figure 12: Global Market Value Share and BPS Analysis by Patient Demographic Cohort, 2026 and 2036
- Figure 13: Global Market Y-o-Y Growth Comparison by Patient Demographic Cohort, 2026-2036
- Figure 14: Global Market Attractiveness Analysis by Patient Demographic Cohort
- Figure 15: Global Market Value Share and BPS Analysis by Distribution Channel, 2026 and 2036
- Figure 16: Global Market Y-o-Y Growth Comparison by Distribution Channel, 2026-2036
- Figure 17: Global Market Attractiveness Analysis by Distribution Channel
- Figure 18: Global Market Value (USD Million) Share and BPS Analysis by Region, 2026 and 2036
- Figure 19: Global Market Y-o-Y Growth Comparison by Region, 2026-2036
- Figure 20: Global Market Attractiveness Analysis by Region
- Figure 21: North America Market Incremental Dollar Opportunity, 2026-2036
- Figure 22: Latin America Market Incremental Dollar Opportunity, 2026-2036
- Figure 23: Western Europe Market Incremental Dollar Opportunity, 2026-2036
- Figure 24: Eastern Europe Market Incremental Dollar Opportunity, 2026-2036
- Figure 25: East Asia Market Incremental Dollar Opportunity, 2026-2036
- Figure 26: South Asia and Pacific Market Incremental Dollar Opportunity, 2026-2036
- Figure 27: Middle East and Africa Market Incremental Dollar Opportunity, 2026-2036
- Figure 28: North America Market Value Share and BPS Analysis by Country, 2026 and 2036
- Figure 29: North America Market Value Share and BPS Analysis by Extract Format, 2026 and 2036
- Figure 30: North America Market Y-o-Y Growth Comparison by Extract Format, 2026-2036
- Figure 31: North America Market Attractiveness Analysis by Extract Format
- Figure 32: North America Market Value Share and BPS Analysis by Sourcing Method, 2026 and 2036
- Figure 33: North America Market Y-o-Y Growth Comparison by Sourcing Method, 2026-2036
- Figure 34: North America Market Attractiveness Analysis by Sourcing Method
- Figure 35: North America Market Value Share and BPS Analysis by Therapeutic Application, 2026 and 2036
- Figure 36: North America Market Y-o-Y Growth Comparison by Therapeutic Application, 2026-2036
- Figure 37: North America Market Attractiveness Analysis by Therapeutic Application
- Figure 38: North America Market Value Share and BPS Analysis by Patient Demographic Cohort, 2026 and 2036
- Figure 39: North America Market Y-o-Y Growth Comparison by Patient Demographic Cohort, 2026-2036
- Figure 40: North America Market Attractiveness Analysis by Patient Demographic Cohort
- Figure 41: North America Market Value Share and BPS Analysis by Distribution Channel, 2026 and 2036
- Figure 42: North America Market Y-o-Y Growth Comparison by Distribution Channel, 2026-2036
- Figure 43: North America Market Attractiveness Analysis by Distribution Channel
- Figure 44: Latin America Market Value Share and BPS Analysis by Country, 2026 and 2036
- Figure 45: Latin America Market Value Share and BPS Analysis by Extract Format, 2026 and 2036
- Figure 46: Latin America Market Y-o-Y Growth Comparison by Extract Format, 2026-2036
- Figure 47: Latin America Market Attractiveness Analysis by Extract Format
- Figure 48: Latin America Market Value Share and BPS Analysis by Sourcing Method, 2026 and 2036
- Figure 49: Latin America Market Y-o-Y Growth Comparison by Sourcing Method, 2026-2036
- Figure 50: Latin America Market Attractiveness Analysis by Sourcing Method
- Figure 51: Latin America Market Value Share and BPS Analysis by Therapeutic Application, 2026 and 2036
- Figure 52: Latin America Market Y-o-Y Growth Comparison by Therapeutic Application, 2026-2036
- Figure 53: Latin America Market Attractiveness Analysis by Therapeutic Application
- Figure 54: Latin America Market Value Share and BPS Analysis by Patient Demographic Cohort, 2026 and 2036
- Figure 55: Latin America Market Y-o-Y Growth Comparison by Patient Demographic Cohort, 2026-2036
- Figure 56: Latin America Market Attractiveness Analysis by Patient Demographic Cohort
- Figure 57: Latin America Market Value Share and BPS Analysis by Distribution Channel, 2026 and 2036
- Figure 58: Latin America Market Y-o-Y Growth Comparison by Distribution Channel, 2026-2036
- Figure 59: Latin America Market Attractiveness Analysis by Distribution Channel
- Figure 60: Western Europe Market Value Share and BPS Analysis by Country, 2026 and 2036
- Figure 61: Western Europe Market Value Share and BPS Analysis by Extract Format, 2026 and 2036
- Figure 62: Western Europe Market Y-o-Y Growth Comparison by Extract Format, 2026-2036
- Figure 63: Western Europe Market Attractiveness Analysis by Extract Format
- Figure 64: Western Europe Market Value Share and BPS Analysis by Sourcing Method, 2026 and 2036
- Figure 65: Western Europe Market Y-o-Y Growth Comparison by Sourcing Method, 2026-2036
- Figure 66: Western Europe Market Attractiveness Analysis by Sourcing Method
- Figure 67: Western Europe Market Value Share and BPS Analysis by Therapeutic Application, 2026 and 2036
- Figure 68: Western Europe Market Y-o-Y Growth Comparison by Therapeutic Application, 2026-2036
- Figure 69: Western Europe Market Attractiveness Analysis by Therapeutic Application
- Figure 70: Western Europe Market Value Share and BPS Analysis by Patient Demographic Cohort, 2026 and 2036
- Figure 71: Western Europe Market Y-o-Y Growth Comparison by Patient Demographic Cohort, 2026-2036
- Figure 72: Western Europe Market Attractiveness Analysis by Patient Demographic Cohort
- Figure 73: Western Europe Market Value Share and BPS Analysis by Distribution Channel, 2026 and 2036
- Figure 74: Western Europe Market Y-o-Y Growth Comparison by Distribution Channel, 2026-2036
- Figure 75: Western Europe Market Attractiveness Analysis by Distribution Channel
- Figure 76: Eastern Europe Market Value Share and BPS Analysis by Country, 2026 and 2036
- Figure 77: Eastern Europe Market Value Share and BPS Analysis by Extract Format, 2026 and 2036
- Figure 78: Eastern Europe Market Y-o-Y Growth Comparison by Extract Format, 2026-2036
- Figure 79: Eastern Europe Market Attractiveness Analysis by Extract Format
- Figure 80: Eastern Europe Market Value Share and BPS Analysis by Sourcing Method, 2026 and 2036
- Figure 81: Eastern Europe Market Y-o-Y Growth Comparison by Sourcing Method, 2026-2036
- Figure 82: Eastern Europe Market Attractiveness Analysis by Sourcing Method
- Figure 83: Eastern Europe Market Value Share and BPS Analysis by Therapeutic Application, 2026 and 2036
- Figure 84: Eastern Europe Market Y-o-Y Growth Comparison by Therapeutic Application, 2026-2036
- Figure 85: Eastern Europe Market Attractiveness Analysis by Therapeutic Application
- Figure 86: Eastern Europe Market Value Share and BPS Analysis by Patient Demographic Cohort, 2026 and 2036
- Figure 87: Eastern Europe Market Y-o-Y Growth Comparison by Patient Demographic Cohort, 2026-2036
- Figure 88: Eastern Europe Market Attractiveness Analysis by Patient Demographic Cohort
- Figure 89: Eastern Europe Market Value Share and BPS Analysis by Distribution Channel, 2026 and 2036
- Figure 90: Eastern Europe Market Y-o-Y Growth Comparison by Distribution Channel, 2026-2036
- Figure 91: Eastern Europe Market Attractiveness Analysis by Distribution Channel
- Figure 92: East Asia Market Value Share and BPS Analysis by Country, 2026 and 2036
- Figure 93: East Asia Market Value Share and BPS Analysis by Extract Format, 2026 and 2036
- Figure 94: East Asia Market Y-o-Y Growth Comparison by Extract Format, 2026-2036
- Figure 95: East Asia Market Attractiveness Analysis by Extract Format
- Figure 96: East Asia Market Value Share and BPS Analysis by Sourcing Method, 2026 and 2036
- Figure 97: East Asia Market Y-o-Y Growth Comparison by Sourcing Method, 2026-2036
- Figure 98: East Asia Market Attractiveness Analysis by Sourcing Method
- Figure 99: East Asia Market Value Share and BPS Analysis by Therapeutic Application, 2026 and 2036
- Figure 100: East Asia Market Y-o-Y Growth Comparison by Therapeutic Application, 2026-2036
- Figure 101: East Asia Market Attractiveness Analysis by Therapeutic Application
- Figure 102: East Asia Market Value Share and BPS Analysis by Patient Demographic Cohort, 2026 and 2036
- Figure 103: East Asia Market Y-o-Y Growth Comparison by Patient Demographic Cohort, 2026-2036
- Figure 104: East Asia Market Attractiveness Analysis by Patient Demographic Cohort
- Figure 105: East Asia Market Value Share and BPS Analysis by Distribution Channel, 2026 and 2036
- Figure 106: East Asia Market Y-o-Y Growth Comparison by Distribution Channel, 2026-2036
- Figure 107: East Asia Market Attractiveness Analysis by Distribution Channel
- Figure 108: South Asia and Pacific Market Value Share and BPS Analysis by Country, 2026 and 2036
- Figure 109: South Asia and Pacific Market Value Share and BPS Analysis by Extract Format, 2026 and 2036
- Figure 110: South Asia and Pacific Market Y-o-Y Growth Comparison by Extract Format, 2026-2036
- Figure 111: South Asia and Pacific Market Attractiveness Analysis by Extract Format
- Figure 112: South Asia and Pacific Market Value Share and BPS Analysis by Sourcing Method, 2026 and 2036
- Figure 113: South Asia and Pacific Market Y-o-Y Growth Comparison by Sourcing Method, 2026-2036
- Figure 114: South Asia and Pacific Market Attractiveness Analysis by Sourcing Method
- Figure 115: South Asia and Pacific Market Value Share and BPS Analysis by Therapeutic Application, 2026 and 2036
- Figure 116: South Asia and Pacific Market Y-o-Y Growth Comparison by Therapeutic Application, 2026-2036
- Figure 117: South Asia and Pacific Market Attractiveness Analysis by Therapeutic Application
- Figure 118: South Asia and Pacific Market Value Share and BPS Analysis by Patient Demographic Cohort, 2026 and 2036
- Figure 119: South Asia and Pacific Market Y-o-Y Growth Comparison by Patient Demographic Cohort, 2026-2036
- Figure 120: South Asia and Pacific Market Attractiveness Analysis by Patient Demographic Cohort
- Figure 121: South Asia and Pacific Market Value Share and BPS Analysis by Distribution Channel, 2026 and 2036
- Figure 122: South Asia and Pacific Market Y-o-Y Growth Comparison by Distribution Channel, 2026-2036
- Figure 123: South Asia and Pacific Market Attractiveness Analysis by Distribution Channel
- Figure 124: Middle East and Africa Market Value Share and BPS Analysis by Country, 2026 and 2036
- Figure 125: Middle East and Africa Market Value Share and BPS Analysis by Extract Format, 2026 and 2036
- Figure 126: Middle East and Africa Market Y-o-Y Growth Comparison by Extract Format, 2026-2036
- Figure 127: Middle East and Africa Market Attractiveness Analysis by Extract Format
- Figure 128: Middle East and Africa Market Value Share and BPS Analysis by Sourcing Method, 2026 and 2036
- Figure 129: Middle East and Africa Market Y-o-Y Growth Comparison by Sourcing Method, 2026-2036
- Figure 130: Middle East and Africa Market Attractiveness Analysis by Sourcing Method
- Figure 131: Middle East and Africa Market Value Share and BPS Analysis by Therapeutic Application, 2026 and 2036
- Figure 132: Middle East and Africa Market Y-o-Y Growth Comparison by Therapeutic Application, 2026-2036
- Figure 133: Middle East and Africa Market Attractiveness Analysis by Therapeutic Application
- Figure 134: Middle East and Africa Market Value Share and BPS Analysis by Patient Demographic Cohort, 2026 and 2036
- Figure 135: Middle East and Africa Market Y-o-Y Growth Comparison by Patient Demographic Cohort, 2026-2036
- Figure 136: Middle East and Africa Market Attractiveness Analysis by Patient Demographic Cohort
- Figure 137: Middle East and Africa Market Value Share and BPS Analysis by Distribution Channel, 2026 and 2036
- Figure 138: Middle East and Africa Market Y-o-Y Growth Comparison by Distribution Channel, 2026-2036
- Figure 139: Middle East and Africa Market Attractiveness Analysis by Distribution Channel
- Figure 140: Global Market - Tier Structure Analysis
- Figure 141: Global Market - Company Share Analysis
Frequently Asked Questions
How big is the goldenseal market in 2026 and what is forecast for 2036?
Global goldenseal market valuation rose from USD 124.8 million in 2025 to USD 132.4 million in 2026. Sector size is projected to attain USD 239.4 million by 2036 as herbal brands scale CITES-certified woodland cultivation and HPLC-standardized capsules.
What is the CAGR for the goldenseal market from 2026 to 2036?
Goldenseal demand is forecast to progress at a 6.1% compound annual rate between 2026 and 2036, generating USD 107.0 million in added value across the decade.
Which extract format segment leads the goldenseal market?
Standardized Rhizome and Root Powder 5% Hydrastine/Berberine holds 55.4% of extract format demand in 2026 because USP high-performance liquid chromatography standardization guarantees alkaloid potency and prevents Coptis adulteration.
Which sourcing method segment leads the goldenseal market?
CITES-Compliant Cultivated Woodland Root represents 71.8% of the sourcing method category in 2026 as multi-year shade-house and woodland farming replaces imperiled wild Appalachian digging.
Which country has a notable growth outlook during the assessment period?
Australia paces country-level goldenseal growth at a 6.4% CAGR to 2036, driven by naturopathic practitioner liquid tincture dispensing and TGA listed-medicine quality assurance.
Who are the key players in the market?
Nature's Way Brands LLC and Gaia Herbs Inc. with NOW Health Group Inc. and Solaray plus Herb Pharm LLC lead retail and practitioner supply. Oregon's Wild Harvest and Thorne HealthTech Inc. with Swanson Health Products plus Bio-Botanica Inc. and Indena S.p.A. also lead the market.
Preview the report firsthand - request a free sample
Get SampleGet the brochure for pricing and purchase details.
Get PDF
