

- Market Size (2026)
- USD 1560.0 Mn
- Forecast (2036)
- USD 3527.1 Mn
- CAGR (2026 to 2036)
- 8.5%
How big is the Immune Digestive Support Market in 2026?
USD 1,560.0 million in 2026 and USD 3,527.1 million by 2036 at an 8.5% CAGR.
Targeted wellness buying is moving immune and digestive products from broad claims into documented daily-use supplement programs. National Center for Health Statistics reported that 60.2% of United States adults used dietary supplements during August 2021-August 2023, which is expected to sharpen scrutiny of dosage clarity and ingredient evidence. Buyers are expected to use immune digestive support products to connect benefit language to repeat purchase and quality review.
Supplement brands and contract manufacturers are expected to treat the category as a launch-risk control purchase. Pharmacy chains and digital retailers are likely to ask for cleaner product files before listing approval. FDA updated its new dietary ingredient notification process in June 2025, reinforcing how ingredient records influence product readiness. Buyers gain from dietary supplement formats that connect formulation support to label review and batch consistency.
Product value is expected to rise in programs linking immune ingredients to gut-support positioning and dosage-form stability. Claims files and channel service are expected to form one commercial system for brand teams managing audited launches. Established markets are projected to weight audit records and repeat manufacturing performance during supplier review. Higher-growth markets are likely to prioritize access and channel scale during first-stage distributor qualification. Supply planning teams comparing digestive health supplements are expected to favor partners that reduce technical handoffs before launch risk spreads across buyer teams.
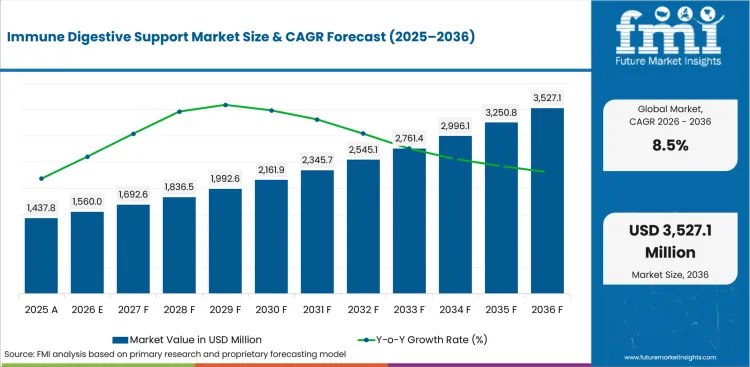
| Metric | Value |
|---|---|
| 2025 Market Size | USD 1,437.8 million |
| 2026 Market Size | USD 1,560.0 million |
| 2036 Market Size | USD 3,527.1 million |
| Forecast CAGR (2026-2036) | 8.5% |
| Leading Form | Capsules |
| Capsules Share (2026) | 37.0% |
| Leading Source | Plant-based |
| Plant-based Share (2026) | 34.5% |
| Leading Health Benefit | Immunity |
| Immunity Share (2026) | 41.0% |
| Key Countries | USA, Germany, France, UK |
Summary of the Immune Digestive Support Market
| Market Signal | Commercial Impact |
|---|---|
| Demand and Growth Drivers | Targeted wellness positioning is expected to push spending toward documented immune and gut-support products. Documentation pressure is likely to create urgency before brands approve broader channel launches across retail accounts.
|
| Product and Segment View | Capsules, plant-based inputs and immunity are expected to carry the leading 2026 positions across their categories. E-commerce is likely to add channel strength due to replenishment and subscription program expansion.
|
| Geography and Growth Outlook | India and China are expected to show higher category conversion due to digital commerce and targeted wellness adoption. The United States and South Korea are likely to grow due to pharmacy access and repeat online purchasing.
|
| Competitive Landscape | Competition is expected to focus on dosage-form support and channel-ready documentation across branded and contract manufacturing accounts. Suppliers offering stronger technical service are likely to receive earlier trial access in contract manufacturing accounts.
|
| Analyst Perspective | Evidence quality tied to dosage stability and channel review is expected to shape adoption more than broad wellness language. Suppliers are likely to retain accounts by reducing documentation gaps before launch and channel listing review.
|
Source: FMI's proprietary forecasting model and primary research
How is the Immune Digestive Support Market segmented?
The immune digestive support market is segmented by form, source, health benefit, distribution channel, and region.
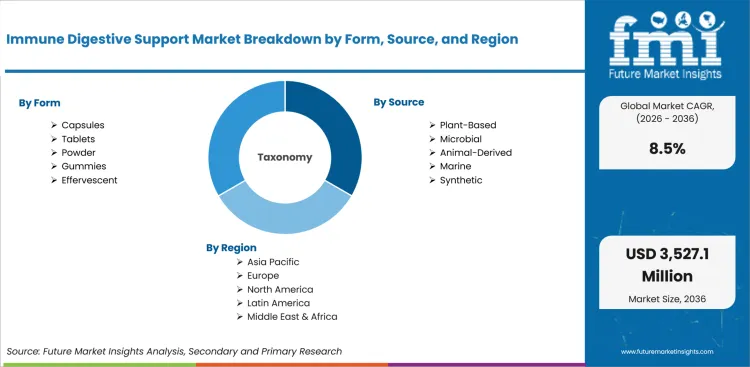
The immune digestive support market is segmented by form, source, health benefit, distribution channel, and region. By form, the market covers tablets, capsules, powder, gummies, and effervescent formats used during brand launch planning. By source, it covers plant-based, microbial, animal-derived, marine, and synthetic inputs that shape traceability review. By health benefit, it covers gut health, immunity, metabolic health, hormonal health, and energy and vitality. By distribution channel, it covers pharmacies, e-commerce, health and specialty stores, supermarkets, and direct sales. Regional coverage includes North America, Latin America, Europe, East Asia, South Asia and Pacific, and Middle East and Africa linked to broader food supplement and nutrition demand.
How do capsules shape demand within the form category?
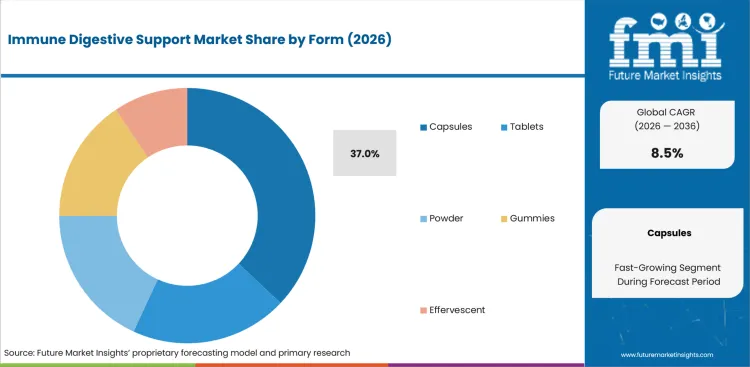
Form selection is likely to influence manufacturing risk before a brand approves broader production. Capsule formats carry Sourcing prioritize due to dosing familiarity and line compatibility across contract manufacturing lines. Lonza launched an organic pullulan capsule solution in October 2025, pointing to buyer interest in cleaner capsule claims and audited shell records. Capsule suppliers therefore need performance evidence and manufacturing support before brands approve broader commercial runs.
- Capsules are expected to account for 37.0% of form demand in 2026, supported by production familiarity and supplier documentation. FDA guidance states that new dietary ingredient notifications must be submitted at least 75 days before interstate commerce. The timeline reinforces why capsule buyers need complete formulation files before scale-up and audited purchase approval.
- The executive case for capsules centers on lower launch friction: brands gain a familiar delivery format that simplifies filling trials and consumer instructions. Capsule programs also support dietary supplement packaging decisions, which helps quality control teams compare shell behavior and ingredient compatibility before commercial orders.
What supports demand for plant-based source choices?
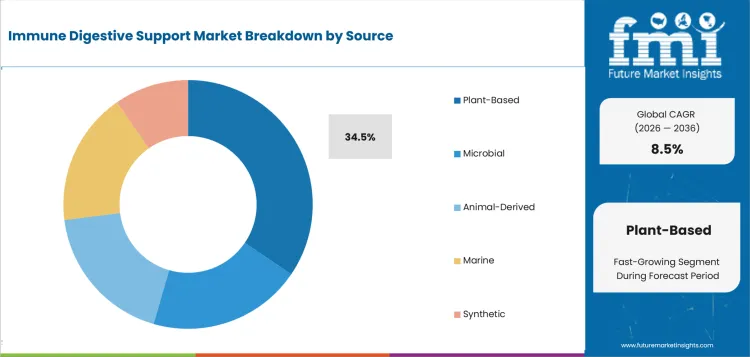
Source decisions are poised to shape buyer trust before a label reaches pharmacy or online shelves. Plant-based inputs fit vegan briefs and allergen-sensitive positioning across daily supplement lines aimed at routine wellness use. Clean-label claims are expected to add another procurement screen during supplier qualification for pharmacy and digital channels. Sourcing teams need traceability and reliable batch behavior before formulation changes move into commercial immune digestive products.
- Plant-based is projected to hold 34.5% of source demand in 2026, driven by traceability needs and broader botanical positioning. IFF announced a Vitafoods Europe 2025 program for plant-based dietary supplement ingredients and technical expertise. Supplier activity shows why source diversity is becoming a sourcing issue for supplement makers.
- Brand teams in consumer nutrition gain from plant-based inputs due to cleaner label alignment and wider dietary-fit messaging. The buying decision remains practical due to proof needs for solubility and taste interaction before broader sourcing. Suppliers serving vegan vitamins and supplements need batch consistency before teams extend the source into more commercial SKUs.
How do buyers evaluate immunity within the health benefit category?
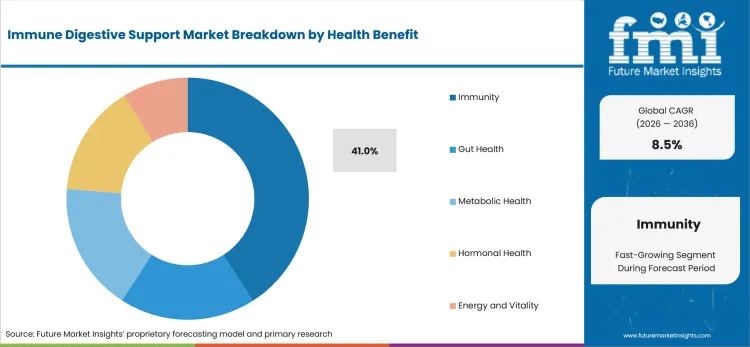
Health benefit selection is anticipated to influence claims review and product evidence more than broad wellness positioning. Immunity creates a narrow promise that must fit ingredient files and dosage rules before claims reach shoppers. Kerry published immune-health format guidance in March 2026, showing how benefit positioning is moving into everyday nutrition concepts. Evidence language is therefore expected to become a higher review hurdle for supplement launches.
- Immunity is anticipated to represent 41.0% of health benefit demand in 2026, attributable to targeted consumer familiarity and claim review discipline. Kerry described Wellmune as a yeast beta-glucan postbiotic in March 2026 for immune-positioned formats. The ingredient example supports clearer immune-positioned products that avoid overstated benefit language during claims review.
- For product managers, immunity reduces launch ambiguity due to a defined benefit area and repeat-use reasoning. The segment raises evidence work due to ingredient rationale and dosage-form stability needs before launch approval. Internal reviewers comparing probiotic supplements are expected to require those files before approving consumer-facing claims.
How is e-commerce positioned within distribution channel decisions?
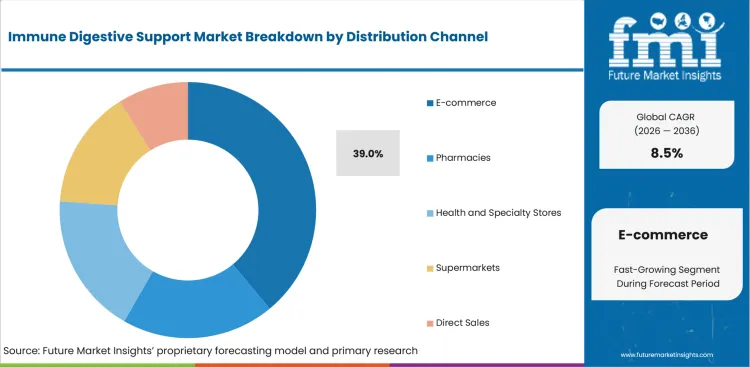
Channel selection is likely to alter the evidence burden for supplement brands before launch. E-commerce listings expose labels and dosage instructions to rapid comparison across retail platforms before shoppers commit. Benefit claims receive sharper public scrutiny on digital shelves than in slower pharmacy cycles. Supplier support therefore needs content accuracy and packaging consistency for digital product files across every listing cycle.
- E-commerce is estimated to account for 39.0% of distribution channel demand in 2026, due to faster replenishment and subscription planning. Eurostat reported that 78% of European Union internet users bought online in 2025 across digital channels. Digital access explains why supplement vendors need channel-ready label files before online rollout and repeat replenishment.
- The buying decision for e-commerce is about trust at speed: digital channels require accurate claims text and stable product pages. Brands using gummy supplements are expected to prefer suppliers supporting consistent imagery and supplement facts. Batch documents also need alignment across marketplace and retailer systems before commercial product pages go live.
What are the drivers, restraints, and opportunities in the Immune Digestive Support Market?
Near-term purchases are being shaped by claim documentation, formulation stability, and channel expansion route outlined below for brand programs.
- Driver: Targeted consumer-health positioning is expected to push spending toward supplement formats that support dosage clarity and documented benefit language.
- Restraint: Weak claims evidence is anticipated to delay supplier approval in accounts needing batch files and launch-ready label support.
- Opportunity: Capsule and gummy formats are projected to create extension routes for brands seeking cleaner consumer instructions.
Brand teams are expected to increase buying activity if supplement briefs connect benefit claims to stable production. Glanbia published its functional nutrition outlook for 2026 and beyond in December 2025, pointing to transparency and sensory fit across nutrition launches. Supplier teams that translate documentation needs into production tasks are likely to gain trial access before broader contracts.
The compliance teams are likely to slow adoption in accounts lacking clear ownership across formulation and claims. Packaging control also needs a named owner before rollout begins across pharmacy and online accounts. FDA published a January 2026 warning letter describing serious manufacturing-control concerns at a capsule-related site. Enforcement activity is expected to keep audit readiness central during supplier qualification and contract renewal decisions.
Implementation barriers are projected to create access for vendors bundling ingredients and application service. Kerry updated immune-health format guidance in March 2026, pointing to flavor and functional ingredient choices across daily products. The supplier route is expected to favor teams that align postbiotic supplements with label support and formulation handover during launch planning.
Which country CAGRs are profiled in the Immune Digestive Support Market?
.webp "Top Country Growth Comparison Immune Digestive Support Market Cagr (2026 2036)")
| Country | CAGR |
|---|---|
| United States | 5.1% |
| China | 6.4% |
| India | 7.7% |
| Germany | 4.3% |
| United Kingdom | 4.7% |
| Japan | 3.7% |
| South Korea | 4.9% |
Source: FMI's proprietary forecasting model and primary research
How do country-level CAGRs compare in the Immune Digestive Support Market?
Country CAGR profiles in the immune digestive support market should be read through channel maturity and claims discipline. India at 7.7% and China at 6.4% form the higher-growth tier due to digital commerce and wellness adoption. The United States at 5.1%, South Korea at 4.9% and the United Kingdom at 4.7% form a mid-tier shaped by repeat online purchasing. Germany at 4.3% and Japan at 3.7% reflect steadier evidence-led purchasing, guiding suppliers toward documentation depth before channel scale.
- By 2036, the United States is projected to grow at 5.1% CAGR due to supplement usage and pharmacy-led repeat purchase. United States Census Bureau reported first-quarter retail e-commerce sales of USD 302.3 billion in 2026. Online retail scale is expected to support subscription-ready immune digestive formats across pharmacy and direct channels. DSM-Firmenich and ADM are positioned to gain traction in accounts needing ingredient breadth and claims support.
- China's demand outlook is anticipated to advance at 6.4% CAGR over the assessment period, supported by urban wellness purchasing and digital shelf competition. National Bureau of Statistics of China reported that online retail sales reached 15,972.2 billion yuan in 2025. Urban supplement brands are expected to prioritize channel-ready packs and clearer benefit language for online wellness shoppers. IFF and Kerry are likely to gain in accounts seeking plant-based excipients and flavor support.
- India is forecast to rise at 7.7% CAGR over the forecast period, attributable to nutraceutical whitespace and targeted nutrition adoption. Press Information Bureau reported 4,612 approved micro food processing enterprises for millet processing support by December 2025. Ayurveda-linked formats and immunity products are expected to expand across digital-first wellness sellers and modern pharmacies.
- Immune digestive support market in Germany is estimated to post 4.3% CAGR over the forecast period, owing to strict evidence review and pharmacy comparison. Destatis reported Germany had an 83% online shopping share among internet users in 2024. Online buyer familiarity is expected to raise scrutiny of claims files and dosage instructions. Suppliers offering European Union-ready documentation are predicted to receive stronger sourcing consideration from pharmacy-led accounts.
- The United Kingdom outlook is projected to record 4.7% CAGR over the assessment period, driven by pharmacy access and online supplement comparison. Office for National Statistics reported CPIH inflation at 3.2% in January 2026 across United Kingdom consumer prices. Price sensitivity is expected to make claims clarity and pack value more visible in retail review. Glanbia and Amway are expected to build channel presence in branded nutrition programs serving repeat wellness buyers.
- In Japan, immune digestive support demand is predicted to advance at 3.7% CAGR over the forecast period due to structured buyer coordination and conservative claims review. METI estimated domestic business-to-business e-commerce at 514.4 trillion yen in 2024 across Japan buyer networks. Functional nutrition inputs are expected to gain selectively in repeat wellness routines shaped by careful claims review. Lonza Capsules & Health Ingredients and Nestlé Health Science are positioned for evidence-led accounts needing controlled launch pacing.
- South Korea is estimated to post 4.9% CAGR over the forecast period, supported by mobile commerce and beauty-linked wellness routines. Statistics Korea reported online shopping transaction value at 24.2904 trillion won in December 2025. Digital health and beauty channels are expected to expand supplement discovery through compact packs and fast product comparison. Buyers seeking quick replenishment are expected to favor branded nutrition suppliers that support compact product files.
Who are the notable companies in the Immune Digestive Support Market?
DSM-Firmenich, Glanbia, Lonza Capsules & Health Ingredients, BASF, Nestlé Health Science, ADM, Kerry, IFF, and Amway are the notable companies shaping this market.
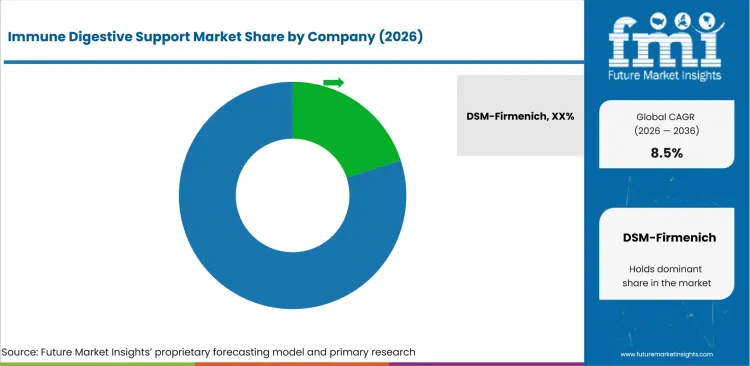
Competition in the immune digestive support market is split by ingredient breadth, dosage-form control and channel service for daily wellness programs. DSM-Firmenich and ADM are more suited to ingredient-led accounts needing broad formulation support across multi-benefit products. Kerry and IFF are better positioned in formulation-heavy briefs that require taste and excipient support. Lonza Capsules & Health Ingredients supports dosage-form programs requiring capsule evidence and manufacturing documentation before commercial launch. Glanbia and Amway gain preference in brand-led consumer nutrition channels that reward repeat consumer access. Nestlé Health Science retains access in specialist nutrition environments that need product education and clinical positioning. Sales outlook is expected to focus on which supplier reduces formulation risk across herbal supplement products and documentation work.
- DSM-Firmenich and ADM focus on ingredient breadth, which addresses supplement brands needing immune and digestive formulation depth in one supplier screen. Buyers use these portfolios to reduce ingredient qualification work before launch and to compare technical support across capsules or powders.
- Buyers choosing Lonza Capsules & Health Ingredients or IFF are typically looking for dosage-form fit due to capsule behavior and oral-format expertise. Lonza capsule services and IFF plant-based excipient work help quality operations teams lower production risk before commercial orders.
- Glanbia and Amway gain preference in consumer-facing environments due to branded nutrition access and established channel routines. Nestlé Health Science supports specialist nutrition accounts needing product education and evidence-led channel support. Buyers value repeat purchase programs across pharmacy or digital retail accounts during category planning cycles.
- In formulation-heavy accounts, Kerry and BASF are prominent due to ingredient application support and broader nutrition portfolios. Sourcing teams select these suppliers in accounts whose internal formulation teams need help translating plant-based inputs into launch-ready supplement formats.
Competitive Benchmarking: Immune Digestive Support Market
| Company | Ingredient Fit | Dosage-Form Fit | Service Reach | Channel Access |
|---|---|---|---|---|
| DSM-Firmenich | High | Strong | Global | High |
| Glanbia | High | Strong | Global | Strong |
| Lonza Capsules & Health Ingredients | Strong | High | Global | High |
| BASF | Strong | Medium | Global | Strong |
| Nestlé Health Science | Medium | High | Global | Strong |
| ADM | High | Medium | Global | Strong |
| Kerry | High | Strong | Global | Strong |
| IFF | High | Strong | Global | High |
| Amway | Medium | High | Global | Country-specific |
Source: Future Market Insights competitive analysis, 2026. Ratings reflect relative portfolio relevance and workflow fit alongside service capability and geographic reach.
Key Developments in the Immune Digestive Support Market
- In March 2025, Lonza Capsules & Health Ingredients established a Center of Applied Sustainability for capsule customers. The center is expected to support capsule and health ingredient customers that ask suppliers for manufacturing evidence.
- In August 2024, Nestlé Health Science signed an agreement to acquire global rights to VOWST®. The company said the transaction would give it control over further development, commercialization and manufacturing.
- In September 2025, BASF and Louis Dreyfus Company completed the sale of BASF food and health performance ingredients business. The transaction transferred activities previously housed inside BASF Nutrition and Health to Louis Dreyfus Company. The portfolio shift is expected to make buyers review ownership stability and service continuity before awarding longer supply programs.
- In February 2025, ADM and Asahi Group signed an exclusive distribution agreement for a targeted postbiotic. The agreement covered stress, mood and sleep support in wellness applications aimed at targeted daily routines. The development expanded ADM postbiotic access around targeted wellness applications serving stress and mood platforms.
Key Players in the Immune Digestive Support Market
Ingredient and bioscience suppliers
- DSM-Firmenich
- BASF
- ADM
- Kerry
- IFF
Capsule and dosage-form specialists
- Lonza Capsules & Health Ingredients
Consumer nutrition companies
- Glanbia
- Nestlé Health Science
- Amway
Immune Digestive Support Market - Report Scope
| Coverage field | Report scope |
|---|---|
| Market breakdown | Immune Digestive Support Market Breakdown by form, source, health benefit, distribution channel, and region |
| Market Definition | Immune digestive support products include supplement formats, active ingredients and delivery systems used by brands, contract manufacturers and health retailers to support immunity and digestive wellness applications across consumer channels. |
| Regions Covered | North America, Latin America, Europe, East Asia, South Asia and Pacific, Middle East and Africa |
| Countries Covered | United States, China, India, Germany, United Kingdom, Japan, South Korea and additional country markets |
| Key Companies Profiled | DSM-Firmenich, Glanbia, Lonza Capsules & Health Ingredients, BASF, Nestlé Health Science, ADM, Kerry, IFF, Amway |
| Forecast Period | 2026 to 2036 |
| Approach | Hybrid methodology used segment adoption and buyer use cases alongside country CAGRs and supplier portfolios for verified public-source signal review |
Source: Future Market Insights - analysis driven by proprietary forecasting models and primary research
Immune Digestive Support Market - Research Methodology
| Method | Approach |
|---|---|
| Primary Research | FMI analysts reviewed inputs from supplement brand managers and contract manufacturers active in immune digestive formats. Ingredient suppliers and pharmacy buyers were assessed during product-pathway review for supply screening and channel fit. E-commerce channel managers and formulation specialists were included in the same review for product-page and claims readiness. Interviews covered dosage-form choices and ingredient documentation during supplier review across capsules and gummy programs. Adoption barriers and channel expectations were tested against capsule programs and plant-based briefs during forecast assumption review. |
| Desk Research | Desk research covered official health sources and regulatory references relevant to dietary supplements and claim review. National retail indicators, company product information and public category data were reviewed for market relevance. Product relevance was checked against immune digestive use cases and dosage-form claims before source allocation. Ingredient sourcing and label documentation were reviewed against channel requirements across pharmacy and digital retail. |
| Market Sizing and Forecasting | The model combined finished supplement demand and ingredient adoption signals during forecast construction across all parent categories. Format mix and health-benefit positioning were reviewed against country-level retail access signals during market sizing. Forecast assumptions were adjusted for capsule preference and plant-based sourcing patterns across audited supplement programs. Immunity positioning and e-commerce conversion were weighted during final model review for channel adoption estimates. Documentation requirements were weighted when products needed stronger label support or channel-ready claims files. |
| Data Validation | Forecasts were checked against supplement retail activity, supplier portfolios and country-level consumer health indicators. Company portfolios were reviewed to avoid counting adjacent nutrition ingredients without direct immune digestive relevance. |
Source: Future Market Insights (FMI) analysis, based on proprietary forecasting model and primary research
Immune Digestive Support Market by Segments
Immune Digestive Support Market segmented by Form:
- Tablets
- Capsules
- Powder
- Gummies
- Effervescent
Immune Digestive Support Market segmented by Source:
- Plant-Based
- Microbial
- Animal-Derived
- Marine
- Synthetic
Immune Digestive Support Market segmented by Health Benefit:
- Gut Health
- Immunity
- Metabolic Health
- Hormonal Health
- Energy and Vitality
Immune Digestive Support Market segmented by Distribution Channel:
- Pharmacies
- E-Commerce
- Health and Specialty Stores
- Supermarkets
- Direct Sales
Immune Digestive Support Market by Region:
- North America
- United States
- Canada
- Europe
- Germany
- United Kingdom
- France
- Italy
- Spain
- Asia Pacific
- China
- Japan
- South Korea
- Taiwan
- Singapore
- India
- Latin America
- Brazil
- Mexico
- Argentina
- Middle East & Africa
- GCC Countries
- South Africa
- Israel
Research Sources and Bibliography
- Stierman, B., Couch, C. A., Gahche, J. J., Mishra, S. (2026, May). Dietary supplement use: United States, August 2021-August 2023. National Center for Health Statistics.
- USA Food and Drug Administration. (2025, August). CP 7321.008, Dietary Supplements - Foreign and Domestic Inspections, Sampling, and Imports. USA Food and Drug Administration.
- USA Food and Drug Administration. (2025, June). New Dietary Ingredient (NDI) Notification Process. USA Food and Drug Administration.
- USA Food and Drug Administration. (2025, December). Dietary Supplements Guidance Documents & Regulatory Information. USA Food and Drug Administration.
- USA Food and Drug Administration. (2026, January). LiquidCapsule Manufacturing, LLC - 717069 - 12/19/2025. USA Food and Drug Administration.
- USA Census Bureau. (2026, May). Quarterly Retail E-Commerce Sales Report. USA Census Bureau.
- National Bureau of Statistics of China. (2026, January). Total Retail Sales of Consumer Goods in December 2025. National Bureau of Statistics of China.
- Press Information Bureau, Government of India. (2026, February). Promotion of Nutraceuticals and Functional Foods. Government of India.
- German Federal Statistical Office. (2025, January). European Union: 8 out of 10 internet users shop online. Destatis.
- Office for National Statistics. (2026, February). Consumer price inflation, UK: January 2026. Office for National Statistics.
- Ministry of Economy, Trade and Industry. (2025, August). Results of FY2024 E-Commerce Market Survey Compiled. Ministry of Economy, Trade and Industry.
- Statistics Korea. (2026, February). Online Shopping in December 2025. Statistics Korea.
- Eurostat. (2026, June). E-commerce statistics for individuals. European Commission.
- IFF. (2025, April). IFF Pharma Solutions to Showcase Plant-Based Dietary Supplement Ingredients and Technical Expertise at Vitafoods Europe 2025. IFF.
- Lonza. (2025, October). Lonza Capsugel Launches New Market-First Organic Capsule Solution at SupplySide Global 2025. Lonza.
- Lonza. (2025, March). Lonza Capsules & Health Ingredients Establishes Center of Applied Sustainability. Lonza.
- Nestlé Health Science. (2024, August). Nestlé Health Science signs agreement to acquire global rights to VOWST®. Nestlé Health Science.
- BASF. (2025, September). Joint News Release: BASF and Louis Dreyfus Company Complete Sale and Purchase Transaction for BASF’s Food and Health Performance Ingredients Business. BASF.
- ADM. (2025, February). ADM and Asahi Group Sign Exclusive Distribution Agreement for Innovative Postbiotic Designed to Support Stress, Mood and Sleep. ADM.
- Glanbia. (2025, December). Megatrends in functional nutrition for 2026 and beyond. Glanbia.
- Kerry. (2026, March). Immune Health: The Flavours, Formats and Functional Ingredients Driving the Category. Kerry.
This bibliography is provided for reader reference and uses primary government, standards-body, official trade body, and company sources.
This Report Answers
- What is the expected value of the immune digestive support market in 2026 and 2036?
- What CAGR is forecast for the immune digestive support market from 2026 to 2036?
- Which segments shape demand across form, source, health benefit and distribution channel categories during the forecast period?
- Which buyer pressures are expected to support immune digestive product adoption?
- How do country CAGRs differ across the profiled markets?
- Which companies compete across ingredients, dosage forms and consumer nutrition channels?
- How does FMI validate forecasts and avoid duplicate external statistics?
- What buyer factors should suppliers address before broader account expansion?
- How do claims review and documentation affect supplier selection?
Frequently Asked Questions
Why should executives track the Immune Digestive Support Market?
Executives should track this market due to its shift from broad wellness products to documented daily-use nutrition programs requiring evidence and compliance support.
What business problem does the Immune Digestive Support Market address?
It addresses the need to connect immune and digestive benefit positioning to stable dosage forms and repeatable product files.
What should procurement leaders evaluate before selecting suppliers?
Procurement leaders should evaluate ingredient documentation alongside formulation fit and claims support before broader account approval. Batch consistency and channel readiness should remain part of the same supplier review before broader account approval.
What limits return on investment for buyers?
Return on investment is reduced by weak claims evidence, unstable dosage formats and delayed regulatory or channel approvals.
How should suppliers build executive confidence?
Suppliers build confidence by providing validated ingredient science and clear label support before launch review. Reliable dosage formats and channel-ready documentation should support account expansion across pharmacy and digital channels.
Which segment positions are most visible in 2026?
Capsules carry the form position, plant-based inputs carry source demand and immunity anchors benefit positioning. E-commerce adds channel visibility across the 2026 segment view due to replenishment and subscription behavior.
Which country signals the sharper growth profile?
India is expected to grow at 7.7% CAGR due to nutraceutical whitespace and digital-first nutrition adoption.
Preview the report firsthand - request a free sample
Get SampleGet the brochure for pricing and purchase details.
Get PDFTable of Content
- Key Takeaways
- Market Size and CAGR
- Top Growth Driver
- Fastest Growing Segment
- Leading Region
- Key Companies
- Emerging Opportunities
- Executive Summary
- Global Market Outlook
- Demand-side Trends
- Supply-side Trends
- Technology Roadmap Analysis
- Analysis and Recommendations
- Analyst Perspective (What is happening? Why now? What should investors know?)
- Key Questions Answered
- How large is the market?
- What is the CAGR?
- What are key trends?
- Which region dominates?
- Who are the leaders?
- Market Overview
- Market Coverage / Taxonomy
- Market Definition / Scope / Limitations
- Research Methodology
- Chapter Orientation
- Analytical Lens and Working Hypotheses
- Market Structure, Signals, and Trend Drivers
- Benchmarking and Cross-market Comparability
- Market Sizing, Forecasting, and Opportunity Mapping
- Research Design and Evidence Framework
- Desk Research Programme (Secondary Evidence)
- Expert Input and Fieldwork (Primary Evidence)
- Tooling, Models, and Reference Databases
- Data Engineering and Model Build
- Quality Assurance and Audit Trail
- Market Background
- Market Dynamics (Drivers, Restraints, Opportunity, Trends)
- Scenario Forecast (Optimistic, Likely, Conservative)
- Impact Analysis
- AI Impact
- Sustainability Impact
- Regulatory Impact
- Technology Impact
- Consumer / Buyer Analysis
- Purchase Drivers
- Adoption Barriers
- Buyer Journey
- Opportunity Map Analysis
- Product Life Cycle Analysis
- Supply Chain Analysis
- Investment Feasibility Matrix
- Value Chain Analysis
- PESTLE and Porter's Analysis
- Regulatory Landscape
- Regional Parent Market Outlook
- Production and Consumption Statistics
- Import and Export Statistics
- Global Market Analysis and Forecast, 2021 to 2036
- Historical Market Size Value (USD Million) & Volume (Unit) Analysis, 2021 to 2025
- Current and Future Market Size Value (USD Million) & Volume (Unit) Projections, 2026 to 2036
- Y-o-Y Growth Trend Analysis
- Absolute $ Opportunity Analysis
- Global Market Pricing Analysis, 2021 to 2036
- Global Market Analysis and Forecast, By Form, 2021 to 2036
- Introduction / Key Findings
- Historical Market Size Value (USD Million) & Volume (Unit) Analysis By Form, 2021 to 2025
- Current and Future Market Size Value (USD Million) & Volume (Unit) Analysis and Forecast By Form, 2026 to 2036
- Capsules
- Tablets
- Powder
- Gummies
- Effervescent
- Capsules
- Y-o-Y Growth Trend Analysis By Form, 2021 to 2025
- Absolute $ Opportunity Analysis By Form, 2026 to 2036
- Global Market Analysis and Forecast, By Source, 2021 to 2036
- Introduction / Key Findings
- Historical Market Size Value (USD Million) & Volume (Unit) Analysis By Source, 2021 to 2025
- Current and Future Market Size Value (USD Million) & Volume (Unit) Analysis and Forecast By Source, 2026 to 2036
- Plant-Based
- Microbial
- Animal-Derived
- Marine
- Synthetic
- Plant-Based
- Y-o-Y Growth Trend Analysis By Source, 2021 to 2025
- Absolute $ Opportunity Analysis By Source, 2026 to 2036
- Global Market Analysis and Forecast, By Health Benefit, 2021 to 2036
- Introduction / Key Findings
- Historical Market Size Value (USD Million) & Volume (Unit) Analysis By Health Benefit, 2021 to 2025
- Current and Future Market Size Value (USD Million) & Volume (Unit) Analysis and Forecast By Health Benefit, 2026 to 2036
- Immunity
- Gut Health
- Metabolic Health
- Hormonal Health
- Energy and Vitality
- Immunity
- Y-o-Y Growth Trend Analysis By Health Benefit, 2021 to 2025
- Absolute $ Opportunity Analysis By Health Benefit, 2026 to 2036
- Global Market Analysis and Forecast, By Distribution Channel, 2021 to 2036
- Introduction / Key Findings
- Historical Market Size Value (USD Million) & Volume (Unit) Analysis By Distribution Channel, 2021 to 2025
- Current and Future Market Size Value (USD Million) & Volume (Unit) Analysis and Forecast By Distribution Channel, 2026 to 2036
- E-commerce
- Pharmacies
- Health and Specialty Stores
- Supermarkets
- Direct Sales
- E-commerce
- Y-o-Y Growth Trend Analysis By Distribution Channel, 2021 to 2025
- Absolute $ Opportunity Analysis By Distribution Channel, 2026 to 2036
- Global Market Analysis and Forecast, By Region, 2021 to 2036
- Introduction
- Historical Market Size Value (USD Million) & Volume (Unit) Analysis By Region, 2021 to 2025
- Current Market Size Value (USD Million) & Volume (Unit) Analysis and Forecast By Region, 2026 to 2036
- North America
- Latin America
- Western Europe
- Eastern Europe
- East Asia
- South Asia and Pacific
- Middle East & Africa
- Market Attractiveness Analysis By Region
- North America Market Analysis and Forecast, By Country, 2021 to 2036
- Historical Market Size Value (USD Million) & Volume (Unit) Trend Analysis By Market Taxonomy, 2021 to 2025
- Market Size Value (USD Million) & Volume (Unit) Forecast By Market Taxonomy, 2026 to 2036
- By Country
- USA
- Canada
- Mexico
- By Form
- By Source
- By Health Benefit
- By Distribution Channel
- By Country
- Market Attractiveness Analysis
- By Country
- By Form
- By Source
- By Health Benefit
- By Distribution Channel
- Key Takeaways
- Latin America Market Analysis and Forecast, By Country
- Historical Market Size Value (USD Million) & Volume (Unit) Trend Analysis By Market Taxonomy, 2021 to 2025
- Market Size Value (USD Million) & Volume (Unit) Forecast By Market Taxonomy, 2026 to 2036
- By Country
- Brazil
- Chile
- Rest of Latin America
- By Form
- By Source
- By Health Benefit
- By Distribution Channel
- By Country
- Market Attractiveness Analysis
- By Country
- By Form
- By Source
- By Health Benefit
- By Distribution Channel
- Key Takeaways
- Western Europe Market Analysis and Forecast, By Country
- Historical Market Size Value (USD Million) & Volume (Unit) Trend Analysis By Market Taxonomy, 2021 to 2025
- Market Size Value (USD Million) & Volume (Unit) Forecast By Market Taxonomy, 2026 to 2036
- By Country
- Germany
- UK
- Italy
- Spain
- France
- Nordic
- BENELUX
- Rest of Western Europe
- By Form
- By Source
- By Health Benefit
- By Distribution Channel
- By Country
- Market Attractiveness Analysis
- By Country
- By Form
- By Source
- By Health Benefit
- By Distribution Channel
- Key Takeaways
- Eastern Europe Market Analysis and Forecast, By Country
- Historical Market Size Value (USD Million) & Volume (Unit) Trend Analysis By Market Taxonomy, 2021 to 2025
- Market Size Value (USD Million) & Volume (Unit) Forecast By Market Taxonomy, 2026 to 2036
- By Country
- Russia
- Poland
- Hungary
- Balkan & Baltic
- Rest of Eastern Europe
- By Form
- By Source
- By Health Benefit
- By Distribution Channel
- By Country
- Market Attractiveness Analysis
- By Country
- By Form
- By Source
- By Health Benefit
- By Distribution Channel
- Key Takeaways
- East Asia Market Analysis and Forecast, By Country
- Historical Market Size Value (USD Million) & Volume (Unit) Trend Analysis By Market Taxonomy, 2021 to 2025
- Market Size Value (USD Million) & Volume (Unit) Forecast By Market Taxonomy, 2026 to 2036
- By Country
- China
- Japan
- South Korea
- By Form
- By Source
- By Health Benefit
- By Distribution Channel
- By Country
- Market Attractiveness Analysis
- By Country
- By Form
- By Source
- By Health Benefit
- By Distribution Channel
- Key Takeaways
- South Asia and Pacific Market Analysis and Forecast, By Country
- Historical Market Size Value (USD Million) & Volume (Unit) Trend Analysis By Market Taxonomy, 2021 to 2025
- Market Size Value (USD Million) & Volume (Unit) Forecast By Market Taxonomy, 2026 to 2036
- By Country
- India
- ASEAN
- Australia & New Zealand
- Rest of South Asia and Pacific
- By Form
- By Source
- By Health Benefit
- By Distribution Channel
- By Country
- Market Attractiveness Analysis
- By Country
- By Form
- By Source
- By Health Benefit
- By Distribution Channel
- Key Takeaways
- Middle East & Africa Market Analysis and Forecast, By Country
- Historical Market Size Value (USD Million) & Volume (Unit) Trend Analysis By Market Taxonomy, 2021 to 2025
- Market Size Value (USD Million) & Volume (Unit) Forecast By Market Taxonomy, 2026 to 2036
- By Country
- Kingdom of Saudi Arabia
- Other GCC Countries
- Türkiye
- South Africa
- Other African Union
- Rest of Middle East & Africa
- By Form
- By Source
- By Health Benefit
- By Distribution Channel
- By Country
- Market Attractiveness Analysis
- By Country
- By Form
- By Source
- By Health Benefit
- By Distribution Channel
- Key Takeaways
- Key Countries Market Analysis
- USA
- Pricing Analysis
- Market Share Analysis, 2025
- By Form
- By Source
- By Health Benefit
- By Distribution Channel
- Canada
- Pricing Analysis
- Market Share Analysis, 2025
- By Form
- By Source
- By Health Benefit
- By Distribution Channel
- Mexico
- Pricing Analysis
- Market Share Analysis, 2025
- By Form
- By Source
- By Health Benefit
- By Distribution Channel
- Brazil
- Pricing Analysis
- Market Share Analysis, 2025
- By Form
- By Source
- By Health Benefit
- By Distribution Channel
- Chile
- Pricing Analysis
- Market Share Analysis, 2025
- By Form
- By Source
- By Health Benefit
- By Distribution Channel
- Germany
- Pricing Analysis
- Market Share Analysis, 2025
- By Form
- By Source
- By Health Benefit
- By Distribution Channel
- UK
- Pricing Analysis
- Market Share Analysis, 2025
- By Form
- By Source
- By Health Benefit
- By Distribution Channel
- Italy
- Pricing Analysis
- Market Share Analysis, 2025
- By Form
- By Source
- By Health Benefit
- By Distribution Channel
- Spain
- Pricing Analysis
- Market Share Analysis, 2025
- By Form
- By Source
- By Health Benefit
- By Distribution Channel
- France
- Pricing Analysis
- Market Share Analysis, 2025
- By Form
- By Source
- By Health Benefit
- By Distribution Channel
- India
- Pricing Analysis
- Market Share Analysis, 2025
- By Form
- By Source
- By Health Benefit
- By Distribution Channel
- ASEAN
- Pricing Analysis
- Market Share Analysis, 2025
- By Form
- By Source
- By Health Benefit
- By Distribution Channel
- Australia & New Zealand
- Pricing Analysis
- Market Share Analysis, 2025
- By Form
- By Source
- By Health Benefit
- By Distribution Channel
- China
- Pricing Analysis
- Market Share Analysis, 2025
- By Form
- By Source
- By Health Benefit
- By Distribution Channel
- Japan
- Pricing Analysis
- Market Share Analysis, 2025
- By Form
- By Source
- By Health Benefit
- By Distribution Channel
- South Korea
- Pricing Analysis
- Market Share Analysis, 2025
- By Form
- By Source
- By Health Benefit
- By Distribution Channel
- Russia
- Pricing Analysis
- Market Share Analysis, 2025
- By Form
- By Source
- By Health Benefit
- By Distribution Channel
- Poland
- Pricing Analysis
- Market Share Analysis, 2025
- By Form
- By Source
- By Health Benefit
- By Distribution Channel
- Hungary
- Pricing Analysis
- Market Share Analysis, 2025
- By Form
- By Source
- By Health Benefit
- By Distribution Channel
- Kingdom of Saudi Arabia
- Pricing Analysis
- Market Share Analysis, 2025
- By Form
- By Source
- By Health Benefit
- By Distribution Channel
- Türkiye
- Pricing Analysis
- Market Share Analysis, 2025
- By Form
- By Source
- By Health Benefit
- By Distribution Channel
- South Africa
- Pricing Analysis
- Market Share Analysis, 2025
- By Form
- By Source
- By Health Benefit
- By Distribution Channel
- USA
- Market Structure Analysis
- Competition Dashboard
- Competition Benchmarking
- Market Share Analysis of Top Players
- By Regional
- By Form
- By Source
- By Health Benefit
- By Distribution Channel
- Emerging Startups
- Innovation Benchmarking
- Competition Analysis
- Competition Deep Dive
- DSM-Firmenich
- Overview
- Product Portfolio
- Profitability by Market Segments (Product/Region/Sales Channel)
- Sales Footprint
- Strategy Overview
- Marketing Strategy
- Product Strategy
- Channel Strategy
- BASF
- ADM
- Kerry
- IFF
- Glanbia
- Nestlé Health Science
- Amway
- DSM-Firmenich
- Case Studies
- Success Stories
- Recent Developments
- Competition Deep Dive
- Assumptions & Acronyms Used


