Reports

- Global Locations -

Headquarters

Future Market Insights, Inc.

Christiana Corporate, 200
Continental Drive, Suite 401,
Newark, Delaware - 19713,
United States

T: +1-845-579-5705

Americas

Future Market Insights, Inc.

616 Corporate Way, Suite 2-9018,
Valley Cottage, NY 10989, United States

T: +1-347-918-3531

MEA

Future Market Insights

1602-6 Jumeirah Bay X2 Tower, Plot No: JLT-PH2-X2A,
Jumeirah Lakes Towers, Dubai,
United Arab Emirates

Europe

Future Market Insights

3rd Floor, 207 Regent Street,
W1B 3HH London
United Kingdom

T: + 44 (0) 20 8123 9659
D: +44 (0) 20 3287 4268

Asia Pacific

Future Market Insights

IndiaLand Global Tech Park, Unit UG-1, Behind Grand HighStreet, Phase 1, Hinjawadi, MH, Pune – 411057, India

Gold Infused Skin Care Market Snapshot (2022 to 2032)

The global gold-infused skin care market garnered a market value of US$ 3,412.3 Million in 2022 and is expected to accumulate a market value of US$ 14,238.9 Million by registering a CAGR of 15.4% in the forecast period 2022 to 2032.

The growth of the gold-infused skin care market can be attributed to an increasing inclination towards investing in anti-aging products. The market for gold-infused skin care registered a CAGR of 12.3% in the historical period 2016 to 2021.

Data Points Key Statistics
Estimated Base Year Value (2021) US$ 2,945.86 Million
Expected Market Value (2022) US$ 3,412.3 Million
Anticipated Forecast Value (2032) US$ 14,238.9 Million
Projected Growth Rate (2022 to 2032) 15.4% CAGR

Gold is used in various skin diseases and arthritis due to its anti-inflammatory property. Anti-aging property leads to its high use of gold in the large range of cosmetics. The global gold-infused beauty products market is expected to have a significant growth rate, attributed to the growing cosmetic industry, the rapid rate of urbanization, and changing the lifestyle of consumers.

Consumers are looking for different options in skin care products. From organic, and natural to now gold-infused skin care products are taking over the market. In addition, the use of 23K and 24K carat gold used in skin care products is gaining the trust of consumers. Moreover, gold-infused skin care offer helps in reducing wrinkles, preventing radical damage, and reducing inflammation.

Don't pay for what you don't need

Customize your report by selecting specific countries or regions and save 30%!

Which Are Some Prominent Drivers Of Gold Infused Skin Care Market?

The growth of the global gold-infused beauty products market is driven by growing demand for cosmetics and increasing investments in the personal care industry. Macroeconomic factors such as changing lifestyles, a growing economy, rapid rate of urbanization, increasing per capita income, and increasing employment rate are driving the global gold-infused beauty products market.

The properties of gold such as anti-inflammatory and anti-oxidant are contributing to the growth of the gold-infused skin care market. In addition, some of the factors trending in the global gold-infused beauty products market include mergers & acquisitions and geographical expansion by gold-infused beauty products market players.

What Are The Challenges Faced By The Gold Infused Skin Care Market?

However, the high cost of gold leads to an increase in the cost of final products, which, in turn, results in restraining the global gold-infused beauty products market. Moreover, in developing regions, manufacturers of gold-infused skin care products are not launching the same owing to a lack of awareness exhibited by people.

In addition, in comparison to other skin care products such as organic and conventional, gold-infused skin care products are fairly new. This is creating a lack of awareness amongst consumers. All these factors are affecting the growth of gold infused skin care market.

Sneha Verghese
Sneha Verghese

Principal Consultant

Talk to Analyst

Find your sweet spots for generating winning opportunities in this market.

Women Contributing To Gold Infused Skin Care Products In North America?

Consumers in the USA are preferring quality over quantity and other aspects when choosing personal skin care products. Moreover, the market in North America for skin care is highly competitive owing to the presence of major key players.

Women, especially are largely contributing to the gold-infused skin care products owing to the properties it offers. Thus, due to the aforementioned reasons, North America is expected to hold a 22% market share for the gold-infused skin care market in 2022.

Exclusive Launches Of Gold Infused Skin Care Products Augmenting Growth Of Market In Europe?

Reports state that more than 90% of people in Europe are investing in make-up and skin care products. In addition, skin care companies are launching exclusive gold-infused skin care products for different age groups. This, in turn, is attracting consumers to invest in the same.

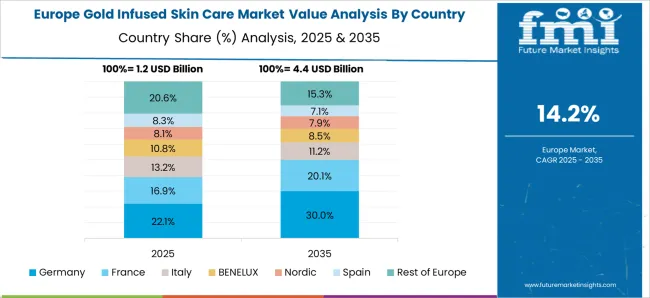
Gold content has found its place in serums, foundation primers, and eye creams. All these factors are influencing the growth of gold-infused skin care products. Thus, owing to the reasons mentioned above, Europe is expected to possess a 27% market share for the gold-infused skin care market in 2022.

Get the data you need at a Fraction of the cost

Personalize your report by choosing insights you need
and save 40%!

E-Commerce Websites Contributing To Gold Infused Skin Care Market In Asia Pacific?

Expansion of the retail industry in countries like India, China, and Australia is positively influencing the growth of gold infused skin care market. In comparison to other regions, the penetration of gold-infused skin care products is low.

The presence of E-commerce websites has given an added advantage for the exportation of gold-infused skin care products in the region. Thus, Asia Pacific is expected to hold a 20% market share of gold infused skin care market in 2022.

Start-up Players In Gold Infused Skin Care Market

In recent years, cosmetics and personal care has scaled new heights. From incorporating unique and novel ingredient formulations to introducing eco-friendly products, the industry has seen significant developments across various geographies. The introduction of gold-infused skin care products is one such achievement. Key start-up players in the gold-infused skin care market are RAS Luxury, Tatcha, Sunday Riley, 111SKIN, and Glossier.
  • 111SKIN, a key start-up player in the gold-infused skin care market is offering eye masks made of gold that help in boosting circulation. The company is focusing on using gold in different products to rejuvenate skin. The company offers its Rose Gold Illuminating Eye Mask, which delivers long-lasting luminosity to the under-eye area
  • Likewise, RAS Luxury is a leading manufacturer, offering Luxury Oils imparting 24K gold radiance beauty-infused face elixir serums. This gold-hued oil diminishes scars and restores elasticity and suppleness to the skin. In addition, the product is devoid of any harmful chemicals, including sulfates, parabens, formaldehyde, and mineral oil.
  • Tatcha, a USA-based company, manufactures Gold Camellia Beauty Oil- a multi-tasking beauty oil for the face, hair, and body. Formulated with extra virgin Japanese camellia oil and 23 karat-gold, it helps lock moisture, adding instant nourishment and infusing radiance

Market Competition

Key players in the gold-infused skin care market are La Prairie, Amala, Tatcha, Cle de Peau, Merle Norman, The A Method, Chantecallie, Physicians Formula, Keys Soulcare, Peter Thomas Roth, Knesko Skin and 111Skin

  • Merle Norman, a key player in the gold-infused skin care market offers 24K foundation primer. The formula used in the primer offers a good canvas for makeup.
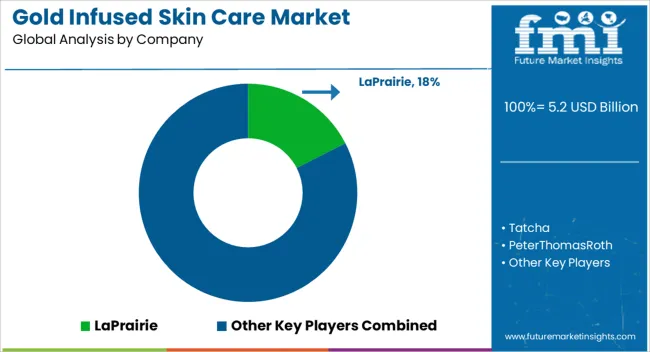
  • La Prairie is a prominent figure in the gold-infused skin care landscape. Its pure gold cosmetics collection helps enhance radiance in the skin on a long-term basis. Its product offerings include Pure Gold Radiance Eye Cream; Pure Gold Radiance Eye Cream Replenishment and Pure Gold Radiance Cream among others.

Report Scope

Report Attribute Details
Market Value in 2022 US$ 3,412.3 Million
Market Value in 2032 US$ 14,238.9 Million
Growth Rate CAGR of 15.4% from 2022 to 2032
Base Year for Estimation 2021
Historical Data 2016 to 2021
Forecast Period 2022 to 2032
Quantitative Units Revenue in US$ Million and CAGR from 2022 to 2032
Report Coverage Revenue Forecast, Volume Forecast, Company Ranking, Competitive Landscape, Growth Factors, Trends, and Pricing Analysis
Segments Covered
  • Product
  • Distribution Channel
  • Gender
  • Region
Regions Covered
  • North America
  • Latin America
  • Europe
  • Asia Pacific
  • Middle East and Africa
Key Countries Profiled
  • United States of America
  • Canada
  • Brazil
  • Mexico
  • Germany
  • United Kingdom
  • France
  • Spain
  • Italy
  • Australia
  • New Zealand
  • China
  • Japan
  • South Korea
  • Malaysia
  • Singapore
  • GCC Countries
  • South Africa
  • Israel
Key Companies Profiled
  • La Prairie
  • Amala
  • Tatcha
  • Cle de Peau
  • Merle Norman
  • The A Method
  • Chantelle
  • Physicians Formula
  • Keys Soulcare
  • Peter Thomas Roth
  • Knesko Skin
  • 111Skin
Customization Available Upon Request

Key Segments Profiled In The Gold Infused Skin Care Industry Survey

By Product:

  • Products
  • Products
  • Oils
  • Creams
  • Serums
  • Cleansers
  • Eye Care Products
  • Body Care Products
  • Hair Care Products
  • Make-up Cosmetics

By Distribution Channel:

  • Products Sales via Hypermarkets/Supermarkets
  • Products Sales via Specialty stores
  • Products Sales via Brand Outlets
  • Direct Sales of Products
  • Products Sales via E-Commerce

By Gender:

  • Products for Men
  • Products for Women

By Region:

  • North America
  • Latin America
  • Europe
  • Asia Pacific
  • Middle East & Africa

Frequently Asked Questions

What is the anticipated growth of the gold infused skin care market until 2032?

FMI projects the global gold-infused skin care market to expand at a 15.4% value CAGR by 2032

Which region is forecast to be the most lucrative for gold infused skin care market growth?

Europe is expected to possess a 27% market share for the gold-infused skin care market in 2022.

Which are some prominent gold infused skin care manufacturers?

La Prairie, Amala, Tatcha, Cle de Peau, Merle Norman, The A Method, Chantecallie, Physicians Formula, Keys Soulcare, Peter Thomas Roth, Knesko Skin, and 111Skin are some prominent gold-infused skin care manufacturers

Table of Content

1. Global Market - Executive Summary | Gold Infused Skin Care Market

    1.1. Global Market Overview

    1.2. Demand Side Trends

    1.3. Supply Side Trends

    1.4. FMI Analysis and Recommendations

2. Global Market Overview

    2.1. Market Coverage / Taxonomy

    2.2. Market Introduction and Definition

3. Market Background and Foundation Data Points

    3.1. Need of the Hour for Industries

    3.2. Strategic Priorities

    3.3. Life Cycle Stage

    3.4. Importance of Technology

    3.5. Use Cases of Gold-Infused Skin Care

    3.6. Forecast Factors: Relevance and Impact

    3.7. Investment Feasibility Matrix

    3.8. PESTLE Analysis

    3.9. Porter’s Five Forces Analysis

    3.10. Market Dynamics

        3.10.1. Drivers

        3.10.2. Restraints

        3.10.3. Opportunity Analysis

        3.10.4. Trend

4. Global Market Demand (US$ Million) Analysis 2016 to 2021 and Forecast, 2022 to 2032

    4.1. Historical Market Value (US$ Million) Analysis, 2016 to 2021

    4.2. Current and Future Market Value (US$ Million) Projections, 2022 to 2032

        4.2.1. Y-o-Y Growth Trend Analysis

        4.2.2. Absolute $ Opportunity Analysis

5. Global Market Analysis 2016 to 2021 and Forecast 2022 to 2032, By Product

    5.1. Introduction / Key Findings

    5.2. Historical Market Value (US$ Million) Analysis By Product, 2016 to 2021

    5.3. Current and Future Market Value (US$ Million) Analysis and Forecast By Product, 2022 to 2032

        5.3.1. Skin Care Products

        5.3.2. Face Care Products

            5.3.2.1. Oils

            5.3.2.2. Creams

            5.3.2.3. Serums

            5.3.2.4. Cleansers

        5.3.3. Eye Care Products

        5.3.4. Body Care Products

        5.3.5. Hair Care Products

        5.3.6. Make-up Cosmetics

    5.4. Market Attractiveness Analysis By Product

6. Global Market Analysis 2016 to 2021 and Forecast 2022 to 2032, by Distribution Channel

    6.1. Introduction / Key Findings

    6.2. Historical Market Value (US$ Million) Analysis By Distribution Channel, 2016 to 2021

    6.3. Current and Future Market Value (US$ Million) Analysis and Forecast By Distribution Channel, 2022 to 2032

        6.3.1. Hypermarkets/Supermarkets

        6.3.2. Specialty Stores

        6.3.3. Brand Outlets

        6.3.4. Direct Sales

        6.3.5. E-Commerce

    6.4. Market Attractiveness Analysis By Distribution Channel

7. Global Market Analysis 2016 to 2021 and Forecast 2022 to 2032, by Gender

    7.1. Introduction / Key Findings

    7.2. Historical Market Value (US$ Million) Analysis By Gender, 2016 to 2021

    7.3. Current and Future Market Value (US$ Million) Analysis and Forecast By Gender, 2022 to 2032

        7.3.1. Men

        7.3.2. Women

    7.4. Market Attractiveness Analysis By Gender

8. Global Market Analysis 2016 to 2021 and Forecast 2022 to 2032, by Region

    8.1. Introduction / Key Findings

    8.2. Historical Market Value (US$ Million) Analysis By Region, 2016 to 2021

    8.3. Current and Future Market Value (US$ Million) Analysis and Forecast By Region, 2022 to 2032

        8.3.1. North America

        8.3.2. Latin America

        8.3.3. Europe

        8.3.4. East Asia

        8.3.5. South Asia & Oceania

        8.3.6. Middle East and Africa (MEA)

    8.4. Market Attractiveness Analysis By Region

9. North America Market Analysis 2016 to 2021 and Forecast 2022 to 2032

    9.1. Introduction / Key Findings

    9.2. Historical Market Value (US$ Million) Trend Analysis By Market Taxonomy, 2016 to 2021

    9.3. Market Value (US$ Million) Forecast By Market Taxonomy, 2022 to 2032

        9.3.1. By Country

            9.3.1.1. United States of America

            9.3.1.2. Canada

        9.3.2. By Product

        9.3.3. By Distribution Channel

    9.4. Market Attractiveness Analysis

        9.4.1. By Country

        9.4.2. By Product

        9.4.3. By Distribution Channel

10. Latin America Market Analysis 2016 to 2021 and Forecast 2022 to 2032

    10.1. Introduction / Key Findings

    10.2. Historical Market Size (US$ Million) Trend Analysis By Market Taxonomy, 2016 to 2021

    10.3. Current and Future Market Value (US$ Million) Analysis and Forecast By Region, 2022 to 2032

        10.3.1. By Country

            10.3.1.1. Brazil

            10.3.1.2. Mexico

            10.3.1.3. Rest of Latin America

        10.3.2. By Product

        10.3.3. By Distribution Channel

        10.3.4. By Gender

    10.4. Market Attractiveness Analysis

        10.4.1. By Country

        10.4.2. By Product

        10.4.3. By Distribution Channel

        10.4.4. By Gender

11. Europe Market Analysis 2016 to 2021 and Forecast 2022 to 2032

    11.1. Introduction / Key Findings

    11.2. Historical Market Size (US$ Million) Trend Analysis By Market Taxonomy, 2016 to 2021

    11.3. Current and Future Market Value (US$ Million) Analysis and Forecast By Region, 2022 to 2032

        11.3.1. By Country

            11.3.1.1. Germany

            11.3.1.2. France

            11.3.1.3. Italy

            11.3.1.4. Spain

            11.3.1.5. United Kingdom

            11.3.1.6. BENELUX

            11.3.1.7. Russia

            11.3.1.8. Rest of Europe

        11.3.2. By Product

        11.3.3. By Distribution Channel

        11.3.4. By Gender

    11.4. Market Attractiveness Analysis

        11.4.1. By Country

        11.4.2. By Product

        11.4.3. By Distribution Channel

        11.4.4. By Gender

12. East Asia Market Analysis 2016 to 2021 and Forecast 2022 to 2032

    12.1. Introduction / Key Findings

    12.2. Historical Market Size (US$ Million) Trend Analysis By Market Taxonomy, 2016 to 2021

    12.3. Current and Future Market Value (US$ Million) Analysis and Forecast By Region, 2022 to 2032

        12.3.1. By Country

            12.3.1.1. China

            12.3.1.2. Japan

            12.3.1.3. South Korea

        12.3.2. By Product

        12.3.3. By Distribution Channel

        12.3.4. By Gender

    12.4. Market Attractiveness Analysis

        12.4.1. By Country

        12.4.2. By Product

        12.4.3. By Distribution Channel

        12.4.4. By Gender

13. South Asia & Oceania Market Analysis 2016 to 2021 and Forecast 2022 to 2032

    13.1. Introduction / Key Findings

    13.2. Historical Market Size (US$ Million) Trend Analysis By Market Taxonomy, 2016 to 2021

    13.3. Current and Future Market Value (US$ Million) Analysis and Forecast By Region, 2022 to 2032

        13.3.1. By Country

            13.3.1.1. India

            13.3.1.2. Thailand

            13.3.1.3. Malaysia

            13.3.1.4. Singapore

            13.3.1.5. Vietnam

            13.3.1.6. Australia and New Zealand

            13.3.1.7. Rest of South Asia & Oceania

        13.3.2. By Product

        13.3.3. By Distribution Channel

        13.3.4. By Gender

    13.4. Market Attractiveness Analysis

        13.4.1. By Country

        13.4.2. By Product

        13.4.3. By Distribution Channel

        13.4.4. By Gender

14. Middle East and Africa Market Analysis 2016 to 2021 and Forecast 2022 to 2032

    14.1. Introduction / Key Findings

    14.2. Historical Market Size (US$ Million) Trend Analysis By Market Taxonomy, 2016 to 2021

    14.3. Current and Future Market Value (US$ Million) Analysis and Forecast By Region, 2022 to 2032

        14.3.1. By Country

            14.3.1.1. GCC Countries

            14.3.1.2. South Africa

            14.3.1.3. Israel

            14.3.1.4. Rest of Middle East and Africa (MEA)

        14.3.2. By Product

        14.3.3. By Distribution Channel

        14.3.4. By Gender

    14.4. Market Attractiveness Analysis

        14.4.1. By Country

        14.4.2. By Product

        14.4.3. By Distribution Channel

        14.4.4. By Gender

15. Market Structure Analysis

    15.1. Market Analysis By Tier Of Companies

    15.2. Market Concentration

    15.3. Market Share Analysis Of Top Players

    15.4. Market Presence Analysis

16. Competition Analysis

    16.1. Competition Dashboard

    16.2. Competition Benchmarking

    16.3. Competition Deep Dive

    16.4. La Prairie

        16.4.1. Company Overview

        16.4.2. Product Overview

        16.4.3. SWOT Analysis

        16.4.4. Key Developments

    16.5. Amala

        16.5.1. Company Overview

        16.5.2. Product Overview

        16.5.3. SWOT Analysis

        16.5.4. Key Developments

    16.6. Tatcha

        16.6.1. Company Overview

        16.6.2. Product Overview

        16.6.3. SWOT Analysis

        16.6.4. Key Developments

    16.7. Cle de Peau

        16.7.1. Company Overview

        16.7.2. Product Overview

        16.7.3. SWOT Analysis

        16.7.4. Key Developments

    16.8. Merle Norman

        16.8.1. Company Overview

        16.8.2. Product Overview

        16.8.3. SWOT Analysis

        16.8.4. Key Developments

    16.9. The A Method

        16.9.1. Company Overview

        16.9.2. Product Overview

        16.9.3. SWOT Analysis

        16.9.4. Key Developments

    16.10. Chantecallie

        16.10.1. Company Overview

        16.10.2. Product Overview

        16.10.3. SWOT Analysis

        16.10.4. Key Developments

    16.11. Physicians Formula

        16.11.1. Company Overview

        16.11.2. Product Overview

        16.11.3. SWOT Analysis

        16.11.4. Key Developments

    16.12. Keys Soulcare

        16.12.1. Company Overview

        16.12.2. Product Overview

        16.12.3. SWOT Analysis

        16.12.4. Key Developments

    16.13. Peter Thomas Roth

        16.13.1. Company Overview

        16.13.2. Product Overview

        16.13.3. SWOT Analysis

        16.13.4. Key Developments

    16.14. Kensko Skin

        16.14.1. Company Overview

        16.14.2. Product Overview

        16.14.3. SWOT Analysis

        16.14.4. Key Developments

    16.15. 111Skin

        16.15.1. Company Overview

        16.15.2. Product Overview

        16.15.3. SWOT Analysis

        16.15.4. Key Developments

17. Assumptions And Acronyms Used

18. Research Methodology

Don't pay for what you don't need

Customize your report by selecting specific countries or regions and save 30%!

List of Tables

Table 01: Global Market Value (US$ Million) Analysis, by Product, 2016 to 2021

Table 02: Global Market Value (US$ Million) Analysis, by Product, 2022 to 2032

Table 03: Global Market Value (US$ Million) Opportunity Analysis, by Product, 2022 to 2032

Table 04: Global Market Value (US$ Million) Analysis, by Distribution Channel, 2016 to 2021

Table 05: Global Market Value (US$ Million) Analysis, by Distribution Channel, 2022 to 2032

Table 06: Global Market Value (US$ Million) Opportunity Analysis, by Distribution Channel, 2022 to 2032

Table 07: Global Market Value (US$ Million) Analysis, by Gender, 2016 to 2021

Table 08: Global Market Value (US$ Million) Analysis, by Gender, 2022 to 2032

Table 09: Global Market Value (US$ Million) Opportunity Analysis, by Gender, 2022 to 2032

Table 10: Global Market Value (US$ Million) Analysis, by Region, 2016 to 2021

Table 11: Global Market Value (US$ Million) Analysis, by Region, 2022 to 2032

Table 12: Global Market Value (US$ Million) Opportunity Analysis, by Region, 2022 to 2032

Table 13: North America Market Value (US$ Million) Analysis, by Country, 2016 to 2021

Table 14: North America Market Value (US$ Million) Analysis, by Country, 2022 to 2032

Table 15: North America Market Value (US$ Million) Opportunity Analysis, by Country, 2022 to 2032

Table 16: North America Market Value (US$ Million) Analysis, by Product, 2016 to 2021

Table 17: North America Market Value (US$ Million) Analysis, by Product, 2022 to 2032

Table 18: North America Market Value (US$ Million) Opportunity Analysis, by Product, 2022 to 2032

Table 19: North America Market Value (US$ Million) Analysis, by Distribution Channel, 2016 to 2021

Table 20: North America Market Value (US$ Million) Analysis, by Distribution Channel, 2022 to 2032

Table 21: North America Market Value (US$ Million) Opportunity Analysis, by Distribution Channel, 2022 to 2032

Table 22: North America Market Value (US$ Million) Analysis, by Gender, 2016 to 2021

Table 23: North America Market Value (US$ Million) Analysis, by Gender, 2022 to 2032

Table 24: North America Market Value (US$ Million) Opportunity Analysis, by Gender, 2022 to 2032

Table 25: Latin America Market Value (US$ Million) Analysis, by Country, 2016 to 2021

Table 26: Latin America Market Value (US$ Million) Analysis, by Country, 2022 to 2032

Table 27: Latin America Market Value (US$ Million) Opportunity Analysis, by Country, 2022 to 2032

Table 28: Latin America Market Value (US$ Million) Analysis, by Product, 2016 to 2021

Table 29: Latin America Market Value (US$ Million) Analysis, by Product, 2022 to 2032

Table 30: Latin America Market Value (US$ Million) Opportunity Analysis, by Product, 2022 to 2032

Table 31: Latin America Market Value (US$ Million) Analysis, by Distribution Channel, 2016 to 2021

Table 32: Latin America Market Value (US$ Million) Analysis, by Distribution Channel, 2022 to 2032

Table 33: Latin America Market Value (US$ Million) Opportunity Analysis, by Distribution Channel, 2022 to 2032

Table 34: Latin America Market Value (US$ Million) Analysis, by Gender, 2016 to 2021

Table 35: Latin America Market Value (US$ Million) Analysis, by Gender, 2022 to 2032

Table 36: Latin America Market Value (US$ Million) Opportunity Analysis, by Gender, 2022 to 2032

Table 37: Europe Market Value (US$ Million) Analysis, by Country, 2016 to 2021

Table 38: Europe Market Value (US$ Million) Analysis, by Country, 2022 to 2032

Table 39: Europe Market Value (US$ Million) Opportunity Analysis, by Country, 2022 to 2032

Table 40: Europe Market Value (US$ Million) Analysis, by Product, 2016 to 2021

Table 41: Europe Market Value (US$ Million) Analysis, by Product, 2022 to 2032

Table 42: Europe Market Value (US$ Million) Opportunity Analysis, by Product, 2022 to 2032

Table 43: Europe Market Value (US$ Million) Analysis, by Distribution Channel, 2016 to 2021

Table 44: Europe Market Value (US$ Million) Analysis, by Distribution Channel, 2022 to 2032

Table 45: Europe Market Value (US$ Million) Opportunity Analysis, by Distribution Channel, 2022 to 2032

Table 46: Europe Market Value (US$ Million) Analysis, by Gender, 2016 to 2021

Table 47: Europe Market Value (US$ Million) Analysis, by Gender, 2022 to 2032

Table 48: Europe Market Value (US$ Million) Opportunity Analysis, by Gender, 2022 to 2032

Table 49: East Asia Market Value (US$ Million) Analysis, by Country, 2016 to 2021

Table 50: East Asia Market Value (US$ Million) Analysis, by Country, 2022 to 2032

Table 51: East Asia Market Value (US$ Million) Opportunity Analysis, by Country, 2022 to 2032

Table 52: East Asia Market Value (US$ Million) Analysis, by Product, 2016 to 2021

Table 53: East Asia Market Value (US$ Million) Analysis, by Product, 2022 to 2032

Table 54: East Asia Market Value (US$ Million) Opportunity Analysis, by Product, 2022 to 2032

Table 55: East Asia Market Value (US$ Million) Analysis, by Distribution Channel, 2016 to 2021

Table 56: East Asia Market Value (US$ Million) Analysis, by Distribution Channel, 2022 to 2032

Table 57: East Asia Market Value (US$ Million) Opportunity Analysis, by Distribution Channel, 2022 to 2032

Table 58: East Asia Market Value (US$ Million) Analysis, by Gender, 2016 to 2021

Table 59: East Asia Market Value (US$ Million) Analysis, by Gender, 2022 to 2032

Table 60: East Asia Market Value (US$ Million) Opportunity Analysis, by Gender, 2022 to 2032

Table 61: South Asia & Oceania Market Value (US$ Million) Analysis, by Country, 2016 to 2021

Table 62: South Asia & Oceania Market Value (US$ Million) Analysis, by Country, 2022 to 2032

Table 63: South Asia & Oceania Market Value (US$ Million) Opportunity Analysis, by Country, 2022 to 2032

Table 64: South Asia & Oceania Market Value (US$ Million) Analysis, by Product, 2016 to 2021

Table 65: South Asia & Oceania Market Value (US$ Million) Analysis, by Product, 2022 to 2032

Table 66: South Asia & Oceania Market Value (US$ Million) Opportunity Analysis, by Product, 2022 to 2032

Table 67: South Asia & Oceania Market Value (US$ Million) Analysis, by Distribution Channel, 2016 to 2021

Table 68: South Asia & Oceania Market Value (US$ Million) Analysis, by Distribution Channel, 2022 to 2032

Table 69: South Asia & Oceania Market Value (US$ Million) Opportunity Analysis, by Distribution Channel, 2022 to 2032

Table 70: South Asia & Oceania Market Value (US$ Million) Analysis, by Gender, 2016 to 2021

Table 71: South Asia & Oceania Market Value (US$ Million) Analysis, by Gender, 2022 to 2032

Table 72: South Asia & Oceania Market Value (US$ Million) Opportunity Analysis, by Gender, 2022 to 2032

Table 73: Middle East and Africa Market Value (US$ Million) Analysis, by Country, 2016 to 2021

Table 74: Middle East and Africa Market Value (US$ Million) Analysis, by Country, 2022 to 2032

Table 75: Middle East and Africa Market Value (US$ Million) Opportunity Analysis, by Country, 2022 to 2032

Table 76: Middle East and Africa Market Value (US$ Million) Analysis, by Product, 2016 to 2021

Table 77: Middle East and Africa Market Value (US$ Million) Analysis, by Product, 2022 to 2032

Table 78: Middle East and Africa Market Value (US$ Million) Opportunity Analysis, by Product, 2022 to 2032

Table 79: Middle East and Africa Market Value (US$ Million) Analysis, by Distribution Channel, 2016 to 2021

Table 80: Middle East and Africa Market Value (US$ Million) Analysis, by Distribution Channel, 2022 to 2032

Table 81: Middle East and Africa Market Value (US$ Million) Opportunity Analysis, by Distribution Channel, 2022 to 2032

Table 82: Middle East and Africa Market Value (US$ Million) Analysis, by Gender, 2016 to 2021

Table 83: Middle East and Africa Market Value (US$ Million) Analysis, by Gender, 2022 to 2032

Table 84: Middle East and Africa Market Value (US$ Million) Opportunity Analysis, by Gender, 2022 to 2032
Sneha Verghese
Sneha Verghese

Principal Consultant

Talk to Analyst

Find your sweet spots for generating winning opportunities in this market.

List of Charts

Figure 01: Global Market Value (US$ Million) Historical Analysis, 2016 to 2021

Figure 02: Global Market Value (US$ Million) Forecast and Analysis, 2022 to 2032

Figure 03: Global Market Value Y-o-Y Growth and Forecast, 2016 to 2032

Figure 04: Global Market Incremental $ Opportunity, 2022 to 2032

Figure 05: Global Market Share and BPS Analysis by Product, 2022 & 2032

Figure 06: Global Market Y-o-Y Growth Projections by Product, 2022 to 2032

Figure 07: Global Market Attractiveness Analysis by Product, 2022 to 2032

Figure 08: Global Market Share and BPS Analysis by Distribution Channel, 2022 & 2032

Figure 09: Global Market Y-o-Y Growth Projections by Distribution Channel, 2022 to 2032

Figure 10: Global Market Attractiveness Analysis by Distribution Channel, 2022 to 2032

Figure 11: Global Market Share and BPS Analysis by Gender, 2022 & 2032

Figure 12: Global Market Y-o-Y Growth Projections by Gender, 2022 to 2032

Figure 13: Global Market Attractiveness Analysis by Gender, 2022 to 2032

Figure 14: Global Market Share and BPS Analysis by Region, 2022 & 2032

Figure 15: Global Market Y-o-Y Growth Projections by Region, 2022 to 2032

Figure 16: Global Market Attractiveness Analysis by Region, 2022 to 2032

Figure 17: North America Market Value (US$ Million) Historical Analysis, 2016 to 2021

Figure 18: North America Market Value (US$ Million) Forecast and Analysis, 2022 to 2032

Figure 19: North America Market Value Y-o-Y Growth and Forecast, 2032

Figure 20: North America Market Incremental $ Opportunity, 2022 to 2032

Figure 21: North America Market Share Analysis by Country, 2022 & 2032

Figure 22: North America Market Y-o-Y Growth Projection by Country, 2022 to 2032

Figure 23: North America Market Attractiveness Analysis by Country, 2022 to 2032

Figure 24: North America Market Share and BPS Analysis by Product, 2022 & 2032

Figure 25: North America Market Y-o-Y Growth Projections by Product, 2022 to 2032

Figure 26: North America Market Attractiveness Analysis by Product, 2022 to 2032

Figure 27: North America Market Share and BPS Analysis by Distribution Channel, 2022 & 2032

Figure 28: North America Market Y-o-Y Growth Projections by Distribution Channel, 2022 to 2032

Figure 29: North America Market Attractiveness Analysis by Distribution Channel, 2022 to 2032

Figure 30: North America Market Share and BPS Analysis by Gender, 2022 & 2032

Figure 31: North America Market Y-o-Y Growth Projections by Gender, 2022 to 2032

Figure 32: North America Market Attractiveness Analysis by Gender, 2022 to 2032

Figure 33: Latin America Market Value (US$ Million) Historical Analysis, 2016 to 2021

Figure 34: Latin America Market Value (US$ Million) Forecast and Analysis, 2022 to 2032

Figure 35: Latin America Market Value Y-o-Y Growth and Forecast, 2016 to 2032

Figure 36: Latin America Market Incremental $ Opportunity, 2022 to 2032

Figure 37: Latin America Market Share Analysis by Country, 2022 & 2032

Figure 38: Latin America Market Y-o-Y Growth Projection by Country, 2022 to 2032

Figure 39: Latin America Market Attractiveness Analysis by Country, 2022 to 2032

Figure 40: Latin America Market Share and BPS Analysis by Product, 2022 & 2032

Figure 41: Latin America Market Y-o-Y Growth Projections by Product, 2022 to 2032

Figure 42: Latin America Market Attractiveness Analysis by Product, 2022 to 2032

Figure 43: Latin America Market Share and BPS Analysis by Distribution Channel, 2022 & 2032

Figure 44: Latin America Market Y-o-Y Growth Projections by Distribution Channel, 2022 to 2032

Figure 45: Latin America Market Attractiveness Analysis by Distribution Channel, 2022 to 2032

Figure 46: Latin America Market Share and BPS Analysis by Gender, 2022 & 2032

Figure 47: Latin America Market Y-o-Y Growth Projections by Gender, 2022 to 2032

Figure 48: Latin America Market Attractiveness Analysis by Gender, 2022 to 2032

Figure 49: Europe Market Value (US$ Million) Historical Analysis, 2016 to 2021

Figure 50: Europe Market Value (US$ Million) Forecast and Analysis, 2022 to 2032

Figure 51: Europe Market Value Y-o-Y Growth and Forecast, 2016 to 2032

Figure 52: Europe Market Incremental $ Opportunity, 2022 to 2032

Figure 53: Europe Market Share Analysis by Country, 2022 & 2032

Figure 54: Europe Market Y-o-Y Growth Projection by Country, 2022 to 2032

Figure 55: Europe Market Attractiveness Analysis by Country, 2022 to 2032

Figure 56: Europe Market Share and BPS Analysis by Product, 2022 & 2032

Figure 57: Europe Market Y-o-Y Growth Projections by Product, 2022 to 2032

Figure 58: Europe Market Attractiveness Analysis by Product, 2022 to 2032

Figure 59: Europe Market Share and BPS Analysis by Distribution Channel, 2022 & 2032

Figure 60: Europe Market Y-o-Y Growth Projections by Distribution Channel, 2022 to 2032

Figure 61: Europe Market Attractiveness Analysis by Distribution Channel, 2022 to 2032

Figure 62: Europe Market Share and BPS Analysis by Gender, 2022 & 2032

Figure 63: Europe Market Y-o-Y Growth Projections by Gender, 2022 to 2032

Figure 64: Europe Market Attractiveness Analysis by Gender, 2022 to 2032

Figure 65: East Asia Market Value (US$ Million) Historical Analysis, 2016 to 2021

Figure 66: East Asia Market Value (US$ Million) Forecast and Analysis, 2022 to 2032

Figure 67: East Asia Market Value Y-o-Y Growth and Forecast, 2016 to 2032

Figure 68: East Asia Market Incremental $ Opportunity, 2022 to 2032

Figure 69: East Asia Market Share Analysis by Country, 2022 & 2032

Figure 70: East Asia Market Y-o-Y Growth Projection by Country, 2022 to 2032

Figure 71: East Asia Market Attractiveness Analysis by Country, 2022 to 2032

Figure 72: East Asia Market Share and BPS Analysis by Product, 2022 & 2032

Figure 73: East Asia Market Y-o-Y Growth Projections by Product, 2022 to 2032

Figure 74: East Asia Market Attractiveness Analysis by Product, 2022 to 2032

Figure 75: East Asia Market Share and BPS Analysis by Distribution Channel, 2022 & 2032

Figure 76: East Asia Market Y-o-Y Growth Projections by Distribution Channel, 2022 to 2032

Figure 77: East Asia Market Attractiveness Analysis by Distribution Channel, 2022 to 2032

Figure 78: East Asia Market Share and BPS Analysis by Gender, 2022 & 2032

Figure 79: East Asia Market Y-o-Y Growth Projections by Gender, 2022 to 2032

Figure 80: East Asia Market Attractiveness Analysis by Gender, 2022 to 2032

Figure 81: South Asia & Oceania Market Value (US$ Million) Historical Analysis, 2016 to 2021

Figure 82: South Asia & Oceania Market Value (US$ Million) Forecast and Analysis, 2022 to 2032

Figure 83: South Asia & Oceania Market Value Y-o-Y Growth and Forecast, 2016 to 2032

Figure 84: South Asia & Oceania Market Incremental $ Opportunity, 2022 to 2032

Figure 85: South Asia & Oceania Market Share Analysis by Country, 2022 & 2032

Figure 86: South Asia & Oceania Market Y-o-Y Growth Projection by Country, 2022 to 2032

Figure 87: South Asia & Oceania Market Attractiveness Analysis by Country, 2022 to 2032

Figure 88: South Asia & Oceania Market Share and BPS Analysis by Product, 2022 & 2032

Figure 89: South Asia & Oceania Market Y-o-Y Growth Projections by Product, 2022 to 2032

Figure 90: South Asia & Oceania Market Attractiveness Analysis by Product, 2022 to 2032

Figure 91: South Asia & Oceania Market Share and BPS Analysis by Distribution Channel, 2022 & 2032

Figure 92: South Asia & Oceania Market Y-o-Y Growth Projections by Distribution Channel, 2022 to 2032

Figure 93: South Asia & Oceania Market Attractiveness Analysis by Distribution Channel, 2022 to 2032

Figure 94: South Asia & Oceania Market Share and BPS Analysis by Gender, 2022 & 2032

Figure 95: South Asia & Oceania Market Y-o-Y Growth Projections by Gender, 2022 to 2032

Figure 96: South Asia & Oceania Market Attractiveness Analysis by Gender, 2022 to 2032

Figure 97: Middle East and Africa Market Value (US$ Million) Historical Analysis, 2016 to 2021

Figure 98: Middle East and Africa Market Value (US$ Million) Forecast and Analysis, 2022 to 2032

Figure 99: Middle East and Africa Market Value Y-o-Y Growth and Forecast, 2016 to 2032

Figure 100: Middle East and Africa Market Incremental $ Opportunity, 2022 to 2032

Figure 101: Middle East and Africa Market Share Analysis by Country, 2022 & 2032

Figure 102: Middle East and Africa Market Y-o-Y Growth Projection by Country, 2022 to 2032

Figure 103: Middle East and Africa Market Attractiveness Analysis by Country, 2022 to 2032

Figure 104: Middle East and Africa Market Share and BPS Analysis by Product, 2022 & 2032

Figure 105: Middle East and Africa Market Y-o-Y Growth Projections by Product, 2022 to 2032

Figure 106: Middle East and Africa Market Attractiveness Analysis by Product, 2022 to 2032

Figure 107: Middle East and Africa Market Share and BPS Analysis by Distribution Channel, 2022 & 2032

Figure 108: Middle East and Africa Market Y-o-Y Growth Projections by Distribution Channel, 2022 to 2032

Figure 109: Middle East and Africa Market Attractiveness Analysis by Distribution Channel, 2022 to 2032

Figure 110: Middle East and Africa Market Share and BPS Analysis by Gender, 2022 & 2032

Figure 111: Middle East and Africa Market Y-o-Y Growth Projections by Gender, 2022 to 2032

Figure 112: Middle East and Africa Market Attractiveness Analysis by Gender, 2022 to 2032

Recommendations

Food and Beverage

Herb Infused Water Market

Published : May 2023

Explore Consumer Product Insights

View Reports

Gold Infused Skin Care Market