CBD-Infused Skincare Market Size and Share Forecast Outlook 2025 to 2035

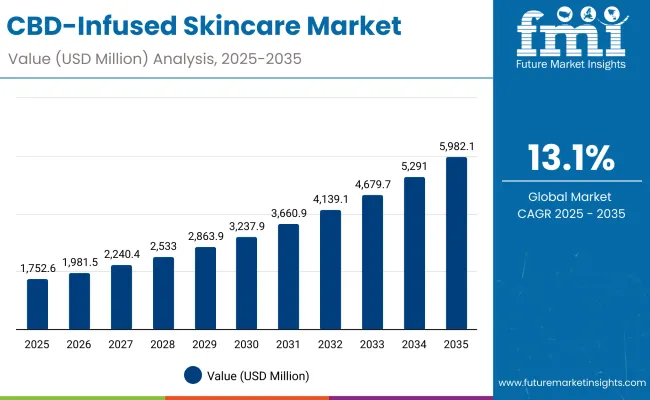
The Global CBD-Infused Skincare Market is expected to record a valuation of USD 1,752.6 million in 2025 and USD 5,982.1 million in 2035, with an increase of USD 4,229.5 million, which equals a growth of more than 240% over the decade. The overall expansion represents a CAGR of 13.1% and more than a 3X increase in market size.
Cbd Infused Skincare Market

Quick Stats for Global CBD-Infused Skincare Market

  • Global CBD-Infused Skincare Market Value (2025): USD 1,752.6 million
  • Global CBD-Infused Skincare Market Forecast Value (2035): USD 5,982.1 million
  • Global CBD-Infused Skincare Market Forecast CAGR: 13.1%
  • Leading Segment in Global CBD-Infused Skincare Market in 2025: Anti-inflammatory (53.5%)
  • Key Growth Regions in the Global CBD-Infused Skincare Market: Asia-Pacific (China, India, Japan), North America (U.S.), Europe (Germany, UK)
  • Top Key Players in Global CBD-Infused Skincare Market: CBDfx, Kiehl’s, Lord Jones, Cannuka, Elixinol, Endoca, Charlotte’s Web, Medterra, Vertly, The Body Shop

Global CBD-Infused Skincare Market Key Takeaways

Metric Value
Global CBD-Infused Skincare Market Estimated Value in (2025E) USD 1,752.6 million
Global CBD-Infused Skincare Market Forecast Value in (2035F) USD 5,982.1 million
Forecast CAGR (2025 to 2035) 13.1%

During the first five-year period from 2025 to 2030, the market increases from USD 1,752.6 million to USD 3,237.9 million, adding USD 1,485.3 million, which accounts for about 35% of the total decade growth. This phase records steady adoption across anti-inflammatory and acne/blemish care products, driven by growing consumer awareness of CBD’s natural soothing properties, its effectiveness in reducing redness and irritation, and its increasing presence in dermatologist-tested formulations. Anti-inflammatory products dominate this period as they cater to more than half of consumer demand, positioning CBD as a go-to solution for inflammation-prone skin.

The second half from 2030 to 2035 contributes USD 2,744.2 million, equal to 65% of total growth, as the market jumps from USD 3,237.9 million to USD 5,982.1 million. This acceleration is powered by widespread consumer acceptance of CBD-infused skincare as a mainstream beauty category, with expanding claims such as vegan, natural/organic, and clean-label creating differentiation in the premium skincare segment.

E-commerce channels expand rapidly during this period, supported by D2C models and social media-led beauty communities. Regional growth is most pronounced in Asia-Pacific, with China and India recording CAGR above 20%, while Japan significantly increases its global share by 2035.

From 2020 to 2024, the Global CBD-Infused Skincare Market grew steadily from niche adoption to broader awareness, with much of the growth concentrated in early-stage launches across North America and Western Europe.

During this period, the competitive landscape was dominated by emerging specialist brands controlling over 80% of revenue, while legacy cosmetic companies were still experimenting with limited CBD-infused product lines. Differentiation relied heavily on positioning around purity, plant-based sourcing, and boutique distribution channels, while large-scale retail presence remained limited.

Demand for CBD-Infused Skincare will expand to USD 1,752.6 million in 2025, and the revenue mix will shift as mainstream brands scale up offerings, and consumer preferences increasingly emphasize natural/organic and vegan claims. Traditional beauty giants such as The Body Shop and Kiehl’s face rising competition from digital-first CBD brands such as CBDfx, Cannuka, and Vertly, which leverage influencer marketing, e-commerce exclusivity, and community-based engagement.

Larger hemp-based companies like Charlotte’s Web and Medterra are entering the skincare category as a natural adjacency to supplements, highlighting cross-category synergies. Competitive advantage is moving away from niche branding alone to credibility, dermatologist endorsements, and multi-channel distribution.

Why the Global CBD-Infused Skincare Market is growing?

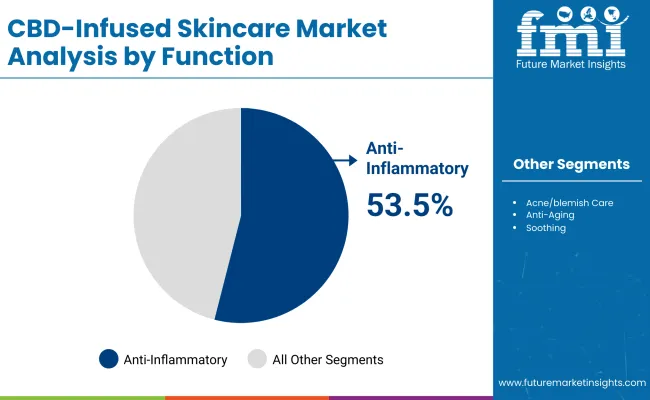
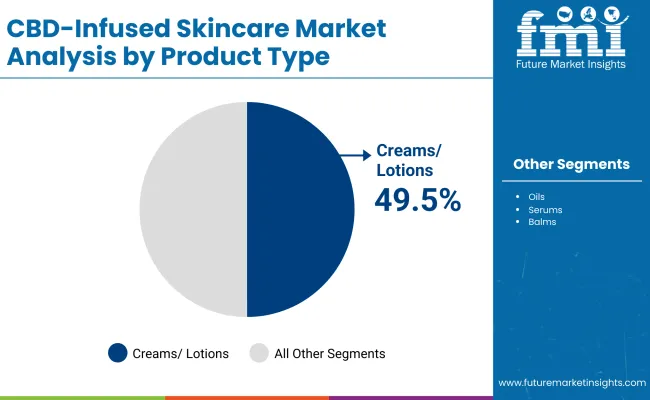
Advances in plant-based ingredient extraction and formulation science have improved the quality, stability, and safety of CBD-infused products, allowing them to compete directly with mainstream skincare. Anti-inflammatory properties of CBD make it particularly appealing to consumers with sensitive, acne-prone, or redness-prone skin, explaining why the anti-inflammatory segment alone accounts for 53.5% of market share in 2025. The rise of creams and lotions (49.5% share in 2025) reflects CBD’s integration into daily-use products, ensuring wider penetration across diverse consumer groups.

The expansion of natural/organic claims (50.5% share in 2025) highlights growing alignment with the global clean beauty movement. Consumers increasingly reject artificial additives, parabens, and harsh chemicals, opting instead for CBD-infused products marketed as vegan, organic, and eco-friendly. This trend is particularly strong in China and India, where middle-class consumers are actively trading up to premium natural formulations.

Global growth is also fueled by increasing mainstream accessibility. E-commerce platforms, pharmacy chains, and specialty beauty stores are amplifying CBD brand visibility, while mass retail is beginning to stock CBD-infused lines alongside traditional skincare. In the USA, regulatory clarity has encouraged new launches, while in Asia-Pacific, progressive acceptance of CBD cosmetics is creating a demand surge, especially in China, India, and Japan.

Segmental Analysis

The market is segmented by function, product type, channel, and claim, reflecting consumer-driven adoption dynamics. Functions include anti-inflammatory, acne/blemish care, anti-aging, and soothing, highlighting CBD’s versatility in addressing multiple skin concerns.

Product types cover creams/lotions, oils, serums, and balms, offering formats ranging from everyday use to specialized treatments. Channels include e-commerce, pharmacies, mass retail, and specialty beauty stores, underscoring CBD’s shift from niche to mainstream. Claims include natural/organic, vegan, clean-label, and dermatologist-tested, signifying how consumer trust is built in this emerging category.
Insights into the Function Segment with Anti-inflammatory Leading in Market Share

Cbd Infused Skincare Market By Function

Function Value Share % 2025
Anti-inflammatory 53.5%
Others 46.5%

The anti-inflammatory segment is projected to contribute over half of the Global CBD-Infused Skincare Market revenue in 2025, maintaining its lead as the dominant function category. This is driven by CBD’s proven efficacy in calming redness, reducing swelling, and managing irritation, which resonates strongly with consumers facing sensitive skin conditions.

The segment’s growth is also supported by rising demand from younger consumers seeking acne solutions, and older demographics valuing anti-aging benefits linked to reduced inflammation. As clinical research progresses and consumer trust deepens, anti-inflammatory formulations are expected to remain the cornerstone of CBD skincare adoption worldwide.
Insights into the Product Type Segment with Creams and Lotions Dominating the Demand

Cbd Infused Skincare Market By Product Type

Product Type Value Share % 2025
Creams/lotions 49.5%
Others 50.5%

The creams and lotions segment is forecasted to hold the largest share of the market in 2025, led by their role as daily-use skincare essentials. These products are favored for their versatility and compatibility with multiple skin types, making them ideal for mass adoption. Their wide retail availability in pharmacies, e-commerce, and specialty beauty stores enhances accessibility, fueling their dominant position.

Oils, serums, and balms are witnessing rapid uptake in premium and niche categories, with consumers associating them with concentrated benefits and luxury experiences. As CBD-infused product innovation evolves, these categories will continue expanding, but creams and lotions are expected to remain the most commercially significant format throughout the forecast period.
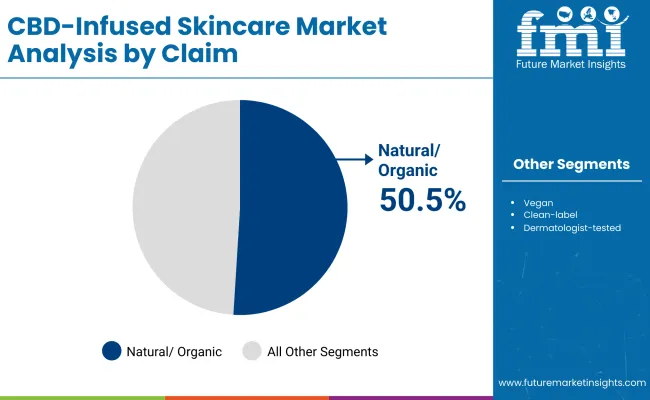
Insights into the Claim Segment with Natural/Organic Leading in Market Share

Cbd Infused Skincare Market Analysis By Claim

Claim Value Share % 2025
Natural/organic 50.5%
Others 49.5%

The natural/organic claim segment is projected to account for the largest share of the Global CBD-Infused Skincare Market in 2025. This leadership reflects a strong consumer shift toward clean beauty, where sustainability, plant-derived actives, and ethical sourcing are prioritized. CBD-infused products marketed under natural/organic and vegan positioning enjoy higher consumer trust and premium acceptance, particularly in APAC and Europe.

As regulatory frameworks evolve and consumer awareness grows, dermatologist-tested claims will gain more relevance, bridging the gap between niche CBD brands and mainstream cosmetic giants. By 2035, clean-label and organic CBD formulations are expected to command premium pricing and higher loyalty rates, cementing their role in driving market expansion.

What are the Drivers, Restraints, and Key Trends of the Global CBD-Infused Skincare Market?

Drivers

Rising Scientific Validation and Dermatologist Endorsements

One of the strongest drivers in the Global CBD-Infused Skincare Market is the increasing clinical validation of CBD’s anti-inflammatory and antioxidant properties, paired with a growing number of dermatologist endorsements. Consumers no longer perceive CBD skincare as just a wellness fad; instead, they see it as a functional, scientifically-backed ingredient.

This shift is crucial because 53.5% of the market value in 2025 is concentrated in anti-inflammatory products, which are especially relevant to conditions like acne, eczema, and rosacea. Major dermatology associations in the USA and Europe have started acknowledging CBD’s potential benefits for topical use, improving trust among both medical professionals and consumers.

As a result, dermatologist-tested product claims are gaining traction, and mainstream retail chains are more willing to dedicate shelf space to CBD skincare. This convergence of clinical credibility and retail availability is fueling consumer adoption at scale.

Mainstream Beauty Retail Integration Across Channels

Another critical driver is the integration of CBD skincare into mainstream beauty retail channels, especially in pharmacies, mass retail, and specialty beauty stores. Initially, CBD products were confined to niche e-commerce stores and wellness boutiques, but regulatory clarity in the USA and progressive acceptance in Europe and Asia-Pacific are changing this dynamic.

Brands like The Body Shop and Kiehl’s are already using their established retail presence to normalize CBD skincare, and e-commerce platforms are amplifying the trend with global accessibility. This retail integration matters because it helps CBD products shed the stigma of being “alternative” or “underground.”

It also exposes a broader demographic of consumers particularly older buyers in Europe and Asia who prefer pharmacy-backed trust to CBD-based products. This mainstreaming effect is a long-term growth driver, ensuring that CBD skincare is positioned not just as a niche segment but as a legitimate category within the global beauty market.

Restraints

Regulatory Fragmentation and Cross-Border Barriers

Despite growing acceptance, the market is still restrained by fragmented regulatory frameworks across regions. While the USA and parts of Europe allow topical CBD use, many countries in Asia-Pacific and the Middle East still impose restrictions or maintain legal ambiguity. For instance, China shows the highest CAGR of 22.2%, yet only CBD isolate (THC-free) has regulatory clearance for cosmetics, creating barriers for full-spectrum formulations that dominate in North America.

This inconsistent policy landscape forces brands to maintain separate formulations and packaging for different markets, which increases costs and complicates global expansion. It also limits the ability of smaller brands like Vertly or Cannuka to scale internationally, as compliance costs eat into profitability.

Consumer Perception Challenges and Stigma

Another major restraint is the lingering consumer stigma surrounding cannabis-derived ingredients. Even though CBD is non-psychoactive, many consumers especially in conservative markets such as India and Germany still associate it with recreational marijuana use.

This perception limits adoption in mass retail and pharmacy channels where consumer trust is critical. In fact, despite India recording the fastest CAGR at 23.7%, mainstream buyers remain hesitant, and early adoption is concentrated among urban millennials and premium e-commerce shoppers.

Overcoming stigma requires heavy investment in education campaigns, transparent labeling (vegan, clean-label, THC-free), and dermatologist-tested claims. Until perception gaps are fully bridged, CBD skincare adoption will remain skewed toward younger and more progressive consumers.

Key Trends

Rise of Hybrid Claims: Clean-Label, Vegan, and CBD-Infused

A notable trend is the emergence of hybrid product claims, where CBD is positioned alongside vegan, clean-label, natural/organic, and dermatologist-tested attributes. In 2025, natural/organic claims already command 50.5% of the market value (USD 858.6 million), and this figure is expected to rise sharply as consumers demand multi-layered trust signals.

Brands are responding by blending CBD with other trending actives such as hyaluronic acid, retinol alternatives, and niacinamide, while marketing them under vegan and cruelty-free banners. This not only widens the appeal of CBD products but also allows brands to compete in the broader premium skincare and clean beauty categories, moving beyond the CBD niche.

Asia-Pacific as the Growth Powerhouse for CBD Skincare

The second defining trend is the regional growth shift toward Asia-Pacific, led by China, India, and Japan. Together, these markets are projected to record CAGR levels of 22.2%, 23.7%, and 18.8%, respectively, far above the global average of 13.1%. This surge is driven by rising middle-class incomes, digital-first shopping behavior, and increasing openness to plant-based beauty solutions.

China, in particular, is witnessing rapid adoption in e-commerce-led beauty sales, with 56.2% of demand in 2025 linked to natural/organic claims. Japan is moving CBD skincare into premium channels, while India’s rapid CAGR reflects a demographic shift where young consumers are embracing CBD products as part of modern wellness.

By 2035, Asia-Pacific will be the epicenter of CBD skincare growth, with local regulations gradually evolving to accommodate this demand surge.
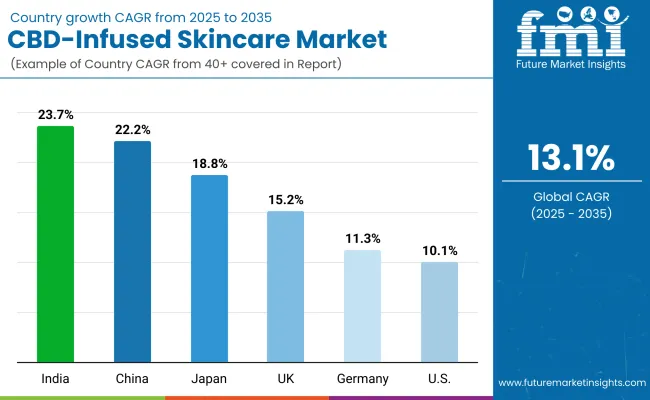
Analysis of Global CBD-Infused Skincare Market By Key Countries

Cbd Infused Skincare Market Country Wise Analysis

Country Estimated CAGR (2025 to 2035)
China 22.2%
USA 10.1%
India 23.7%
UK 15.2%
Germany 11.3%
Japan 18.8%

The Global CBD-Infused Skincare Market shows distinct country-level growth trajectories, with India (23.7%) and China (22.2%) leading as the fastest-growing markets from 2025 to 2035. In India, rapid adoption is being fueled by urban millennial consumers who favor natural/organic and vegan beauty products, alongside rising disposable incomes and digital-first purchasing behaviors.

The wellness-driven perception of CBD, aligned with Ayurveda-inspired plant-based preferences, is enabling faster acceptance compared to Western markets. Similarly, China is positioned as a growth powerhouse due to regulatory acceptance of CBD isolate in cosmetics, a surge in clean beauty claims (56.2% share in 2025), and strong e-commerce-led retail ecosystems that amplify consumer reach. Both countries reflect how Asia-Pacific is transforming into the central hub for CBD skincare innovation and expansion, outpacing more mature Western markets.

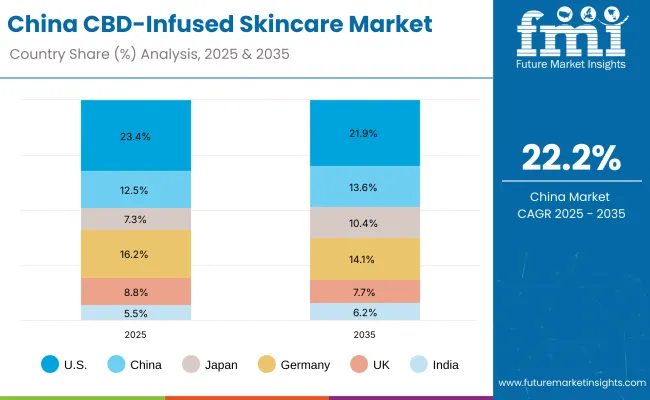
In contrast, developed markets like the USA (10.1%) and Germany (11.3%) are growing at a slower pace due to market maturity, regulatory complexities, and lingering consumer skepticism around cannabis-derived products. The USA, while still the largest single market contributor in 2025 with a 23.4% share, will see its relative share decline to 21.9% by 2035, as Asia-Pacific markets accelerate.

The UK (15.2%) and Japan (18.8%) reflect moderate-to-strong growth driven by premium skincare adoption and expanding retail acceptance of CBD-infused beauty lines. Japan’s shift is particularly notable, with its CAGR indicating a strong consumer pivot toward anti-aging and dermatologist-tested CBD skincare, while the UK benefits from an established clean beauty movement.

Collectively, these differences highlight how regional adoption patterns are diverging, with Asia-Pacific markets setting the pace for global CBD skincare expansion while Western countries consolidate and refine existing demand.
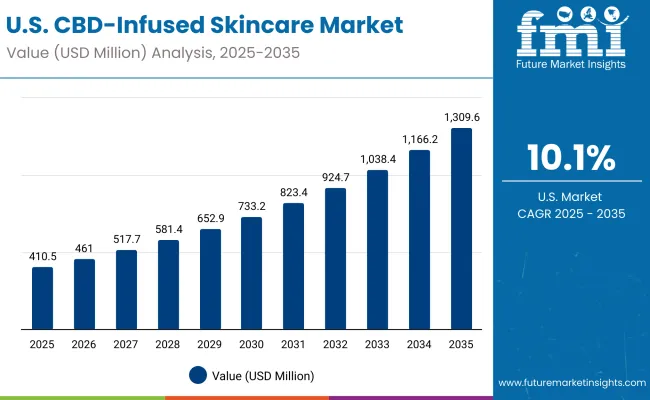
Sales Outlook for CBD-Infused Skincare in the United States

Usa Cbd Infused Skincare Market

Year USA CBD-Infused Skincare Market (USD Million)
2025 410.5
2026 461.0
2027 517.7
2028 581.4
2029 652.9
2030 733.2
2031 823.4
2032 924.7
2033 1,038.5
2034 1,166.2
2035 1,309.7

The Global CBD-Infused Skincare Market in the United States is projected to grow at a CAGR of 10.1%, supported by rising demand for anti-inflammatory and dermatologist-tested skincare solutions. Reverse migration from niche cannabis dispensaries into mainstream pharmacies and mass retail chains is expanding accessibility.

Product positioning around acne/blemish care and soothing formulations is gaining traction among younger consumers, while older demographics are increasingly adopting CBD-based anti-aging solutions. Digital-native brands are building strong momentum in e-commerce, but partnerships with dermatologists and established retailers are accelerating category legitimacy.

  • Anti-inflammatory creams are the largest use case, holding 55.2% of market share in 2025.
  • Pharmacies are strengthening category credibility by stocking dermatologist-tested CBD skincare.
  • E-commerce-first players are expanding reach with bundled offers and subscription models.

Growth and Expansion Outlook for CBD-Infused Skincare in the United Kingdom

The Global CBD-Infused Skincare Market in the United Kingdom is expected to grow at a CAGR of 15.2%, supported by the country’s mature clean beauty movement and openness to natural/organic formulations. Premium skincare brands and high-street retailers have introduced CBD-infused lines, often positioned as vegan and cruelty-free.

Demand from urban consumers is rising, particularly in London and Manchester, where younger demographics are quick adopters of plant-based beauty. Institutional support through regulatory clarity on topical CBD use, combined with established specialty beauty retail chains, continues to accelerate expansion.

  • Premium beauty retailers are stocking vegan, organic CBD skincare as part of clean beauty portfolios.
  • Anti-aging CBD creams and serums are resonating with older consumers seeking natural alternatives.
  • Specialty beauty stores and online platforms are expanding accessibility beyond niche boutiques.

Growth and Expansion Outlook for CBD-Infused Skincare in India

India is witnessing the fastest growth in the Global CBD-Infused Skincare Market, with a forecast CAGR of 23.7% through 2035. Rising awareness in tier-1 and tier-2 cities is being fueled by younger consumers who associate CBD with plant-based wellness and Ayurvedic traditions.

Premium e-commerce platforms are playing a crucial role in category introduction, with international brands piloting CBD skincare lines for Indian consumers. Local start-ups are also exploring blends of CBD with traditional botanicals like turmeric and neem, appealing to the growing middle-class interest in hybrid wellness-beauty products. Regulatory barriers remain, but demand is expected to expand rapidly once clarity increases.
  • Urban millennials are driving adoption through e-commerce platforms offering premium CBD skincare.
  • Local innovation is combining CBD with Ayurvedic botanicals to appeal to cultural preferences.
  • Awareness campaigns are reshaping consumer perceptions and reducing stigma around cannabis-derived actives.

Sales Outlook for CBD-Infused Skincare in China

China Cbd Infused Skincare Market

The Global CBD-Infused Skincare Market in China is expected to grow at a CAGR of 22.2%, the second-highest among leading economies. Growth is driven by regulatory acceptance of CBD isolate in cosmetics, a surge in demand for natural/organic claims (56.2% share in 2025), and the country’s massive e-commerce infrastructure.

Domestic beauty brands are collaborating with online marketplaces like Tmall and JD.com to accelerate distribution, while global brands are targeting premium consumer segments. Municipal acceptance of CBD in skincare has enabled wider marketing campaigns, creating momentum for mass adoption.

  • E-commerce platforms are leading CBD skincare sales with curated online storefronts.
  • Natural/organic CBD creams are dominating demand, aligning with China’s clean beauty surge.
  • Local players are scaling aggressively with competitive pricing, challenging global brands.
Country 2025 Share (%)
USA 23.4%
China 12.5%
Japan 7.3%
Germany 16.2%
UK 8.8%
India 5.5%
Country 2035 Share (%)
USA 21.9%
China 13.6%
Japan 10.4%
Germany 14.1%
UK 7.7%
India 6.2%

Growth Outlook for CBD-Infused Skincare Market in USA

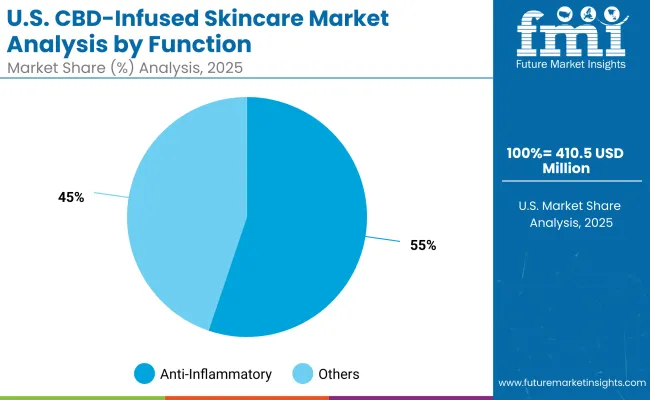
Usa Cbd Infused Skincare Market By Function

USA by Function Value Share % 2025
Anti-inflammatory 55.2%
Others 44.8%

The Global CBD-Infused Skincare Market in the United States is projected at USD 410.51 million in 2025, expanding to over USD 1,309.69 million by 2035, growing at a CAGR of 10.1%. Anti-inflammatory skincare dominates with a 55.2% share, reflecting CBD’s strong positioning as a solution for redness, irritation, and acne/blemish management.

This category resonates with both younger consumers seeking acne treatments and older demographics focused on inflammation-linked aging. The USA market shows balanced adoption across product formats, with creams and lotions leading everyday use, while oils and serums are positioned in premium e-commerce channels.

Growth is further supported by dermatologist endorsements, pharmacy-led distribution, and increased presence in mainstream retail. Partnerships between CBD-native brands and major pharmacy chains provide credibility, while direct-to-consumer players drive education and awareness. With strong e-commerce infrastructure and growing social media advocacy, the USA is expected to remain a cornerstone of global demand, though its share is gradually declining as Asia-Pacific accelerates.
  • Market in the USA holds 23.4% share in 2025 in the global market.
  • Anti-inflammatory leads strongly at 55.2% vs 44.8%.
  • Growth supported by dermatologist-tested launches and mass retail integration.

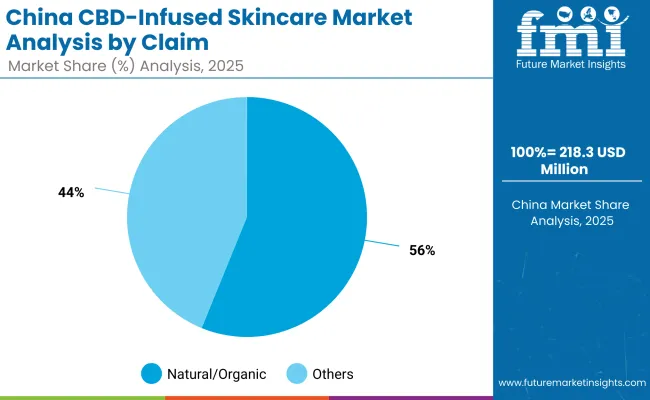
Opportunity Analysis of China CBD-Infused Skincare Market

China Cbd Infused Skincare Market By Claim

China by Claim Value Share % 2025
Natural/organic 56.2%
Others 43.8%

The Global CBD-Infused Skincare Market in China is expected to grow at a CAGR of 22.2%, making it one of the fastest-growing regions globally. Valued at USD 218.3 million in 2025 (12.5% global share), the market will expand rapidly as natural/organic CBD skincare claims dominate with a 56.2% share.

Regulatory acceptance of CBD isolate for cosmetics has accelerated new product launches, particularly through digital-first platforms like Tmall and JD.com. Consumers in tier-1 cities are driving demand for clean beauty and eco-friendly skincare, where CBD is positioned as both premium and functional.

China’s opportunity lies in the convergence of e-commerce scale, clean-label beauty adoption, and premiumization. Domestic brands are leveraging competitive pricing to expand reach, while international brands are using organic and vegan positioning to capture higher-end consumers. By 2035, China is projected to surpass traditional European markets in share, reshaping the global competitive order.
  • Market size for China in 2025 is USD 218.3 million.
  • Global market share is approximately 12.5% in 2025, rising to 13.6% by 2035.
  • Natural/organic leads at 56.2%, reflecting alignment with clean beauty adoption.

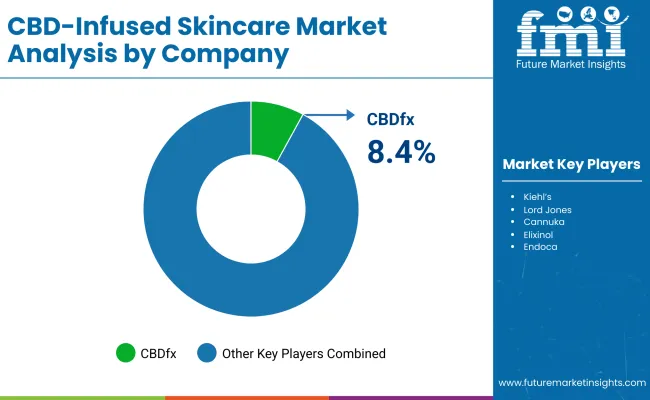
Competitive Landscape of CBD-Infused Skincare Market

Cbd Infused Skincare Market By Company

Company Global Value Share 2025
CBDfx 8.4%
Others 91.6%

The Global CBD-Infused Skincare Market is moderately fragmented, with specialist CBD brands, mainstream beauty giants, and wellness companies competing across different consumer segments. CBDfx, holding an 8.4% share, leads globally due to its extensive e-commerce reach, diversified CBD skincare portfolio, and aggressive social media-driven marketing. Its first-mover advantage and consumer education campaigns have positioned it as the benchmark for CBD skincare globally.

Mainstream players such as Kiehl’s and The Body Shop leverage strong retail footprints to normalize CBD skincare, appealing to consumers seeking trusted legacy beauty names. Premium CBD-first brands such as Lord Jones, Cannuka, and Vertly cater to niche markets with high-end positioning and curated retail strategies. Larger hemp companies like Charlotte’s Web, Endoca, and Medterra have extended into skincare, leveraging their credibility in supplements and wellness.

Competitive differentiation is shifting away from “CBD novelty” toward multi-claim positioning (vegan, clean-label, dermatologist-tested) and integrated brand ecosystems that emphasize transparency, safety, and premium quality. Digital-first CBD skincare brands are scaling through subscription models and influencer marketing, while mainstream beauty players emphasize dermatologist-backed claims and multi-channel distribution. Over the forecast period, success will depend on balancing CBD authenticity with broad clean beauty credentials to appeal to both niche and mass consumer bases.

Key Developments in Global CBD-Infused Skincare Market

  • On March 14, 2024, CBDfx launched its CBD+CBG Daily Face Serum across USA and U.K. e-commerce platforms. The formula combined broad-spectrum CBD with cannabigerol (CBG), emphasizing anti-inflammatory benefits and targeting the acne/blemish care segment.
  • On June 7, 2024, Kiehl’s introduced its Cannabis Sativa Seed Oil Herbal Concentrate in select Asian markets, including Japan and Singapore, marking its expansion of CBD skincare into Asia-Pacific. The launch reflected growing demand for dermatologist-tested and natural/organic claim products.

Scope of the Report

Item Value
Quantitative Units USD 1,752.6 Million
Function Anti-inflammatory, Acne/blemish care, Anti-aging, and Soothing
Product Type Creams/lotions, Oils, Serums, and Balms
Channel E-commerce, Pharmacies, Mass retail, and Specialty beauty stores
Claim Natural/organic, Vegan, Clean-label, and Dermatologist-tested
Regions Covered North America, Europe, Asia-Pacific, Latin America, Middle East & Africa
Country Covered United States, Canada, Germany, France, United Kingdom, China, Japan, India, Brazil, South Africa
Key Companies Profiled CBDfx , Kiehl’s , Lord Jones, Cannuka , Elixinol , Endoca , Charlotte’s Web, Medterra , Vertly , and The Body Shop
Additional Attributes Dollar sales by function, product type, channel, and claim; consumer adoption trends in natural/organic and dermatologist-tested categories; rising demand for anti-inflammatory CBD skincare; premiumization driven by serums and oils; growth of e-commerce and pharmacy distribution; hybrid claims combining vegan, clean-label, and CBD formulations; regional market acceleration in Asia-Pacific, especially China, India, and Japan; USA market maturity supported by retail mainstreaming; competitive landscape marked by digital-first brands and legacy beauty retailers.

Key Segments

By Function:

  • Anti-inflammatory
  • Acne/blemish care
  • Anti-aging
  • Soothing

By Product Type:

  • Serums
  • Creams & lotions
  • Oils
  • Balms

By Channel:

  • E-commerce
  • Pharmacies
  • Mass retail
  • Specialty beauty stores

By Claim:

  • Organic
  • Vegan
  • Dermatologist-tested
  • Clean-label

By Region:

  • North America
  • Latin America
  • Europe
  • East Asia
  • South Asia & Pacific
  • Middle East and Africa

Table of Content

  1. Executive Summary
    • Global Market Outlook
    • Demand-side Trends
    • Supply-side Trends
    • Technology Roadmap Analysis
    • Analysis and Recommendations
  2. Market Overview
    • Market Coverage / Taxonomy
    • Market Definition / Scope / Limitations
  3. Market Background
    • Market Dynamics
      • Drivers
      • Restraints
      • Opportunity
      • Trends
    • Scenario Forecast
      • Demand in Optimistic Scenario
      • Demand in Likely Scenario
      • Demand in Conservative Scenario
    • Opportunity Map Analysis
    • Product Life Cycle Analysis
    • Supply Chain Analysis
      • Supply Side Participants and their Roles
        • Producers
        • Mid-Level Participants (Traders/ Agents/ Brokers)
        • Wholesalers and Distributors
      • Value Added and Value Created at Node in the Supply Chain
      • List of Raw Material Suppliers
      • List of Existing and Potential Buyer’s
    • Investment Feasibility Matrix
    • Value Chain Analysis
      • Profit Margin Analysis
      • Wholesalers and Distributors
      • Retailers
    • PESTLE and Porter’s Analysis
    • Regulatory Landscape
      • By Key Regions
      • By Key Countries
    • Regional Parent Market Outlook
    • Production and Consumption Statistics
    • Import and Export Statistics
  4. Global Market Analysis 2020 to 2024 and Forecast, 2025 to 2035
    • Historical Market Size Value (USD Million) & Volume (Units) Analysis, 2020 to 2024
    • Current and Future Market Size Value (USD Million) & Volume (Units) Projections, 2025 to 2035
      • Y-o-Y Growth Trend Analysis
      • Absolute $ Opportunity Analysis
  5. Global Market Analysis 2020 to 2024 and Forecast 2025 to 2035, By Function
    • Introduction / Key Findings
    • Historical Market Size Value (USD Million) & Volume (Units) Analysis By Function, 2020 to 2024
    • Current and Future Market Size Value (USD Million) & Volume (Units) Analysis and Forecast By Function, 2025 to 2035
      • Anti-inflammatory
      • Acne/blemish care
      • Anti-aging
      • Soothing
    • Y-o-Y Growth Trend Analysis By Function, 2020 to 2024
    • Absolute $ Opportunity Analysis By Function, 2025 to 2035
  6. Global Market Analysis 2020 to 2024 and Forecast 2025 to 2035, By Product Type
    • Introduction / Key Findings
    • Historical Market Size Value (USD Million) & Volume (Units) Analysis By Product Type, 2020 to 2024
    • Current and Future Market Size Value (USD Million) & Volume (Units) Analysis and Forecast By Product Type, 2025 to 2035
      • Serums
      • Creams & lotions
      • Oils
      • Balms
    • Y-o-Y Growth Trend Analysis By Product Type, 2020 to 2024
    • Absolute $ Opportunity Analysis By Product Type, 2025 to 2035
  7. Global Market Analysis 2020 to 2024 and Forecast 2025 to 2035, By Channel
    • Introduction / Key Findings
    • Historical Market Size Value (USD Million) & Volume (Units) Analysis By Channel, 2020 to 2024
    • Current and Future Market Size Value (USD Million) & Volume (Units) Analysis and Forecast By Channel, 2025 to 2035
      • E-commerce
      • Pharmacies
      • Mass retail
      • Specialty beauty stores
    • Y-o-Y Growth Trend Analysis By Channel, 2020 to 2024
    • Absolute $ Opportunity Analysis By Channel, 2025 to 2035
  8. Global Market Analysis 2020 to 2024 and Forecast 2025 to 2035, By Claim
    • Introduction / Key Findings
    • Historical Market Size Value (USD Million) & Volume (Units) Analysis By Claim, 2020 to 2024
    • Current and Future Market Size Value (USD Million) & Volume (Units) Analysis and Forecast By Claim, 2025 to 2035
      • Organic
      • Vegan
      • Dermatologist-tested
      • Clean-label
    • Y-o-Y Growth Trend Analysis By Claim, 2020 to 2024
    • Absolute $ Opportunity Analysis By Claim, 2025 to 2035
  9. Global Market Analysis 2020 to 2024 and Forecast 2025 to 2035, By Region
    • Introduction
    • Historical Market Size Value (USD Million) & Volume (Units) Analysis By Region, 2020 to 2024
    • Current Market Size Value (USD Million) & Volume (Units) Analysis and Forecast By Region, 2025 to 2035
      • North America
      • Latin America
      • Europe
      • East Asia
      • South Asia & Pacific
      • Middle East and Africa
    • Market Attractiveness Analysis By Region
  10. North America Market Analysis 2020 to 2024 and Forecast 2025 to 2035, By Country
    • Historical Market Size Value (USD Million) & Volume (Units) Trend Analysis By Market Taxonomy, 2020 to 2024
    • Market Size Value (USD Million) & Volume (Units) Forecast By Market Taxonomy, 2025 to 2035
      • By Country
        • USA
        • Canada
      • By Function
      • By Product Type
      • By Channel
      • By Claim
    • Market Attractiveness Analysis
      • By Country
      • By Function
      • By Product Type
      • By Channel
      • By Claim
    • Key Takeaways
  11. Latin America Market Analysis 2020 to 2024 and Forecast 2025 to 2035, By Country
    • Historical Market Size Value (USD Million) & Volume (Units) Trend Analysis By Market Taxonomy, 2020 to 2024
    • Market Size Value (USD Million) & Volume (Units) Forecast By Market Taxonomy, 2025 to 2035
      • By Country
        • Brazil
        • Mexico
        • Colombia
        • Rest of Latin America
      • By Function
      • By Product Type
      • By Channel
      • By Claim
    • Market Attractiveness Analysis
      • By Country
      • By Function
      • By Product Type
      • By Channel
      • By Claim
    • Key Takeaways
  12. Europe Market Analysis 2020 to 2024 and Forecast 2025 to 2035, By Country
    • Historical Market Size Value (USD Million) & Volume (Units) Trend Analysis By Market Taxonomy, 2020 to 2024
    • Market Size Value (USD Million) & Volume (Units) Forecast By Market Taxonomy, 2025 to 2035
      • By Country
        • Germany
        • UK
        • France
        • Italy
        • Spain
        • Belgium
        • Netherlands
        • Nordic
        • Switzerland
        • Russia
        • Poland
        • Rest of Europe
      • By Function
      • By Product Type
      • By Channel
      • By Claim
    • Market Attractiveness Analysis
      • By Country
      • By Function
      • By Product Type
      • By Channel
      • By Claim
    • Key Takeaways
  13. East Asia Market Analysis 2020 to 2024 and Forecast 2025 to 2035, By Country
    • Historical Market Size Value (USD Million) & Volume (Units) Trend Analysis By Market Taxonomy, 2020 to 2024
    • Market Size Value (USD Million) & Volume (Units) Forecast By Market Taxonomy, 2025 to 2035
      • By Country
        • China
        • Japan
        • South Korea
      • By Function
      • By Product Type
      • By Channel
      • By Claim
    • Market Attractiveness Analysis
      • By Country
      • By Function
      • By Product Type
      • By Channel
      • By Claim
    • Key Takeaways
  14. South Asia & Pacific Market Analysis 2020 to 2024 and Forecast 2025 to 2035, By Country
    • Historical Market Size Value (USD Million) & Volume (Units) Trend Analysis By Market Taxonomy, 2020 to 2024
    • Market Size Value (USD Million) & Volume (Units) Forecast By Market Taxonomy, 2025 to 2035
      • By Country
        • India
        • Thailand
        • Malaysia
        • Indonesia
        • Singapore
        • Vietnam
        • Australia
        • New Zealand
        • Rest of South Asia
      • By Function
      • By Product Type
      • By Channel
      • By Claim
    • Market Attractiveness Analysis
      • By Country
      • By Function
      • By Product Type
      • By Channel
      • By Claim
    • Key Takeaways
  15. Middle East and Africa Market Analysis 2020 to 2024 and Forecast 2025 to 2035, By Country
    • Historical Market Size Value (USD Million) & Volume (Units) Trend Analysis By Market Taxonomy, 2020 to 2024
    • Market Size Value (USD Million) & Volume (Units) Forecast By Market Taxonomy, 2025 to 2035
      • By Country
        • Turkey
        • UAE
        • Saudi Arabia
        • Israel
        • Other GCC Countries
        • North Africa
        • South Africa
      • By Function
      • By Product Type
      • By Channel
      • By Claim
    • Market Attractiveness Analysis
      • By Country
      • By Function
      • By Product Type
      • By Channel
      • By Claim
    • Key Takeaways
  16. Key Countries Market Analysis
    • USA
      • Pricing Analysis
      • Market Share Analysis, 2024
        • By Function
        • By Product Type
        • By Channel
        • By Claim
    • Canada
      • Pricing Analysis
      • Market Share Analysis, 2024
        • By Function
        • By Product Type
        • By Channel
        • By Claim
    • Brazil
      • Pricing Analysis
      • Market Share Analysis, 2024
        • By Function
        • By Product Type
        • By Channel
        • By Claim
    • Mexico
      • Pricing Analysis
      • Market Share Analysis, 2024
        • By Function
        • By Product Type
        • By Channel
        • By Claim
    • Colombia
      • Pricing Analysis
      • Market Share Analysis, 2024
        • By Function
        • By Product Type
        • By Channel
        • By Claim
    • Germany
      • Pricing Analysis
      • Market Share Analysis, 2024
        • By Function
        • By Product Type
        • By Channel
        • By Claim
    • UK
      • Pricing Analysis
      • Market Share Analysis, 2024
        • By Function
        • By Product Type
        • By Channel
        • By Claim
    • France
      • Pricing Analysis
      • Market Share Analysis, 2024
        • By Function
        • By Product Type
        • By Channel
        • By Claim
    • Italy
      • Pricing Analysis
      • Market Share Analysis, 2024
        • By Function
        • By Product Type
        • By Channel
        • By Claim
    • Spain
      • Pricing Analysis
      • Market Share Analysis, 2024
        • By Function
        • By Product Type
        • By Channel
        • By Claim
    • Belgium
      • Pricing Analysis
      • Market Share Analysis, 2024
        • By Function
        • By Product Type
        • By Channel
        • By Claim
    • Netherlands
      • Pricing Analysis
      • Market Share Analysis, 2024
        • By Function
        • By Product Type
        • By Channel
        • By Claim
    • Nordic
      • Pricing Analysis
      • Market Share Analysis, 2024
        • By Function
        • By Product Type
        • By Channel
        • By Claim
    • Switzerland
      • Pricing Analysis
      • Market Share Analysis, 2024
        • By Function
        • By Product Type
        • By Channel
        • By Claim
    • Russia
      • Pricing Analysis
      • Market Share Analysis, 2024
        • By Function
        • By Product Type
        • By Channel
        • By Claim
    • Poland
      • Pricing Analysis
      • Market Share Analysis, 2024
        • By Function
        • By Product Type
        • By Channel
        • By Claim
    • China
      • Pricing Analysis
      • Market Share Analysis, 2024
        • By Function
        • By Product Type
        • By Channel
        • By Claim
    • Japan
      • Pricing Analysis
      • Market Share Analysis, 2024
        • By Function
        • By Product Type
        • By Channel
        • By Claim
    • South Korea
      • Pricing Analysis
      • Market Share Analysis, 2024
        • By Function
        • By Product Type
        • By Channel
        • By Claim
    • India
      • Pricing Analysis
      • Market Share Analysis, 2024
        • By Function
        • By Product Type
        • By Channel
        • By Claim
    • Thailand
      • Pricing Analysis
      • Market Share Analysis, 2024
        • By Function
        • By Product Type
        • By Channel
        • By Claim
    • Indonesia
      • Pricing Analysis
      • Market Share Analysis, 2024
        • By Function
        • By Product Type
        • By Channel
        • By Claim
    • Australia
      • Pricing Analysis
      • Market Share Analysis, 2024
        • By Function
        • By Product Type
        • By Channel
        • By Claim
    • New Zealand
      • Pricing Analysis
      • Market Share Analysis, 2024
        • By Function
        • By Product Type
        • By Channel
        • By Claim
    • Turkey
      • Pricing Analysis
      • Market Share Analysis, 2024
        • By Function
        • By Product Type
        • By Channel
        • By Claim
    • UAE
      • Pricing Analysis
      • Market Share Analysis, 2024
        • By Function
        • By Product Type
        • By Channel
        • By Claim
    • Saudi Arabia
      • Pricing Analysis
      • Market Share Analysis, 2024
        • By Function
        • By Product Type
        • By Channel
        • By Claim
    • Israel
      • Pricing Analysis
      • Market Share Analysis, 2024
        • By Function
        • By Product Type
        • By Channel
        • By Claim
    • North Africa
      • Pricing Analysis
      • Market Share Analysis, 2024
        • By Function
        • By Product Type
        • By Channel
        • By Claim
    • South Africa
      • Pricing Analysis
      • Market Share Analysis, 2024
        • By Function
        • By Product Type
        • By Channel
        • By Claim
  17. Market Structure Analysis
    • Competition Dashboard
    • Competition Benchmarking
    • Market Share Analysis of Top Players
      • By Regional
      • By Function
      • By Product Type
      • By Channel
      • By Claim
  18. Competition Analysis
    • Competition Deep Dive
      • CBDfx
        • Overview
        • Product Portfolio
        • Profitability by Market Segments (Product/Age /Sales Channel/Region)
        • Sales Footprint
        • Strategy Overview
          • Marketing Strategy
          • Product Strategy
          • Channel Strategy
      • Kiehl’s
        • Overview
        • Product Portfolio
        • Profitability by Market Segments (Product/Age /Sales Channel/Region)
        • Sales Footprint
        • Strategy Overview
          • Marketing Strategy
          • Product Strategy
          • Channel Strategy
      • Lord Jones
        • Overview
        • Product Portfolio
        • Profitability by Market Segments (Product/Age /Sales Channel/Region)
        • Sales Footprint
        • Strategy Overview
          • Marketing Strategy
          • Product Strategy
          • Channel Strategy
      • Cannuka
        • Overview
        • Product Portfolio
        • Profitability by Market Segments (Product/Age /Sales Channel/Region)
        • Sales Footprint
        • Strategy Overview
          • Marketing Strategy
          • Product Strategy
          • Channel Strategy
      • Elixinol
        • Overview
        • Product Portfolio
        • Profitability by Market Segments (Product/Age /Sales Channel/Region)
        • Sales Footprint
        • Strategy Overview
          • Marketing Strategy
          • Product Strategy
          • Channel Strategy
      • Endoca
        • Overview
        • Product Portfolio
        • Profitability by Market Segments (Product/Age /Sales Channel/Region)
        • Sales Footprint
        • Strategy Overview
          • Marketing Strategy
          • Product Strategy
          • Channel Strategy
      • Charlotte’s Web
        • Overview
        • Product Portfolio
        • Profitability by Market Segments (Product/Age /Sales Channel/Region)
        • Sales Footprint
        • Strategy Overview
          • Marketing Strategy
          • Product Strategy
          • Channel Strategy
      • Medterra
        • Overview
        • Product Portfolio
        • Profitability by Market Segments (Product/Age /Sales Channel/Region)
        • Sales Footprint
        • Strategy Overview
          • Marketing Strategy
          • Product Strategy
          • Channel Strategy
      • Vertly
        • Overview
        • Product Portfolio
        • Profitability by Market Segments (Product/Age /Sales Channel/Region)
        • Sales Footprint
        • Strategy Overview
          • Marketing Strategy
          • Product Strategy
          • Channel Strategy
      • The Body Shop
        • Overview
        • Product Portfolio
        • Profitability by Market Segments (Product/Age /Sales Channel/Region)
        • Sales Footprint
        • Strategy Overview
          • Marketing Strategy
          • Product Strategy
          • Channel Strategy
  19. Assumptions & Acronyms Used
  20. Research Methodology

List of Tables

  • Table 1: Global Market Value (USD Million) Forecast by Region, 2020-2035
  • Table 2: Global Market Volume (Units) Forecast by Region, 2020-2035
  • Table 3: Global Market Value (USD Million) Forecast by Function, 2020-2035
  • Table 4: Global Market Volume (Units) Forecast by Function, 2020-2035
  • Table 5: Global Market Value (USD Million) Forecast by Product Type, 2020-2035
  • Table 6: Global Market Volume (Units) Forecast by Product Type, 2020-2035
  • Table 7: Global Market Value (USD Million) Forecast by Channel, 2020-2035
  • Table 8: Global Market Volume (Units) Forecast by Channel, 2020-2035
  • Table 9: Global Market Value (USD Million) Forecast by Claim, 2020-2035
  • Table 10: Global Market Volume (Units) Forecast by Claim, 2020-2035
  • Table 11: North America Market Value (USD Million) Forecast by Country, 2020-2035
  • Table 12: North America Market Volume (Units) Forecast by Country, 2020-2035
  • Table 13: North America Market Value (USD Million) Forecast by Function, 2020-2035
  • Table 14: North America Market Volume (Units) Forecast by Function, 2020-2035
  • Table 15: North America Market Value (USD Million) Forecast by Product Type, 2020-2035
  • Table 16: North America Market Volume (Units) Forecast by Product Type, 2020-2035
  • Table 17: North America Market Value (USD Million) Forecast by Channel, 2020-2035
  • Table 18: North America Market Volume (Units) Forecast by Channel, 2020-2035
  • Table 19: North America Market Value (USD Million) Forecast by Claim, 2020-2035
  • Table 20: North America Market Volume (Units) Forecast by Claim, 2020-2035
  • Table 21: Latin America Market Value (USD Million) Forecast by Country, 2020-2035
  • Table 22: Latin America Market Volume (Units) Forecast by Country, 2020-2035
  • Table 23: Latin America Market Value (USD Million) Forecast by Function, 2020-2035
  • Table 24: Latin America Market Volume (Units) Forecast by Function, 2020-2035
  • Table 25: Latin America Market Value (USD Million) Forecast by Product Type, 2020-2035
  • Table 26: Latin America Market Volume (Units) Forecast by Product Type, 2020-2035
  • Table 27: Latin America Market Value (USD Million) Forecast by Channel, 2020-2035
  • Table 28: Latin America Market Volume (Units) Forecast by Channel, 2020-2035
  • Table 29: Latin America Market Value (USD Million) Forecast by Claim, 2020-2035
  • Table 30: Latin America Market Volume (Units) Forecast by Claim, 2020-2035
  • Table 31: Europe Market Value (USD Million) Forecast by Country, 2020-2035
  • Table 32: Europe Market Volume (Units) Forecast by Country, 2020-2035
  • Table 33: Europe Market Value (USD Million) Forecast by Function, 2020-2035
  • Table 34: Europe Market Volume (Units) Forecast by Function, 2020-2035
  • Table 35: Europe Market Value (USD Million) Forecast by Product Type, 2020-2035
  • Table 36: Europe Market Volume (Units) Forecast by Product Type, 2020-2035
  • Table 37: Europe Market Value (USD Million) Forecast by Channel, 2020-2035
  • Table 38: Europe Market Volume (Units) Forecast by Channel, 2020-2035
  • Table 39: Europe Market Value (USD Million) Forecast by Claim, 2020-2035
  • Table 40: Europe Market Volume (Units) Forecast by Claim, 2020-2035
  • Table 41: East Asia Market Value (USD Million) Forecast by Country, 2020-2035
  • Table 42: East Asia Market Volume (Units) Forecast by Country, 2020-2035
  • Table 43: East Asia Market Value (USD Million) Forecast by Function, 2020-2035
  • Table 44: East Asia Market Volume (Units) Forecast by Function, 2020-2035
  • Table 45: East Asia Market Value (USD Million) Forecast by Product Type, 2020-2035
  • Table 46: East Asia Market Volume (Units) Forecast by Product Type, 2020-2035
  • Table 47: East Asia Market Value (USD Million) Forecast by Channel, 2020-2035
  • Table 48: East Asia Market Volume (Units) Forecast by Channel, 2020-2035
  • Table 49: East Asia Market Value (USD Million) Forecast by Claim, 2020-2035
  • Table 50: East Asia Market Volume (Units) Forecast by Claim, 2020-2035
  • Table 51: South Asia & Pacific Market Value (USD Million) Forecast by Country, 2020-2035
  • Table 52: South Asia & Pacific Market Volume (Units) Forecast by Country, 2020-2035
  • Table 53: South Asia & Pacific Market Value (USD Million) Forecast by Function, 2020-2035
  • Table 54: South Asia & Pacific Market Volume (Units) Forecast by Function, 2020-2035
  • Table 55: South Asia & Pacific Market Value (USD Million) Forecast by Product Type, 2020-2035
  • Table 56: South Asia & Pacific Market Volume (Units) Forecast by Product Type, 2020-2035
  • Table 57: South Asia & Pacific Market Value (USD Million) Forecast by Channel, 2020-2035
  • Table 58: South Asia & Pacific Market Volume (Units) Forecast by Channel, 2020-2035
  • Table 59: South Asia & Pacific Market Value (USD Million) Forecast by Claim, 2020-2035
  • Table 60: South Asia & Pacific Market Volume (Units) Forecast by Claim, 2020-2035
  • Table 61: Middle East and Africa Market Value (USD Million) Forecast by Country, 2020-2035
  • Table 62: Middle East and Africa Market Volume (Units) Forecast by Country, 2020-2035
  • Table 63: Middle East and Africa Market Value (USD Million) Forecast by Function, 2020-2035
  • Table 64: Middle East and Africa Market Volume (Units) Forecast by Function, 2020-2035
  • Table 65: Middle East and Africa Market Value (USD Million) Forecast by Product Type, 2020-2035
  • Table 66: Middle East and Africa Market Volume (Units) Forecast by Product Type, 2020-2035
  • Table 67: Middle East and Africa Market Value (USD Million) Forecast by Channel, 2020-2035
  • Table 68: Middle East and Africa Market Volume (Units) Forecast by Channel, 2020-2035
  • Table 69: Middle East and Africa Market Value (USD Million) Forecast by Claim, 2020-2035
  • Table 70: Middle East and Africa Market Volume (Units) Forecast by Claim, 2020-2035

List of Figures

  • Figure 1: Global Market Value (USD Million) by Function, 2025-2035
  • Figure 2: Global Market Value (USD Million) by Product Type, 2025-2035
  • Figure 3: Global Market Value (USD Million) by Channel, 2025-2035
  • Figure 4: Global Market Value (USD Million) by Claim, 2025-2035
  • Figure 5: Global Market Value (USD Million) by Region, 2025-2035
  • Figure 6: Global Market Value (USD Million) Analysis by Region, 2020-2035
  • Figure 7: Global Market Volume (Units) Analysis by Region, 2020-2035
  • Figure 8: Global Market Value Share (%) and BPS Analysis by Region, 2025-2035
  • Figure 9: Global Market Y-o-Y Growth (%) Projections by Region, 2025-2035
  • Figure 10: Global Market Value (USD Million) Analysis by Function, 2020-2035
  • Figure 11: Global Market Volume (Units) Analysis by Function, 2020-2035
  • Figure 12: Global Market Value Share (%) and BPS Analysis by Function, 2025-2035
  • Figure 13: Global Market Y-o-Y Growth (%) Projections by Function, 2025-2035
  • Figure 14: Global Market Value (USD Million) Analysis by Product Type, 2020-2035
  • Figure 15: Global Market Volume (Units) Analysis by Product Type, 2020-2035
  • Figure 16: Global Market Value Share (%) and BPS Analysis by Product Type, 2025-2035
  • Figure 17: Global Market Y-o-Y Growth (%) Projections by Product Type, 2025-2035
  • Figure 18: Global Market Value (USD Million) Analysis by Channel, 2020-2035
  • Figure 19: Global Market Volume (Units) Analysis by Channel, 2020-2035
  • Figure 20: Global Market Value Share (%) and BPS Analysis by Channel, 2025-2035
  • Figure 21: Global Market Y-o-Y Growth (%) Projections by Channel, 2025-2035
  • Figure 22: Global Market Value (USD Million) Analysis by Claim, 2020-2035
  • Figure 23: Global Market Volume (Units) Analysis by Claim, 2020-2035
  • Figure 24: Global Market Value Share (%) and BPS Analysis by Claim, 2025-2035
  • Figure 25: Global Market Y-o-Y Growth (%) Projections by Claim, 2025-2035
  • Figure 26: Global Market Attractiveness by Function, 2025-2035
  • Figure 27: Global Market Attractiveness by Product Type, 2025-2035
  • Figure 28: Global Market Attractiveness by Channel, 2025-2035
  • Figure 29: Global Market Attractiveness by Claim, 2025-2035
  • Figure 30: Global Market Attractiveness by Region, 2025-2035
  • Figure 31: North America Market Value (USD Million) by Function, 2025-2035
  • Figure 32: North America Market Value (USD Million) by Product Type, 2025-2035
  • Figure 33: North America Market Value (USD Million) by Channel, 2025-2035
  • Figure 34: North America Market Value (USD Million) by Claim, 2025-2035
  • Figure 35: North America Market Value (USD Million) by Country, 2025-2035
  • Figure 36: North America Market Value (USD Million) Analysis by Country, 2020-2035
  • Figure 37: North America Market Volume (Units) Analysis by Country, 2020-2035
  • Figure 38: North America Market Value Share (%) and BPS Analysis by Country, 2025-2035
  • Figure 39: North America Market Y-o-Y Growth (%) Projections by Country, 2025-2035
  • Figure 40: North America Market Value (USD Million) Analysis by Function, 2020-2035
  • Figure 41: North America Market Volume (Units) Analysis by Function, 2020-2035
  • Figure 42: North America Market Value Share (%) and BPS Analysis by Function, 2025-2035
  • Figure 43: North America Market Y-o-Y Growth (%) Projections by Function, 2025-2035
  • Figure 44: North America Market Value (USD Million) Analysis by Product Type, 2020-2035
  • Figure 45: North America Market Volume (Units) Analysis by Product Type, 2020-2035
  • Figure 46: North America Market Value Share (%) and BPS Analysis by Product Type, 2025-2035
  • Figure 47: North America Market Y-o-Y Growth (%) Projections by Product Type, 2025-2035
  • Figure 48: North America Market Value (USD Million) Analysis by Channel, 2020-2035
  • Figure 49: North America Market Volume (Units) Analysis by Channel, 2020-2035
  • Figure 50: North America Market Value Share (%) and BPS Analysis by Channel, 2025-2035
  • Figure 51: North America Market Y-o-Y Growth (%) Projections by Channel, 2025-2035
  • Figure 52: North America Market Value (USD Million) Analysis by Claim, 2020-2035
  • Figure 53: North America Market Volume (Units) Analysis by Claim, 2020-2035
  • Figure 54: North America Market Value Share (%) and BPS Analysis by Claim, 2025-2035
  • Figure 55: North America Market Y-o-Y Growth (%) Projections by Claim, 2025-2035
  • Figure 56: North America Market Attractiveness by Function, 2025-2035
  • Figure 57: North America Market Attractiveness by Product Type, 2025-2035
  • Figure 58: North America Market Attractiveness by Channel, 2025-2035
  • Figure 59: North America Market Attractiveness by Claim, 2025-2035
  • Figure 60: North America Market Attractiveness by Country, 2025-2035
  • Figure 61: Latin America Market Value (USD Million) by Function, 2025-2035
  • Figure 62: Latin America Market Value (USD Million) by Product Type, 2025-2035
  • Figure 63: Latin America Market Value (USD Million) by Channel, 2025-2035
  • Figure 64: Latin America Market Value (USD Million) by Claim, 2025-2035
  • Figure 65: Latin America Market Value (USD Million) by Country, 2025-2035
  • Figure 66: Latin America Market Value (USD Million) Analysis by Country, 2020-2035
  • Figure 67: Latin America Market Volume (Units) Analysis by Country, 2020-2035
  • Figure 68: Latin America Market Value Share (%) and BPS Analysis by Country, 2025-2035
  • Figure 69: Latin America Market Y-o-Y Growth (%) Projections by Country, 2025-2035
  • Figure 70: Latin America Market Value (USD Million) Analysis by Function, 2020-2035
  • Figure 71: Latin America Market Volume (Units) Analysis by Function, 2020-2035
  • Figure 72: Latin America Market Value Share (%) and BPS Analysis by Function, 2025-2035
  • Figure 73: Latin America Market Y-o-Y Growth (%) Projections by Function, 2025-2035
  • Figure 74: Latin America Market Value (USD Million) Analysis by Product Type, 2020-2035
  • Figure 75: Latin America Market Volume (Units) Analysis by Product Type, 2020-2035
  • Figure 76: Latin America Market Value Share (%) and BPS Analysis by Product Type, 2025-2035
  • Figure 77: Latin America Market Y-o-Y Growth (%) Projections by Product Type, 2025-2035
  • Figure 78: Latin America Market Value (USD Million) Analysis by Channel, 2020-2035
  • Figure 79: Latin America Market Volume (Units) Analysis by Channel, 2020-2035
  • Figure 80: Latin America Market Value Share (%) and BPS Analysis by Channel, 2025-2035
  • Figure 81: Latin America Market Y-o-Y Growth (%) Projections by Channel, 2025-2035
  • Figure 82: Latin America Market Value (USD Million) Analysis by Claim, 2020-2035
  • Figure 83: Latin America Market Volume (Units) Analysis by Claim, 2020-2035
  • Figure 84: Latin America Market Value Share (%) and BPS Analysis by Claim, 2025-2035
  • Figure 85: Latin America Market Y-o-Y Growth (%) Projections by Claim, 2025-2035
  • Figure 86: Latin America Market Attractiveness by Function, 2025-2035
  • Figure 87: Latin America Market Attractiveness by Product Type, 2025-2035
  • Figure 88: Latin America Market Attractiveness by Channel, 2025-2035
  • Figure 89: Latin America Market Attractiveness by Claim, 2025-2035
  • Figure 90: Latin America Market Attractiveness by Country, 2025-2035
  • Figure 91: Europe Market Value (USD Million) by Function, 2025-2035
  • Figure 92: Europe Market Value (USD Million) by Product Type, 2025-2035
  • Figure 93: Europe Market Value (USD Million) by Channel, 2025-2035
  • Figure 94: Europe Market Value (USD Million) by Claim, 2025-2035
  • Figure 95: Europe Market Value (USD Million) by Country, 2025-2035
  • Figure 96: Europe Market Value (USD Million) Analysis by Country, 2020-2035
  • Figure 97: Europe Market Volume (Units) Analysis by Country, 2020-2035
  • Figure 98: Europe Market Value Share (%) and BPS Analysis by Country, 2025-2035
  • Figure 99: Europe Market Y-o-Y Growth (%) Projections by Country, 2025-2035
  • Figure 100: Europe Market Value (USD Million) Analysis by Function, 2020-2035
  • Figure 101: Europe Market Volume (Units) Analysis by Function, 2020-2035
  • Figure 102: Europe Market Value Share (%) and BPS Analysis by Function, 2025-2035
  • Figure 103: Europe Market Y-o-Y Growth (%) Projections by Function, 2025-2035
  • Figure 104: Europe Market Value (USD Million) Analysis by Product Type, 2020-2035
  • Figure 105: Europe Market Volume (Units) Analysis by Product Type, 2020-2035
  • Figure 106: Europe Market Value Share (%) and BPS Analysis by Product Type, 2025-2035
  • Figure 107: Europe Market Y-o-Y Growth (%) Projections by Product Type, 2025-2035
  • Figure 108: Europe Market Value (USD Million) Analysis by Channel, 2020-2035
  • Figure 109: Europe Market Volume (Units) Analysis by Channel, 2020-2035
  • Figure 110: Europe Market Value Share (%) and BPS Analysis by Channel, 2025-2035
  • Figure 111: Europe Market Y-o-Y Growth (%) Projections by Channel, 2025-2035
  • Figure 112: Europe Market Value (USD Million) Analysis by Claim, 2020-2035
  • Figure 113: Europe Market Volume (Units) Analysis by Claim, 2020-2035
  • Figure 114: Europe Market Value Share (%) and BPS Analysis by Claim, 2025-2035
  • Figure 115: Europe Market Y-o-Y Growth (%) Projections by Claim, 2025-2035
  • Figure 116: Europe Market Attractiveness by Function, 2025-2035
  • Figure 117: Europe Market Attractiveness by Product Type, 2025-2035
  • Figure 118: Europe Market Attractiveness by Channel, 2025-2035
  • Figure 119: Europe Market Attractiveness by Claim, 2025-2035
  • Figure 120: Europe Market Attractiveness by Country, 2025-2035
  • Figure 121: East Asia Market Value (USD Million) by Function, 2025-2035
  • Figure 122: East Asia Market Value (USD Million) by Product Type, 2025-2035
  • Figure 123: East Asia Market Value (USD Million) by Channel, 2025-2035
  • Figure 124: East Asia Market Value (USD Million) by Claim, 2025-2035
  • Figure 125: East Asia Market Value (USD Million) by Country, 2025-2035
  • Figure 126: East Asia Market Value (USD Million) Analysis by Country, 2020-2035
  • Figure 127: East Asia Market Volume (Units) Analysis by Country, 2020-2035
  • Figure 128: East Asia Market Value Share (%) and BPS Analysis by Country, 2025-2035
  • Figure 129: East Asia Market Y-o-Y Growth (%) Projections by Country, 2025-2035
  • Figure 130: East Asia Market Value (USD Million) Analysis by Function, 2020-2035
  • Figure 131: East Asia Market Volume (Units) Analysis by Function, 2020-2035
  • Figure 132: East Asia Market Value Share (%) and BPS Analysis by Function, 2025-2035
  • Figure 133: East Asia Market Y-o-Y Growth (%) Projections by Function, 2025-2035
  • Figure 134: East Asia Market Value (USD Million) Analysis by Product Type, 2020-2035
  • Figure 135: East Asia Market Volume (Units) Analysis by Product Type, 2020-2035
  • Figure 136: East Asia Market Value Share (%) and BPS Analysis by Product Type, 2025-2035
  • Figure 137: East Asia Market Y-o-Y Growth (%) Projections by Product Type, 2025-2035
  • Figure 138: East Asia Market Value (USD Million) Analysis by Channel, 2020-2035
  • Figure 139: East Asia Market Volume (Units) Analysis by Channel, 2020-2035
  • Figure 140: East Asia Market Value Share (%) and BPS Analysis by Channel, 2025-2035
  • Figure 141: East Asia Market Y-o-Y Growth (%) Projections by Channel, 2025-2035
  • Figure 142: East Asia Market Value (USD Million) Analysis by Claim, 2020-2035
  • Figure 143: East Asia Market Volume (Units) Analysis by Claim, 2020-2035
  • Figure 144: East Asia Market Value Share (%) and BPS Analysis by Claim, 2025-2035
  • Figure 145: East Asia Market Y-o-Y Growth (%) Projections by Claim, 2025-2035
  • Figure 146: East Asia Market Attractiveness by Function, 2025-2035
  • Figure 147: East Asia Market Attractiveness by Product Type, 2025-2035
  • Figure 148: East Asia Market Attractiveness by Channel, 2025-2035
  • Figure 149: East Asia Market Attractiveness by Claim, 2025-2035
  • Figure 150: East Asia Market Attractiveness by Country, 2025-2035
  • Figure 151: South Asia & Pacific Market Value (USD Million) by Function, 2025-2035
  • Figure 152: South Asia & Pacific Market Value (USD Million) by Product Type, 2025-2035
  • Figure 153: South Asia & Pacific Market Value (USD Million) by Channel, 2025-2035
  • Figure 154: South Asia & Pacific Market Value (USD Million) by Claim, 2025-2035
  • Figure 155: South Asia & Pacific Market Value (USD Million) by Country, 2025-2035
  • Figure 156: South Asia & Pacific Market Value (USD Million) Analysis by Country, 2020-2035
  • Figure 157: South Asia & Pacific Market Volume (Units) Analysis by Country, 2020-2035
  • Figure 158: South Asia & Pacific Market Value Share (%) and BPS Analysis by Country, 2025-2035
  • Figure 159: South Asia & Pacific Market Y-o-Y Growth (%) Projections by Country, 2025-2035
  • Figure 160: South Asia & Pacific Market Value (USD Million) Analysis by Function, 2020-2035
  • Figure 161: South Asia & Pacific Market Volume (Units) Analysis by Function, 2020-2035
  • Figure 162: South Asia & Pacific Market Value Share (%) and BPS Analysis by Function, 2025-2035
  • Figure 163: South Asia & Pacific Market Y-o-Y Growth (%) Projections by Function, 2025-2035
  • Figure 164: South Asia & Pacific Market Value (USD Million) Analysis by Product Type, 2020-2035
  • Figure 165: South Asia & Pacific Market Volume (Units) Analysis by Product Type, 2020-2035
  • Figure 166: South Asia & Pacific Market Value Share (%) and BPS Analysis by Product Type, 2025-2035
  • Figure 167: South Asia & Pacific Market Y-o-Y Growth (%) Projections by Product Type, 2025-2035
  • Figure 168: South Asia & Pacific Market Value (USD Million) Analysis by Channel, 2020-2035
  • Figure 169: South Asia & Pacific Market Volume (Units) Analysis by Channel, 2020-2035
  • Figure 170: South Asia & Pacific Market Value Share (%) and BPS Analysis by Channel, 2025-2035
  • Figure 171: South Asia & Pacific Market Y-o-Y Growth (%) Projections by Channel, 2025-2035
  • Figure 172: South Asia & Pacific Market Value (USD Million) Analysis by Claim, 2020-2035
  • Figure 173: South Asia & Pacific Market Volume (Units) Analysis by Claim, 2020-2035
  • Figure 174: South Asia & Pacific Market Value Share (%) and BPS Analysis by Claim, 2025-2035
  • Figure 175: South Asia & Pacific Market Y-o-Y Growth (%) Projections by Claim, 2025-2035
  • Figure 176: South Asia & Pacific Market Attractiveness by Function, 2025-2035
  • Figure 177: South Asia & Pacific Market Attractiveness by Product Type, 2025-2035
  • Figure 178: South Asia & Pacific Market Attractiveness by Channel, 2025-2035
  • Figure 179: South Asia & Pacific Market Attractiveness by Claim, 2025-2035
  • Figure 180: South Asia & Pacific Market Attractiveness by Country, 2025-2035
  • Figure 181: Middle East and Africa Market Value (USD Million) by Function, 2025-2035
  • Figure 182: Middle East and Africa Market Value (USD Million) by Product Type, 2025-2035
  • Figure 183: Middle East and Africa Market Value (USD Million) by Channel, 2025-2035
  • Figure 184: Middle East and Africa Market Value (USD Million) by Claim, 2025-2035
  • Figure 185: Middle East and Africa Market Value (USD Million) by Country, 2025-2035
  • Figure 186: Middle East and Africa Market Value (USD Million) Analysis by Country, 2020-2035
  • Figure 187: Middle East and Africa Market Volume (Units) Analysis by Country, 2020-2035
  • Figure 188: Middle East and Africa Market Value Share (%) and BPS Analysis by Country, 2025-2035
  • Figure 189: Middle East and Africa Market Y-o-Y Growth (%) Projections by Country, 2025-2035
  • Figure 190: Middle East and Africa Market Value (USD Million) Analysis by Function, 2020-2035
  • Figure 191: Middle East and Africa Market Volume (Units) Analysis by Function, 2020-2035
  • Figure 192: Middle East and Africa Market Value Share (%) and BPS Analysis by Function, 2025-2035
  • Figure 193: Middle East and Africa Market Y-o-Y Growth (%) Projections by Function, 2025-2035
  • Figure 194: Middle East and Africa Market Value (USD Million) Analysis by Product Type, 2020-2035
  • Figure 195: Middle East and Africa Market Volume (Units) Analysis by Product Type, 2020-2035
  • Figure 196: Middle East and Africa Market Value Share (%) and BPS Analysis by Product Type, 2025-2035
  • Figure 197: Middle East and Africa Market Y-o-Y Growth (%) Projections by Product Type, 2025-2035
  • Figure 198: Middle East and Africa Market Value (USD Million) Analysis by Channel, 2020-2035
  • Figure 199: Middle East and Africa Market Volume (Units) Analysis by Channel, 2020-2035
  • Figure 200: Middle East and Africa Market Value Share (%) and BPS Analysis by Channel, 2025-2035
  • Figure 201: Middle East and Africa Market Y-o-Y Growth (%) Projections by Channel, 2025-2035
  • Figure 202: Middle East and Africa Market Value (USD Million) Analysis by Claim, 2020-2035
  • Figure 203: Middle East and Africa Market Volume (Units) Analysis by Claim, 2020-2035
  • Figure 204: Middle East and Africa Market Value Share (%) and BPS Analysis by Claim, 2025-2035
  • Figure 205: Middle East and Africa Market Y-o-Y Growth (%) Projections by Claim, 2025-2035
  • Figure 206: Middle East and Africa Market Attractiveness by Function, 2025-2035
  • Figure 207: Middle East and Africa Market Attractiveness by Product Type, 2025-2035
  • Figure 208: Middle East and Africa Market Attractiveness by Channel, 2025-2035
  • Figure 209: Middle East and Africa Market Attractiveness by Claim, 2025-2035
  • Figure 210: Middle East and Africa Market Attractiveness by Country, 2025-2035

Frequently Asked Questions

How big is the Global CBD-Infused Skincare Market in 2025?

The Global CBD-Infused Skincare Market is estimated to be valued at USD 1,752.6 million in 2025.

What will be the size of the Global CBD-Infused Skincare Market in 2035?

The market size for the Global CBD-Infused Skincare Market is projected to reach USD 5,982.1 million by 2035.

How much will be the Global CBD-Infused Skincare Market growth between 2025 and 2035?

The Global CBD-Infused Skincare Market is expected to grow at a 13.1% CAGR between 2025 and 2035.

What are the key product types in the Global CBD-Infused Skincare Market?

The key product types in the Global CBD-Infused Skincare Market are creams/lotions, oils, serums, and balms.

Which functional segment will contribute a significant share in the Global CBD-Infused Skincare Market in 2025?

In terms of function, the anti-inflammatory segment is projected to command 53.5% share in the Global CBD-Infused Skincare Market in 2025.

Explore Similar Insights

Future Market Insights

CBD-Infused Skincare Market

Chat With

MaRIA

Hi There, I am MaRIA, Your Market Research Intelligence Assistant. How may I help you?