GABA-Infused Drinks Market Size and Share Forecast Outlook 2025 to 2035

A valuation of USD 697.2 million is anticipated in 2025, with the market projected to reach USD 1,255.8 million by 2035. This increase of nearly USD 558.6 million underscores the transition of GABA beverages from a niche wellness product into a mainstream functional beverage category, validated by measurable consumer adoption trends.
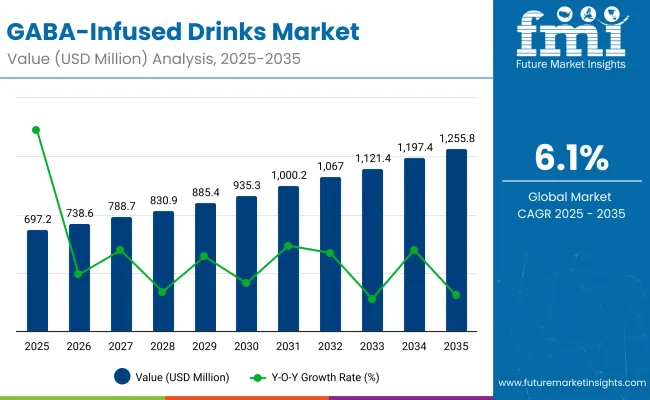
Gaba Infused Drinks Market

Metrics Value
GABA-Infused Drinks Market Estimated Value in (2025E) USD 697.2 million
GABA-Infused Drinks Market Forecast Value in (2035F) USD 1,255.8 million
Forecast CAGR (2025 to 2035) 6.0%

Between 2025 and 2030, the market is expected to climb from USD 697.2 million to USD 950.3 million, reflecting a gain of USD 253.1 million, or about 45% of the decade’s growth. This phase will likely be characterized by the early mainstreaming of stress-relief and sleep-support beverages, reinforced by wider retail penetration and consumer demand for clinically associated functional outcomes. Within this period, Functional Beverages are projected to dominate with a 50% share, emphasizing their integration into daily consumption routines.

From 2030 to 2035, momentum is projected to strengthen, with the market rising from USD 950.3 million to USD 1,255.8 million, adding another USD 305.5 million (55% of decade growth). The strongest gains are expected in Sleep & Relaxation Drinks, forecasted to grow at 11.2% CAGR, while Fermented GABA will remain a preferred source with a 55% share in 2025, supported by consumer trust in natural fermentation. By 2035, the market is anticipated to nearly double in value, anchored by transparent claims, multi-demographic adoption, and expansion across omnichannel retail strategies.

Why the GABA-Infused Drinks Market is growing?

Growth in the GABA-Infused Drinks Market is being propelled by rising consumer focus on mental wellness, stress relief, and sleep quality. Increasing awareness of functional ingredients is being reinforced by higher adoption of beverages offering measurable benefits beyond hydration. During the forecast period, demand is expected to be stimulated by greater acceptance of fermented GABA, which is perceived as both natural and trustworthy. Broader availability across supermarkets, health stores, and online platforms is being supported by expanding product ranges in functional, nootropic, and sleep-focused categories.

Younger demographics and urban professionals particularly those balancing digital lifestyles and high-stress work environments are increasingly driving adoption of GABA beverages are increasingly being drawn to beverages positioned as mood-enhancing or relaxation-inducing, creating repeat purchase behavior. Premiumization trends are being supported by clean-label positioning, co-active blends such as L-theanine and adaptogens, and transparent sourcing claims. Over the decade, acceleration is expected as sleep and relaxation formats capture faster growth, consolidating GABA beverages as a mainstream functional category.

Segmental Analysis

The GABA-Infused Drinks Market is segmented by product type, source, target demographics, sales channel, packaging format, and claims & positioning. Within product type, the market spans functional beverages, nootropic drinks, and sleep & relaxation drinks, reflecting the range of consumption occasions. Source segmentation includes fermented GABA, synthetic GABA, and natural extract-derived GABA, highlighting differences in cost efficiency and consumer trust. Target demographics cover general wellness seekers, mental wellness/stress relief consumers, sports recovery users, and sleep-deprived professionals. Each of these segments is projected to grow at varying rates, shaping the category’s long-term performance and competitive positioning.
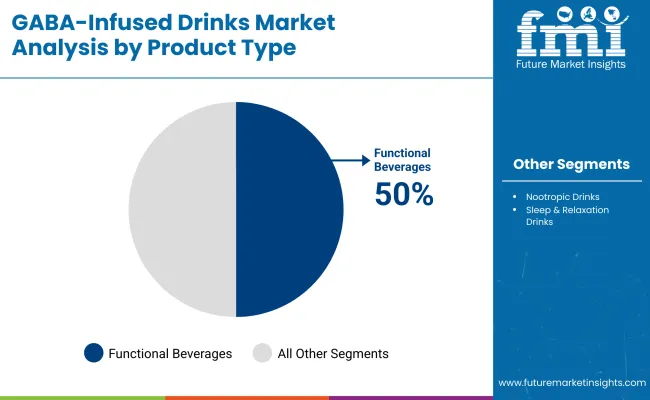
Insights into the Product Type Segment with Functional Beverages Leading in Market Share

Gaba Infused Drinks Market By Product Type

Product Type Market Value Share, 2025
Functional Beverages 50%
Nootropic Drinks 25%
Sleep & Relaxation Drinks 25%

The Functional Beverages segment is expected to contribute 50% of the GABA-Infused Drinks Market revenue in 2025, maintaining its lead as the dominant category. Growth is anticipated to be fueled by the clinically associated benefits of GABA for stress modulation, integrated into everyday drinks such as teas, waters, and dairy alternatives, reinforcing broad consumer acceptance. The segment’s expansion is projected to be further supported by a CAGR of 9.2%, reflecting steady penetration into mainstream beverage portfolios. Although functional beverages remain the anchor, the faster growth of sleep & relaxation formats is expected to gradually rebalance category shares. Over the forecast horizon, functional beverages are projected to retain their backbone role in driving mass adoption.
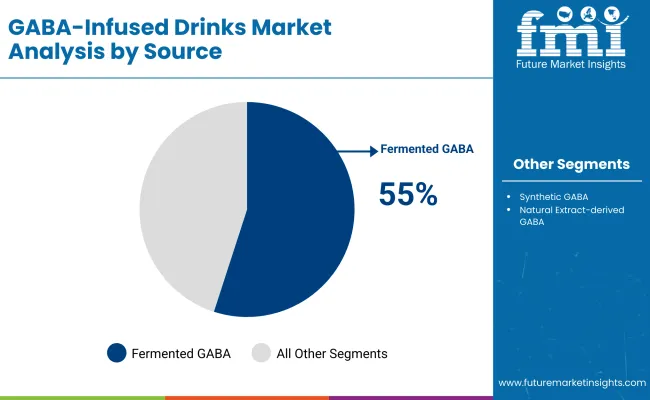
Insights into the Source Segment with Fermented GABA Leading in Market Share

Gaba Infused Drinks Market By Source

Source Market Value Share, 2025
Fermented GABA 55%
Synthetic GABA 30%
Natural Extract-derived GABA 15%

The Fermented GABA segment is projected to dominate with a 55% share in 2025, a leadership reinforced by consumer trust in microbial fermentation and its long-standing cultural acceptance across East Asia. This segment is forecast to expand at a CAGR of 10.1%, outperforming synthetic and extract-derived sources. Synthetic GABA, holding 30%, is expected to retain significance due to affordability and consistent supply, while natural extract-derived sources, with 15% share, are anticipated to gain traction in premium-positioned beverages. The leadership of fermented GABA reflects both cultural acceptance and alignment with clean-label expectations. Over the next decade, it is projected that fermentation-derived GABA will remain the foundation of sourcing strategies, particularly in East Asia, while premium brands globally will adopt provenance-driven extract formats.
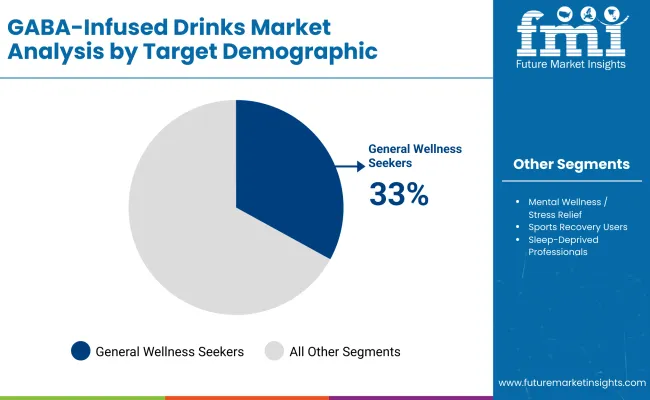
Insights into the Target Demographic Segment with General Wellness Seekers Anchoring Demand

Gaba Infused Drinks Market By Target Demographic

Target Demographic Market Value Share, 2025
General Wellness Seekers 33%
Mental Wellness/Stress Relief 31%
Sports Recovery Users 15%
Sleep-Deprived Professionals 21%

General Wellness Seekers are anticipated to hold the largest share at 33% in 2025, reflecting integration of GABA beverages into daily wellness routines rather than occasional use. Sleep-deprived professionals, expanding at 11.2% CAGR, reflect a rising shift toward evidence-backed relaxation formats. Sports recovery users, with 15% share, are forecast to maintain steady growth at 9.9% CAGR. Collectively, these demographic dynamics are expected to broaden the consumer base and diversify growth opportunities across the decade.

What are the Drivers, Restraints, and Key Trends of the GABA-Infused Drinks Market?

Complex regulatory scrutiny over functional claims is shaping category strategies, even as broader consumer adoption is reinforced by clean-label expectations, targeted formulations, and the normalization of functional beverages across retail and digital platforms.

Efficacy-Linked Purchase Behaviour

Growth in the GABA-Infused Drinks Market is being anchored by consumer behavior that ties repeat purchases to measurable outcomes. Unlike traditional soft drinks, this category is expected to evolve around a “proof-of-effect” model, where perceived calmness, improved sleep quality, or enhanced focus drive loyalty. Transparent dosing, third-party batch testing, and QR-linked product traceability are increasingly being prioritized, underscoring a shift toward verifiable efficacy claims. Over the forecast period, brands that link consumption to quantifiable markers such as sleep latency reduction or stress-level self-assessments are expected to secure higher lifetime value customers. This driver establishes efficacy not as a marketing add-on but as the central competitive differentiator.

Multi-Occasion Positioning

A major trend shaping the market is the repositioning of GABA-infused drinks from single-use relaxation aids into multi-occasion solutions. Products are being designed for morning composure, midday calm, and evening wind-down, creating a continuum of use-cases. This trend is expected to elevate volume growth as consumption is normalized alongside coffee and energy drinks. Companies that clearly define “time-of-day” relevance and integrate GABA into broader wellness routines are projected to outperform, as the market shifts toward functional beverages embedded into daily life.
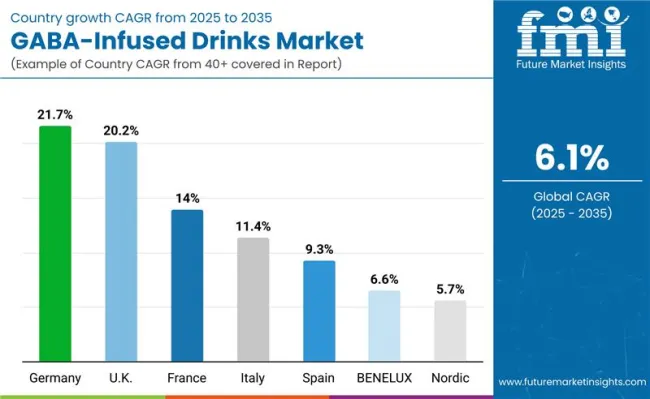
Analysis of GABA-Infused Drinks Market By Key Countries

Country Wise Analysis Gaba Infused Drinks Market

Countries CAGR
UK 20.28%
Germany 21.74%
Italy 11.47%
France 14.03%
Spain 9.31%
BENELUX 6.61%
Nordic 5.78%

The trajectory of the GABA-Infused Drinks Market is expected to display marked variation across major countries, reflecting cultural attitudes toward functional beverages, regulatory frameworks, and consumer readiness to adopt stress-relief solutions. The United States, projected at a 6.5% CAGR, is anticipated to remain the most mature market in North America, where functional wellness beverages are being normalized through mainstream retail channels and product innovation pipelines. In Europe, Germany and France are expected to expand steadily at 5.88% and 5.92% CAGR, respectively, driven by strong regulatory oversight and consumer trust in evidence-based health claims. The UK, at 5.09% CAGR, is forecast to show moderate growth, reflecting cautious adoption influenced by claim restrictions.

In Asia, China’s market, growing at 5.87% CAGR, is expected to consolidate around its established base of functional beverage consumers, supported by urban wellness trends. India, at 5.62% CAGR, is anticipated to represent an emerging growth hub, where functional drinks are increasingly integrated into urban and youth wellness routines. Latin America shows stronger acceleration, with Brazil leading at 6.18% CAGR, reflecting higher receptivity to stress-relief formats in urban centres. Collectively, these country-level variations are projected to shape the competitive landscape, as global players adjust portfolios and messaging to align with local consumer drivers and regulatory sensitivities.
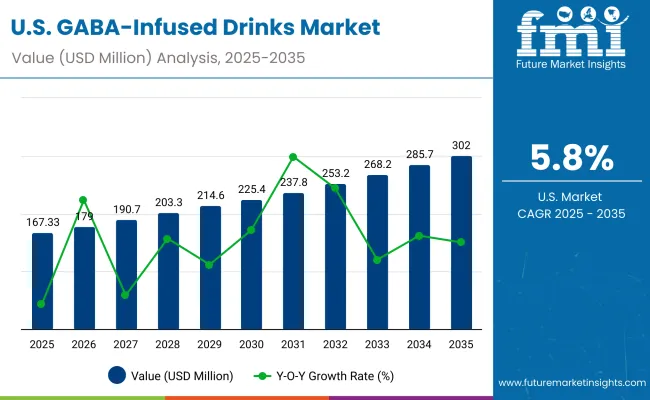
Sales Outlook for GABA-Infused Drinks in the United States

Usa Gaba Infused Drinks Market

Year USA GABA-Infused Drinks Market (USD Million)
2025 167.33
2026 179.0
2027 190.7
2028 203.3
2029 225.4
2030 225.4
2031 237.8
2032 253.2
2033 268.2
2034 285.7
2035 302.0

The GABA-Infused Drinks Market in the United States is projected to expand from USD 167.3 million in 2025 to USD 302.0 million by 2035, recording a CAGR of 6.1%. Growth momentum is expected to be supported by year-on-year expansions ranging between 5.0% and 7.0%, reflecting steady yet sustained adoption.

Expansion is anticipated to be underpinned by increasing consumer emphasis on stress relief, cognitive balance, and sleep wellness. Functional beverages are projected to retain dominance, while sleep-focused formulations are expected to achieve stronger acceleration within urban and professional demographics. The integration of GABA into teas, waters, and wellness-focused dairy alternatives is expected to broaden accessibility.

Clean-label fermented GABA is projected to strengthen its role in premium offerings, while online retail platforms are likely to amplify distribution and awareness. Over the decade, the USA market is expected to demonstrate resilience by balancing mature wellness demand with innovative product positioning across multiple consumption occasions.

  • Functional beverages expected to anchor demand across broad demographics.
  • Sleep-support drinks projected to lead incremental growth in urban markets.
  • Fermented GABA anticipated to consolidate premium positioning.

Growth and Expansion Outlook for GABA-Infused Drinks Market in the United Kingdom

The GABA-Infused Drinks Market in the UK is projected to grow at a CAGR of 6.5% between 2025 and 2035. The country’s share is expected to rise from 18.2% in 2025 to 20.9% in 2035, reflecting increasing consumer receptivity to wellness-centric beverages. Demand is anticipated to be shaped by strong interest in functional drinks positioned for stress relief and sleep aid, aligning with rising workplace stress and urban lifestyle pressures. Regulatory oversight on health claims is expected to shape brand narratives, favouring clean-label formulations and natural sourcing. Online retail and health-focused specialty channels are anticipated to accelerate product penetration among younger consumers.

  • Market share projected to increase to 20.9% by 2035 within Europe.
  • Functional beverages expected to lead adoption across consumer groups.
  • Regulatory frameworks likely to prioritize natural, clean-label positioning.
  • Online platforms anticipated to expand reach among younger demographics.

Growth and Expansion Outlook for GABA-Infused Drinks Market in India

The GABA-Infused Drinks Market in India is projected to record a CAGR of 5.22% over 2025-2035. Demand is expected to be driven by an expanding middle class increasingly focused on stress management and mental wellness solutions. Urban youth adoption is projected to accelerate, especially in categories such as sleep-support shots and GABA-blended nootropic formulations. Domestic beverage companies are anticipated to explore partnerships for fermented GABA sourcing, improving affordability and scalability. Retail expansion and the rapid growth of e-commerce are expected to bridge access gaps, especially in Tier-II and Tier-III cities. India’s trajectory is likely to evolve as consumers shift from traditional remedies to modern, functional beverage formats.

  • CAGR of 5.22% reflects steady but scalable potential.
  • Urban professionals anticipated to drive growth in sleep-support and nootropics.
  • Partnerships for GABA sourcing expected to reduce costs and expand supply.
  • E-commerce projected to extend adoption beyond metro cities.

Sales Outlook for GABA-Infused Drinks in China

The GABA-Infused Drinks Market in China is projected to expand at a CAGR of 5.57% through 2025–2035. The market is expected to be supported by an established consumer base for functional beverages and continued innovation by domestic and global players. Cultural acceptance of natural wellness beverages is anticipated to favour fermented GABA formulations, aligning with consumer preferences for traditional health-inspired products. Urban demand is projected to remain concentrated in stress-relief and cognitive-support beverages, reflecting lifestyle pressures in major metropolitan regions. Expanding retail modernization and integration with digital commerce platforms are expected to enhance distribution scale and consumer awareness.

  • CAGR of 5.57% indicates steady long-term expansion.
  • Fermented GABA projected to dominate due to cultural alignment with natural health.
  • Stress-relief and cognitive-support beverages expected to lead urban consumption.
  • Digital commerce anticipated to accelerate product accessibility and adoption.

In-depth Analysis of GABA-Infused Drinks in Germany

Countries 2025
UK 20.94%
Germany 21.34%
Italy 10.29%
France 14.03%
Spain 11.66%
BNELUX 6.08%
Nordic 5.94%
Rest of Europe 10%
Countries 2035
UK 19.44%
Germany 20.20%
Italy 9.33%
France 13.33%
Spain 11.01%
BNELUX 5.23%
Nordic 5.42%
Rest of Europe 16%

The GABA-Infused Drinks Market in Germany is projected to grow at a CAGR of 6.28% between 2025 and 2035. Market share is expected to remain high, with 21.9% in 2025 and 20.8% in 2035, maintaining Germany’s role as Europe’s largest market for GABA-based beverages. Strong consumer trust in evidence-backed functional claims is anticipated to sustain demand, especially within nootropic and stress-relief segments. Stringent regulatory oversight is projected to enhance product credibility, benefiting established brands that emphasize transparency and scientific validation. Distribution through supermarkets and wellness-focused retailers is expected to remain a dominant channel, while premiumization is likely to drive demand for fermented GABA.

  • Largest European market with over 20% share maintained through 2035.
  • Regulatory rigor expected to favour scientifically validated product claims.
  • Nootropic and stress-relief segments projected to lead adoption.
  • Premium fermented GABA anticipated to strengthen high-value positioning.

Growth Outlook for GABA-Infused Drinks Market in Japan

Component Segment Market Value Share, 2025
Fermented GABA 50%
Synthetic GABA 25%
Natural Extract-derived GABA 25%

The GABA-Infused Drinks Market in Japan is projected at a strong base in 2025, with fermented GABA contributing 55%, synthetic GABA holding 30%, and natural extract-derived GABA at 15%. The clear dominance of fermented GABA highlights Japan’s cultural and technological alignment with microbial fermentation, which has been embedded within its food innovation ecosystem. This preference reflects consumer trust in naturally derived solutions, as well as regulatory comfort with fermentation-based nutraceuticals.

The outlook is expected to be shaped by Japan’s emphasis on precision wellness, where GABA-infused teas and functional beverages are anticipated to gain significant traction. Digital platforms and e-commerce channels are projected to expand product accessibility, while functional claims around stress relief, sleep aid, and cognitive support are expected to consolidate consumer trust. As healthcare-conscious consumers increasingly demand science-backed beverages, the fermented segment is projected to continue leading premium-positioned products, while synthetic and natural extracts diversify affordability and choice.

  • Japan’s market is expected to hold a notable share of global value in 2025.
  • Fermented GABA dominates with a 55% share in Japan, supported by the nation’s cultural alignment with fermentation-based health products and regulatory comfort with microbial nutraceuticals
  • Synthetic GABA at 30% and natural extract GABA at 15% diversify availability.
  • Growth outlook is strengthened by functional positioning in stress relief and cognitive support.

Opportunity Analysis of South Korea GABA-Infused Drinks Market

Range Segment Market Value Share, 2025
General Wellness Seekers 33%
Mental Wellness / Stress Relief 31%
Sports Recovery Users 15%
Sleep-Deprived Professionals 21%

The GABA-Infused Drinks Market in South Korea is projected to advance steadily between 2025 and 2035, supported by shifting consumer lifestyles and rising focus on targeted wellness functions. In 2025, General Wellness Seekers dominate with 33%, followed by Mental Wellness/Stress Relief Consumers at 31%, Sleep-Deprived Professionals at 21%, and Sports Recovery Users at 15%.

The most significant momentum is expected fromSleep-Deprived Professionals, forecasted to grow at a11.20% CAGR, reflecting the country’s intense work schedules and increasing awareness of sleep-health beverages. Mental Wellness/Stress Relief, expanding at 10.50% CAGR, is projected to capture strong demand as mental resilience becomes central to urban lifestyles. General WellnessSeekers, while holding the largest base share, are expected to expand at a slower 9.50% CAGR, signaling a gradual shift toward more specialized consumption. Sports Recovery Users are projected to rise at 9.90% CAGR, reinforcing adoption within fitness and professional athletic routines.

The market outlook is further shaped by South Korea’s advanced retail ecosystem, where functional drinks are widely integrated into convenience stores, online marketplaces, and café chains. Premium positioning around cognitive support, relaxation, and recovery is expected to define the competitive landscape, with innovation in formulations driving both mainstream and niche adoption.
  • General Wellness Seekers hold the largest share at 33% in 2025, though growth remains moderate.
  • Sleep-Deprived Professionals emerge as the fastest-growing segment at 11.20% CAGR.
  • Mental Wellness/Stress Relief expands at 10.50% CAGR, underpinned by lifestyle-related stress.
  • Growth is reinforced by South Korea’s modern retail and digital distribution ecosystem.

Competitive Landscape of GABA-Infused Drinks Market

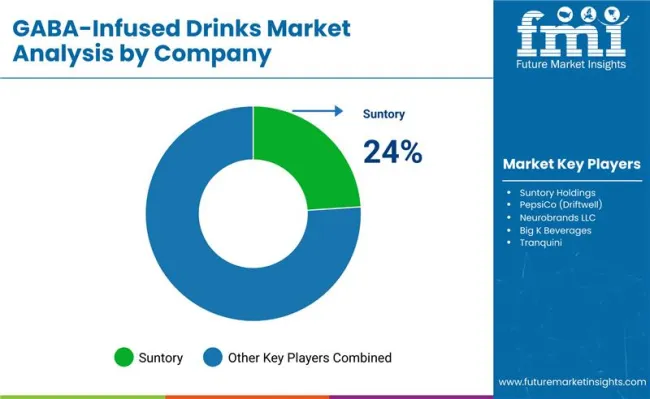
Gaba Infused Drinks Market By Company

Company Global Value Share 2025
Suntory 24%
Others 76%

The GABA-Infused Drinks Market is moderately fragmented, with multinational beverage companies, functional food innovators, and regional specialists actively competing. Global leaders such as Nestlé, Suntory, and PepsiCo have been holding strong positions, supported by wide distribution networks, brand recognition, and ongoing investments in functional wellness portfolios. Their strategies are increasingly shaped by scientific validation, regulatory compliance, and functional claims around stress relief, relaxation, and cognitive health.

Mid-sized innovators, including Kirin Holdings, Yakult Honsha, and Asahi Group, are strengthening their foothold through fermentation expertise, R&D-driven formulations, and niche wellness branding. Their emphasis on Japan’s fermentation heritage and science-backed health positioning is expected to sustain their long-term competitiveness.

Niche-focused players and startups are projected to shape the premium and craft beverage space. Brands emphasizing natural extract-derived GABA, clean-label claims, and personalized wellness positioning are expected to benefit from rising consumer preference for transparent sourcing and functional authenticity.

Competitive differentiation is steadily moving beyond formulation toward integrated consumer engagement models, including e-commerce expansion, subscription-based wellness packs, and AI-driven personalization of beverage choices. By 2035, competitive advantage is expected to be determined less by production scale and more by scientific credibility, digital accessibility, and lifestyle integration.

Key Developments in GABA-Infused Drinks Market

  • On February 6, 2024, Suntory Holdings introduced a new fermented GABA tea blend in Japan, designed for stress reduction and cognitive support. The launch reinforced the dominance of fermented GABA in East Asia, with early adoption accelerated by e-commerce distribution partnerships.
  • On May 11, 2024, PepsiCo piloted nootropic GABA-infused energy beverages in North America, targeting mental wellness and workplace productivity. Positioned as a functional alternative to traditional energy drinks, the products leveraged AI-driven consumer insights for flavor optimization and health positioning.
  • On September 28, 2024, Neurobrands LLC expanded its Neuro Bliss line with a GABA-based relaxation drink, aimed at sleep-deprived professionals. The innovation emphasized natural extracts and adaptogenic blends, reflecting consumer demand for multi-functional formulations in the USA wellness market.
  • On January 15, 2025, Tranquini launched GABA-fortified sparkling relaxation drinks across Europe, supported by regulatory approvals for functional health claims. The rollout addressed rising demand for stress-relief beverages, particularly in Germany, France, and the UK, where functional beverage penetration is accelerating.

Scope of the Report

Item Value
Quantitative Units USD million
Component Product Type: Functional Beverages (50% share; CAGR 9.20%); Nootropic Drinks (25%; CAGR 10.40%); Sleep & Relaxation Drinks (25%; CAGR 11.20%)
Range GABA Source: Fermented GABA (55%; CAGR 10.10%); Synthetic GABA (30%; CAGR 8.70%); Natural Extract ‑ derived GABA (15%; CAGR 9.80%)
Technology Claims & Positioning: Stress Relief; Sleep Aid; Mood Enhancer; Cognitive Support
Type Packaging Format: Bottles (Plastic/Glass); Cans; Single ‑ serve Shots; Sachets (mix ‑ ins)
End-use Industry Target Demographics (benchmark—South Korea): General Wellness Seekers (33%; CAGR 9.50%); Mental Wellness/Stress Relief (31%; CAGR 10.50%); Sports Recovery Users (15%; CAGR 9.90%); Sleep ‑ Deprived Professionals (21%; CAGR 11.20%)
Regions Covered North America (30%); Europe (28%); East Asia (12%); South Asia & Pacific (25%); Latin America (2%); Middle East & Africa (3%) — Total 100%
Country Covered United States; United Kingdom; Germany; France; Italy (EU sub ‑ region set provided); China; Japan; India; Brazil; South Korea
Key Companies Profiled Suntory Holdings ( Iyemon Tokucha ; Suntory GABA Tea); PepsiCo ( Driftwell ); Neurobrands LLC (Neuro Sleep); Big K Beverages (Vibe Relaxation); Tranquini
Additional Attributes Dollar sales by product type and GABA source; regional share mapping (as above); Europe sub ‑ region shares (UK, Germany, Italy, France, Spain, BENELUX, Nordic, Rest of Europe); country ‑ level CAGRs provided; South Korea demographic benchmark (shares + CAGRs); sales channels (Retail, Online, Foodservice, Specialty); packaging formats; EEAT ‑ aligned focus on transparent dosing and evidence ‑ based claims.

Key Segments

By Product Type:

  • Functional Beverages
  • Nootropic Drinks
  • Sleep & Relaxation Drinks

By GABA Source:

  • Fermented GABA (microbial fermentation)
  • Synthetic GABA
  • Natural Extract-derived GABA (e.g., from brown rice, sprouts)

By Target Demographic:

  • General Wellness Seekers
  • Mental Wellness/Stress Relief Consumers
  • Sports Recovery Users

By Packaging Format:

  • Bottles (Plastic/Glass)
  • Cans
  • Single-serve Shots
  • Sachets (for mix-ins)

By Claims & Positioning:

  • Stress Relief
  • Sleep Aid
  • Mood Enhancer
  • Cognitive Support

By Region:

  • North America
  • Latin America
  • Europe
  • East Asia
  • South Asia & Pacific
  • Middle East and Africa

Table of Content

  1. Executive Summary
    • Global Market Outlook
    • Demand-side Trends
    • Supply-side Trends
    • Technology Roadmap Analysis
    • Analysis and Recommendations
  2. Market Overview
    • Market Coverage / Taxonomy
    • Market Definition / Scope / Limitations
  3. Market Background
    • Market Dynamics
      • Drivers
      • Restraints
      • Opportunity
      • Trends
    • Scenario Forecast
      • Demand in Optimistic Scenario
      • Demand in Likely Scenario
      • Demand in Conservative Scenario
    • Opportunity Map Analysis
    • Product Life Cycle Analysis
    • Supply Chain Analysis
    • Investment Feasibility Matrix
    • Value Chain Analysis
    • PESTLE and Porter’s Analysis
    • Regulatory Landscape
    • Regional Parent Market Outlook
    • Production and Consumption Statistics
    • Import and Export Statistics
  4. Global Market Analysis 2020 to 2024 and Forecast, 2025 to 2035
    • Historical Market Size Value (USD Million) Analysis, 2020 to 2024
    • Current and Future Market Size Value (USD Million) Projections, 2025 to 2035
      • Y-o-Y Growth Trend Analysis
      • Absolute $ Opportunity Analysis
  5. Global Market Pricing Analysis 2020 to 2024 and Forecast 2025 to 2035
  6. Global Market Analysis 2020 to 2024 and Forecast 2025 to 2035, By Product Type
    • Introduction / Key Findings
    • Historical Market Size Value (USD Million) Analysis By Product Type, 2020 to 2024
    • Current and Future Market Size Value (USD Million) Analysis and Forecast By Product Type, 2025 to 2035
      • Functional Beverages
        • GABA-Infused RTD Teas
        • GABA-Infused Juices
        • GABA-Infused Water
        • GABA-Infused Dairy & Plant-Based Milk
      • Nootropic Drinks
        • GABA + L-theanine
        • GABA + Adaptogens (Ashwagandha, Rhodiola)
        • GABA + CBD/Cannabidiol
      • Sleep & Relaxation Drinks
        • GABA Sleep Shots
        • GABA Nighttime RTDs
    • Y-o-Y Growth Trend Analysis By Product Type, 2020 to 2024
    • Absolute $ Opportunity Analysis By Product Type, 2025 to 2035
  7. Global Market Analysis 2020 to 2024 and Forecast 2025 to 2035, By GABA Source
    • Introduction / Key Findings
    • Historical Market Size Value (USD Million) Analysis By GABA Source, 2020 to 2024
    • Current and Future Market Size Value (USD Million) Analysis and Forecast By GABA Source, 2025 to 2035
      • Fermented GABA (microbial fermentation)
      • Synthetic GABA
      • Natural Extract-derived GABA (e.g., from brown rice, sprouts)
    • Y-o-Y Growth Trend Analysis By GABA Source, 2020 to 2024
    • Absolute $ Opportunity Analysis By GABA Source, 2025 to 2035
  8. Global Market Analysis 2020 to 2024 and Forecast 2025 to 2035, By Target Demographic
    • Introduction / Key Findings
    • Historical Market Size Value (USD Million) Analysis By Target Demographic, 2020 to 2024
    • Current and Future Market Size Value (USD Million) Analysis and Forecast By Target Demographic, 2025 to 2035
      • General Wellness Seekers
      • Mental Wellness/Stress Relief Consumers
      • Sports Recovery Users
    • Y-o-Y Growth Trend Analysis By Target Demographic, 2020 to 2024
    • Absolute $ Opportunity Analysis By Target Demographic, 2025 to 2035
  9. Global Market Analysis 2020 to 2024 and Forecast 2025 to 2035, By Sales Channel
    • Introduction / Key Findings
    • Historical Market Size Value (USD Million) Analysis By Sales Channel, 2020 to 2024
    • Current and Future Market Size Value (USD Million) Analysis and Forecast By Sales Channel, 2025 to 2035
      • Retail
        • Supermarkets/Hypermarkets
        • Health & Wellness Stores
      • Online
      • Foodservice (cafes, fitness centers)
      • Specialty Supplement Stores
    • Y-o-Y Growth Trend Analysis By Sales Channel, 2020 to 2024
    • Absolute $ Opportunity Analysis By Sales Channel, 2025 to 2035
  10. Global Market Analysis 2020 to 2024 and Forecast 2025 to 2035, By Packaging Format
    • Introduction / Key Findings
    • Historical Market Size Value (USD Million) Analysis By Packaging Format, 2020 to 2024
    • Current and Future Market Size Value (USD Million) Analysis and Forecast By Packaging Format, 2025 to 2035
      • Bottles (Plastic/Glass)
      • Cans
      • Single-serve Shots
      • Sachets (for mix-ins)
    • Y-o-Y Growth Trend Analysis By Packaging Format, 2020 to 2024
    • Absolute $ Opportunity Analysis By Packaging Format, 2025 to 2035
  11. Global Market Analysis 2020 to 2024 and Forecast 2025 to 2035, By Claims & Positioning
    • Introduction / Key Findings
    • Historical Market Size Value (USD Million) Analysis By Claims & Positioning, 2020 to 2024
    • Current and Future Market Size Value (USD Million) Analysis and Forecast By Claims & Positioning, 2025 to 2035
      • Stress Relief
      • Sleep Aid
      • Mood Enhancer
      • Cognitive Support
    • Y-o-Y Growth Trend Analysis By Claims & Positioning, 2020 to 2024
    • Absolute $ Opportunity Analysis By Claims & Positioning, 2025 to 2035
  12. Global Market Analysis 2020 to 2024 and Forecast 2025 to 2035, By Region
    • Introduction
    • Historical Market Size Value (USD Million) Analysis By Region, 2020 to 2024
    • Current Market Size Value (USD Million) Analysis and Forecast By Region, 2025 to 2035
      • North America
      • Latin America
      • Europe
      • East Asia
      • South Asia & Pacific
      • Middle East and Africa
    • Market Attractiveness Analysis By Region
  13. North America Market Analysis 2020 to 2024 and Forecast 2025 to 2035, By Country
    • Historical Market Size Value (USD Million) Trend Analysis By Market Taxonomy, 2020 to 2024
    • Market Size Value (USD Million) Forecast By Market Taxonomy, 2025 to 2035
      • By Country
        • U.S.
        • Canada
      • By Product Type
      • By GABA Source
      • By Target Demographic
      • By Sales Channel
      • By Packaging Format
      • By Claims & Positioning
    • Market Attractiveness Analysis
      • By Country
      • By Product Type
      • By GABA Source
      • By Target Demographic
      • By Sales Channel
      • By Packaging Format
      • By Claims & Positioning
    • Key Takeaways
  14. Latin America Market Analysis 2020 to 2024 and Forecast 2025 to 2035, By Country
    • Historical Market Size Value (USD Million) Trend Analysis By Market Taxonomy, 2020 to 2024
    • Market Size Value (USD Million) Forecast By Market Taxonomy, 2025 to 2035
      • By Country
        • Brazil
        • Mexico
        • Colombia
        • Rest of Latin America
      • By Product Type
      • By GABA Source
      • By Target Demographic
      • By Sales Channel
      • By Packaging Format
      • By Claims & Positioning
    • Market Attractiveness Analysis
      • By Country
      • By Product Type
      • By GABA Source
      • By Target Demographic
      • By Sales Channel
      • By Packaging Format
      • By Claims & Positioning
    • Key Takeaways
  15. Europe Market Analysis 2020 to 2024 and Forecast 2025 to 2035, By Country
    • Historical Market Size Value (USD Million) Trend Analysis By Market Taxonomy, 2020 to 2024
    • Market Size Value (USD Million) Forecast By Market Taxonomy, 2025 to 2035
      • By Country
        • Germany
        • U.K.
        • France
        • Italy
        • Spain
        • Belgium
        • Netherlands
        • Nordic
        • Switzerland
        • Russia
        • Poland
        • Rest of Europe
      • By Product Type
      • By GABA Source
      • By Target Demographic
      • By Sales Channel
      • By Packaging Format
      • By Claims & Positioning
    • Market Attractiveness Analysis
      • By Country
      • By Product Type
      • By GABA Source
      • By Target Demographic
      • By Sales Channel
      • By Packaging Format
      • By Claims & Positioning
    • Key Takeaways
  16. East Asia Market Analysis 2020 to 2024 and Forecast 2025 to 2035, By Country
    • Historical Market Size Value (USD Million) Trend Analysis By Market Taxonomy, 2020 to 2024
    • Market Size Value (USD Million) Forecast By Market Taxonomy, 2025 to 2035
      • By Country
        • China
        • Japan
        • South Korea
      • By Product Type
      • By GABA Source
      • By Target Demographic
      • By Sales Channel
      • By Packaging Format
      • By Claims & Positioning
    • Market Attractiveness Analysis
      • By Country
      • By Product Type
      • By GABA Source
      • By Target Demographic
      • By Sales Channel
      • By Packaging Format
      • By Claims & Positioning
    • Key Takeaways
  17. South Asia & Pacific Market Analysis 2020 to 2024 and Forecast 2025 to 2035, By Country
    • Historical Market Size Value (USD Million) Trend Analysis By Market Taxonomy, 2020 to 2024
    • Market Size Value (USD Million) Forecast By Market Taxonomy, 2025 to 2035
      • By Country
        • India
        • Thailand
        • Malaysia
        • Indonesia
        • Singapore
        • Vietnam
        • Australia
        • New Zealand
        • Rest of South Asia
      • By Product Type
      • By GABA Source
      • By Target Demographic
      • By Sales Channel
      • By Packaging Format
      • By Claims & Positioning
    • Market Attractiveness Analysis
      • By Country
      • By Product Type
      • By GABA Source
      • By Target Demographic
      • By Sales Channel
      • By Packaging Format
      • By Claims & Positioning
    • Key Takeaways
  18. Middle East and Africa Market Analysis 2020 to 2024 and Forecast 2025 to 2035, By Country
    • Historical Market Size Value (USD Million) Trend Analysis By Market Taxonomy, 2020 to 2024
    • Market Size Value (USD Million) Forecast By Market Taxonomy, 2025 to 2035
      • By Country
        • Turkey
        • UAE
        • Saudi Arabia
        • Israel
        • Other GCC Countries
        • North Africa
        • South Africa
      • By Product Type
      • By GABA Source
      • By Target Demographic
      • By Sales Channel
      • By Packaging Format
      • By Claims & Positioning
    • Market Attractiveness Analysis
      • By Country
      • By Product Type
      • By GABA Source
      • By Target Demographic
      • By Sales Channel
      • By Packaging Format
      • By Claims & Positioning
    • Key Takeaways
  19. Key Countries Market Analysis
    • U.S.
      • Pricing Analysis
      • Market Share Analysis, 2024
        • By Product Type
        • By GABA Source
        • By Target Demographic
        • By Sales Channel
        • By Packaging Format
        • By Claims & Positioning
    • Canada
      • Pricing Analysis
      • Market Share Analysis, 2024
        • By Product Type
        • By GABA Source
        • By Target Demographic
        • By Sales Channel
        • By Packaging Format
        • By Claims & Positioning
    • Brazil
      • Pricing Analysis
      • Market Share Analysis, 2024
        • By Product Type
        • By GABA Source
        • By Target Demographic
        • By Sales Channel
        • By Packaging Format
        • By Claims & Positioning
    • Mexico
      • Pricing Analysis
      • Market Share Analysis, 2024
        • By Product Type
        • By GABA Source
        • By Target Demographic
        • By Sales Channel
        • By Packaging Format
        • By Claims & Positioning
    • Colombia
      • Pricing Analysis
      • Market Share Analysis, 2024
        • By Product Type
        • By GABA Source
        • By Target Demographic
        • By Sales Channel
        • By Packaging Format
        • By Claims & Positioning
    • Rest of Latin America
      • Pricing Analysis
      • Market Share Analysis, 2024
        • By Product Type
        • By GABA Source
        • By Target Demographic
        • By Sales Channel
        • By Packaging Format
        • By Claims & Positioning
    • Germany
      • Pricing Analysis
      • Market Share Analysis, 2024
        • By Product Type
        • By GABA Source
        • By Target Demographic
        • By Sales Channel
        • By Packaging Format
        • By Claims & Positioning
    • U.K.
      • Pricing Analysis
      • Market Share Analysis, 2024
        • By Product Type
        • By GABA Source
        • By Target Demographic
        • By Sales Channel
        • By Packaging Format
        • By Claims & Positioning
    • France
      • Pricing Analysis
      • Market Share Analysis, 2024
        • By Product Type
        • By GABA Source
        • By Target Demographic
        • By Sales Channel
        • By Packaging Format
        • By Claims & Positioning
    • Italy
      • Pricing Analysis
      • Market Share Analysis, 2024
        • By Product Type
        • By GABA Source
        • By Target Demographic
        • By Sales Channel
        • By Packaging Format
        • By Claims & Positioning
    • Spain
      • Pricing Analysis
      • Market Share Analysis, 2024
        • By Product Type
        • By GABA Source
        • By Target Demographic
        • By Sales Channel
        • By Packaging Format
        • By Claims & Positioning
    • Belgium
      • Pricing Analysis
      • Market Share Analysis, 2024
        • By Product Type
        • By GABA Source
        • By Target Demographic
        • By Sales Channel
        • By Packaging Format
        • By Claims & Positioning
    • Netherlands
      • Pricing Analysis
      • Market Share Analysis, 2024
        • By Product Type
        • By GABA Source
        • By Target Demographic
        • By Sales Channel
        • By Packaging Format
        • By Claims & Positioning
    • Nordic
      • Pricing Analysis
      • Market Share Analysis, 2024
        • By Product Type
        • By GABA Source
        • By Target Demographic
        • By Sales Channel
        • By Packaging Format
        • By Claims & Positioning
    • Switzerland
      • Pricing Analysis
      • Market Share Analysis, 2024
        • By Product Type
        • By GABA Source
        • By Target Demographic
        • By Sales Channel
        • By Packaging Format
        • By Claims & Positioning
    • Russia
      • Pricing Analysis
      • Market Share Analysis, 2024
        • By Product Type
        • By GABA Source
        • By Target Demographic
        • By Sales Channel
        • By Packaging Format
        • By Claims & Positioning
    • Poland
      • Pricing Analysis
      • Market Share Analysis, 2024
        • By Product Type
        • By GABA Source
        • By Target Demographic
        • By Sales Channel
        • By Packaging Format
        • By Claims & Positioning
    • Rest of Europe
      • Pricing Analysis
      • Market Share Analysis, 2024
        • By Product Type
        • By GABA Source
        • By Target Demographic
        • By Sales Channel
        • By Packaging Format
        • By Claims & Positioning
    • China
      • Pricing Analysis
      • Market Share Analysis, 2024
        • By Product Type
        • By GABA Source
        • By Target Demographic
        • By Sales Channel
        • By Packaging Format
        • By Claims & Positioning
    • Japan
      • Pricing Analysis
      • Market Share Analysis, 2024
        • By Product Type
        • By GABA Source
        • By Target Demographic
        • By Sales Channel
        • By Packaging Format
        • By Claims & Positioning
    • South Korea
      • Pricing Analysis
      • Market Share Analysis, 2024
        • By Product Type
        • By GABA Source
        • By Target Demographic
        • By Sales Channel
        • By Packaging Format
        • By Claims & Positioning
    • India
      • Pricing Analysis
      • Market Share Analysis, 2024
        • By Product Type
        • By GABA Source
        • By Target Demographic
        • By Sales Channel
        • By Packaging Format
        • By Claims & Positioning
    • Thailand
      • Pricing Analysis
      • Market Share Analysis, 2024
        • By Product Type
        • By GABA Source
        • By Target Demographic
        • By Sales Channel
        • By Packaging Format
        • By Claims & Positioning
    • Malaysia
      • Pricing Analysis
      • Market Share Analysis, 2024
        • By Product Type
        • By GABA Source
        • By Target Demographic
        • By Sales Channel
        • By Packaging Format
        • By Claims & Positioning
    • Indonesia
      • Pricing Analysis
      • Market Share Analysis, 2024
        • By Product Type
        • By GABA Source
        • By Target Demographic
        • By Sales Channel
        • By Packaging Format
        • By Claims & Positioning
    • Singapore
      • Pricing Analysis
      • Market Share Analysis, 2024
        • By Product Type
        • By GABA Source
        • By Target Demographic
        • By Sales Channel
        • By Packaging Format
        • By Claims & Positioning
    • Vietnam
      • Pricing Analysis
      • Market Share Analysis, 2024
        • By Product Type
        • By GABA Source
        • By Target Demographic
        • By Sales Channel
        • By Packaging Format
        • By Claims & Positioning
    • Australia
      • Pricing Analysis
      • Market Share Analysis, 2024
        • By Product Type
        • By GABA Source
        • By Target Demographic
        • By Sales Channel
        • By Packaging Format
        • By Claims & Positioning
    • New Zealand
      • Pricing Analysis
      • Market Share Analysis, 2024
        • By Product Type
        • By GABA Source
        • By Target Demographic
        • By Sales Channel
        • By Packaging Format
        • By Claims & Positioning
    • Rest of South Asia
      • Pricing Analysis
      • Market Share Analysis, 2024
        • By Product Type
        • By GABA Source
        • By Target Demographic
        • By Sales Channel
        • By Packaging Format
        • By Claims & Positioning
  20. Market Structure Analysis
    • Competition Dashboard
    • Competition Benchmarking
    • Market Share Analysis of Top Players
      • By Regional
      • By Product Type
      • By GABA Source
      • By Target Demographic
      • By Sales Channel
      • By Packaging Format
      • By Claims & Positioning
  21. Competition Analysis
    • Competition Deep Dive
      • Suntory Holdings (Iyemon Tokucha, Suntory GABA Tea)
        • Overview
        • Product Portfolio
        • Profitability by Market Segments (Product/Age /Sales Channel/Region)
        • Sales Footprint
        • Strategy Overview
        • PepsiCo (Driftwell)
        • Neurobrands LLC (Neuro Sleep)
        • Big K Beverages (Vibe Relaxation Drinks)
        • Tranquini (Tranquini Original, Jade)
  22. Assumptions & Acronyms Used
  23. Research Methodology

List of Tables

  • Table 1: Global Market Value (USD Million) Forecast by Region, 2020-2035
  • Table 2: Global Market Value (USD Million) Forecast by Product Type, 2020-2035
  • Table 3: Global Market Value (USD Million) Forecast by GABA Source, 2020-2035
  • Table 4: Global Market Value (USD Million) Forecast by Target Demographic, 2020-2035
  • Table 5: Global Market Value (USD Million) Forecast by Sales Channel, 2020-2035
  • Table 6: Global Market Value (USD Million) Forecast by Packaging Format, 2020-2035
  • Table 7: Global Market Value (USD Million) Forecast by Claims & Positioning, 2020-2035
  • Table 8: North America Market Value (USD Million) Forecast by Country, 2020-2035
  • Table 9: North America Market Value (USD Million) Forecast by Product Type, 2020-2035
  • Table 10: North America Market Value (USD Million) Forecast by GABA Source, 2020-2035
  • Table 11: North America Market Value (USD Million) Forecast by Target Demographic, 2020-2035
  • Table 12: North America Market Value (USD Million) Forecast by Sales Channel, 2020-2035
  • Table 13: North America Market Value (USD Million) Forecast by Packaging Format, 2020-2035
  • Table 14: North America Market Value (USD Million) Forecast by Claims & Positioning, 2020-2035
  • Table 15: Latin America Market Value (USD Million) Forecast by Country, 2020-2035
  • Table 16: Latin America Market Value (USD Million) Forecast by Product Type, 2020-2035
  • Table 17: Latin America Market Value (USD Million) Forecast by GABA Source, 2020-2035
  • Table 18: Latin America Market Value (USD Million) Forecast by Target Demographic, 2020-2035
  • Table 19: Latin America Market Value (USD Million) Forecast by Sales Channel, 2020-2035
  • Table 20: Latin America Market Value (USD Million) Forecast by Packaging Format, 2020-2035
  • Table 21: Latin America Market Value (USD Million) Forecast by Claims & Positioning, 2020-2035
  • Table 22: Europe Market Value (USD Million) Forecast by Country, 2020-2035
  • Table 23: Europe Market Value (USD Million) Forecast by Product Type, 2020-2035
  • Table 24: Europe Market Value (USD Million) Forecast by GABA Source, 2020-2035
  • Table 25: Europe Market Value (USD Million) Forecast by Target Demographic, 2020-2035
  • Table 26: Europe Market Value (USD Million) Forecast by Sales Channel, 2020-2035
  • Table 27: Europe Market Value (USD Million) Forecast by Packaging Format, 2020-2035
  • Table 28: Europe Market Value (USD Million) Forecast by Claims & Positioning, 2020-2035
  • Table 29: East Asia Market Value (USD Million) Forecast by Country, 2020-2035
  • Table 30: East Asia Market Value (USD Million) Forecast by Product Type, 2020-2035
  • Table 31: East Asia Market Value (USD Million) Forecast by GABA Source, 2020-2035
  • Table 32: East Asia Market Value (USD Million) Forecast by Target Demographic, 2020-2035
  • Table 33: East Asia Market Value (USD Million) Forecast by Sales Channel, 2020-2035
  • Table 34: East Asia Market Value (USD Million) Forecast by Packaging Format, 2020-2035
  • Table 35: East Asia Market Value (USD Million) Forecast by Claims & Positioning, 2020-2035
  • Table 36: South Asia & Pacific Market Value (USD Million) Forecast by Country, 2020-2035
  • Table 37: South Asia & Pacific Market Value (USD Million) Forecast by Product Type, 2020-2035
  • Table 38: South Asia & Pacific Market Value (USD Million) Forecast by GABA Source, 2020-2035
  • Table 39: South Asia & Pacific Market Value (USD Million) Forecast by Target Demographic, 2020-2035
  • Table 40: South Asia & Pacific Market Value (USD Million) Forecast by Sales Channel, 2020-2035
  • Table 41: South Asia & Pacific Market Value (USD Million) Forecast by Packaging Format, 2020-2035
  • Table 42: South Asia & Pacific Market Value (USD Million) Forecast by Claims & Positioning, 2020-2035
  • Table 43: Middle East and Africa Market Value (USD Million) Forecast by Country, 2020-2035
  • Table 44: Middle East and Africa Market Value (USD Million) Forecast by Product Type, 2020-2035
  • Table 45: Middle East and Africa Market Value (USD Million) Forecast by GABA Source, 2020-2035
  • Table 46: Middle East and Africa Market Value (USD Million) Forecast by Target Demographic, 2020-2035
  • Table 47: Middle East and Africa Market Value (USD Million) Forecast by Sales Channel, 2020-2035
  • Table 48: Middle East and Africa Market Value (USD Million) Forecast by Packaging Format, 2020-2035
  • Table 49: Middle East and Africa Market Value (USD Million) Forecast by Claims & Positioning, 2020-2035

List of Figures

  • Figure 1: Global Market Pricing Analysis
  • Figure 2: Global Market Value (USD Million) Forecast 2020-2035
  • Figure 3: Global Market Value Share and BPS Analysis by Product Type, 2025 and 2035
  • Figure 4: Global Market Y-o-Y Growth Comparison by Product Type, 2025-2035
  • Figure 5: Global Market Attractiveness Analysis by Product Type
  • Figure 6: Global Market Value Share and BPS Analysis by GABA Source, 2025 and 2035
  • Figure 7: Global Market Y-o-Y Growth Comparison by GABA Source, 2025-2035
  • Figure 8: Global Market Attractiveness Analysis by GABA Source
  • Figure 9: Global Market Value Share and BPS Analysis by Target Demographic, 2025 and 2035
  • Figure 10: Global Market Y-o-Y Growth Comparison by Target Demographic, 2025-2035
  • Figure 11: Global Market Attractiveness Analysis by Target Demographic
  • Figure 12: Global Market Value Share and BPS Analysis by Sales Channel, 2025 and 2035
  • Figure 13: Global Market Y-o-Y Growth Comparison by Sales Channel, 2025-2035
  • Figure 14: Global Market Attractiveness Analysis by Sales Channel
  • Figure 15: Global Market Value Share and BPS Analysis by Packaging Format, 2025 and 2035
  • Figure 16: Global Market Y-o-Y Growth Comparison by Packaging Format, 2025-2035
  • Figure 17: Global Market Attractiveness Analysis by Packaging Format
  • Figure 18: Global Market Value Share and BPS Analysis by Claims & Positioning, 2025 and 2035
  • Figure 19: Global Market Y-o-Y Growth Comparison by Claims & Positioning, 2025-2035
  • Figure 20: Global Market Attractiveness Analysis by Claims & Positioning
  • Figure 21: Global Market Value (USD Million) Share and BPS Analysis by Region, 2025 and 2035
  • Figure 22: Global Market Y-o-Y Growth Comparison by Region, 2025-2035
  • Figure 23: Global Market Attractiveness Analysis by Region
  • Figure 24: North America Market Incremental $ Opportunity, 2025-2035
  • Figure 25: Latin America Market Incremental $ Opportunity, 2025-2035
  • Figure 26: Europe Market Incremental $ Opportunity, 2025-2035
  • Figure 27: East Asia Market Incremental $ Opportunity, 2025-2035
  • Figure 28: South Asia & Pacific Market Incremental $ Opportunity, 2025-2035
  • Figure 29: Middle East and Africa Market Incremental $ Opportunity, 2025-2035
  • Figure 30: North America Market Value Share and BPS Analysis by Country, 2025 and 2035
  • Figure 31: North America Market Value Share and BPS Analysis by Product Type, 2025 and 2035
  • Figure 32: North America Market Y-o-Y Growth Comparison by Product Type, 2025-2035
  • Figure 33: North America Market Attractiveness Analysis by Product Type
  • Figure 34: North America Market Value Share and BPS Analysis by GABA Source, 2025 and 2035
  • Figure 35: North America Market Y-o-Y Growth Comparison by GABA Source, 2025-2035
  • Figure 36: North America Market Attractiveness Analysis by GABA Source
  • Figure 37: North America Market Value Share and BPS Analysis by Target Demographic, 2025 and 2035
  • Figure 38: North America Market Y-o-Y Growth Comparison by Target Demographic, 2025-2035
  • Figure 39: North America Market Attractiveness Analysis by Target Demographic
  • Figure 40: North America Market Value Share and BPS Analysis by Sales Channel, 2025 and 2035
  • Figure 41: North America Market Y-o-Y Growth Comparison by Sales Channel, 2025-2035
  • Figure 42: North America Market Attractiveness Analysis by Sales Channel
  • Figure 43: North America Market Value Share and BPS Analysis by Packaging Format, 2025 and 2035
  • Figure 44: North America Market Y-o-Y Growth Comparison by Packaging Format, 2025-2035
  • Figure 45: North America Market Attractiveness Analysis by Packaging Format
  • Figure 46: North America Market Value Share and BPS Analysis by Claims & Positioning, 2025 and 2035
  • Figure 47: North America Market Y-o-Y Growth Comparison by Claims & Positioning, 2025-2035
  • Figure 48: North America Market Attractiveness Analysis by Claims & Positioning
  • Figure 49: Latin America Market Value Share and BPS Analysis by Country, 2025 and 2035
  • Figure 50: Latin America Market Value Share and BPS Analysis by Product Type, 2025 and 2035
  • Figure 51: Latin America Market Y-o-Y Growth Comparison by Product Type, 2025-2035
  • Figure 52: Latin America Market Attractiveness Analysis by Product Type
  • Figure 53: Latin America Market Value Share and BPS Analysis by GABA Source, 2025 and 2035
  • Figure 54: Latin America Market Y-o-Y Growth Comparison by GABA Source, 2025-2035
  • Figure 55: Latin America Market Attractiveness Analysis by GABA Source
  • Figure 56: Latin America Market Value Share and BPS Analysis by Target Demographic, 2025 and 2035
  • Figure 57: Latin America Market Y-o-Y Growth Comparison by Target Demographic, 2025-2035
  • Figure 58: Latin America Market Attractiveness Analysis by Target Demographic
  • Figure 59: Latin America Market Value Share and BPS Analysis by Sales Channel, 2025 and 2035
  • Figure 60: Latin America Market Y-o-Y Growth Comparison by Sales Channel, 2025-2035
  • Figure 61: Latin America Market Attractiveness Analysis by Sales Channel
  • Figure 62: Latin America Market Value Share and BPS Analysis by Packaging Format, 2025 and 2035
  • Figure 63: Latin America Market Y-o-Y Growth Comparison by Packaging Format, 2025-2035
  • Figure 64: Latin America Market Attractiveness Analysis by Packaging Format
  • Figure 65: Latin America Market Value Share and BPS Analysis by Claims & Positioning, 2025 and 2035
  • Figure 66: Latin America Market Y-o-Y Growth Comparison by Claims & Positioning, 2025-2035
  • Figure 67: Latin America Market Attractiveness Analysis by Claims & Positioning
  • Figure 68: Europe Market Value Share and BPS Analysis by Country, 2025 and 2035
  • Figure 69: Europe Market Value Share and BPS Analysis by Product Type, 2025 and 2035
  • Figure 70: Europe Market Y-o-Y Growth Comparison by Product Type, 2025-2035
  • Figure 71: Europe Market Attractiveness Analysis by Product Type
  • Figure 72: Europe Market Value Share and BPS Analysis by GABA Source, 2025 and 2035
  • Figure 73: Europe Market Y-o-Y Growth Comparison by GABA Source, 2025-2035
  • Figure 74: Europe Market Attractiveness Analysis by GABA Source
  • Figure 75: Europe Market Value Share and BPS Analysis by Target Demographic, 2025 and 2035
  • Figure 76: Europe Market Y-o-Y Growth Comparison by Target Demographic, 2025-2035
  • Figure 77: Europe Market Attractiveness Analysis by Target Demographic
  • Figure 78: Europe Market Value Share and BPS Analysis by Sales Channel, 2025 and 2035
  • Figure 79: Europe Market Y-o-Y Growth Comparison by Sales Channel, 2025-2035
  • Figure 80: Europe Market Attractiveness Analysis by Sales Channel
  • Figure 81: Europe Market Value Share and BPS Analysis by Packaging Format, 2025 and 2035
  • Figure 82: Europe Market Y-o-Y Growth Comparison by Packaging Format, 2025-2035
  • Figure 83: Europe Market Attractiveness Analysis by Packaging Format
  • Figure 84: Europe Market Value Share and BPS Analysis by Claims & Positioning, 2025 and 2035
  • Figure 85: Europe Market Y-o-Y Growth Comparison by Claims & Positioning, 2025-2035
  • Figure 86: Europe Market Attractiveness Analysis by Claims & Positioning
  • Figure 87: East Asia Market Value Share and BPS Analysis by Country, 2025 and 2035
  • Figure 88: East Asia Market Value Share and BPS Analysis by Product Type, 2025 and 2035
  • Figure 89: East Asia Market Y-o-Y Growth Comparison by Product Type, 2025-2035
  • Figure 90: East Asia Market Attractiveness Analysis by Product Type
  • Figure 91: East Asia Market Value Share and BPS Analysis by GABA Source, 2025 and 2035
  • Figure 92: East Asia Market Y-o-Y Growth Comparison by GABA Source, 2025-2035
  • Figure 93: East Asia Market Attractiveness Analysis by GABA Source
  • Figure 94: East Asia Market Value Share and BPS Analysis by Target Demographic, 2025 and 2035
  • Figure 95: East Asia Market Y-o-Y Growth Comparison by Target Demographic, 2025-2035
  • Figure 96: East Asia Market Attractiveness Analysis by Target Demographic
  • Figure 97: East Asia Market Value Share and BPS Analysis by Sales Channel, 2025 and 2035
  • Figure 98: East Asia Market Y-o-Y Growth Comparison by Sales Channel, 2025-2035
  • Figure 99: East Asia Market Attractiveness Analysis by Sales Channel
  • Figure 100: East Asia Market Value Share and BPS Analysis by Packaging Format, 2025 and 2035
  • Figure 101: East Asia Market Y-o-Y Growth Comparison by Packaging Format, 2025-2035
  • Figure 102: East Asia Market Attractiveness Analysis by Packaging Format
  • Figure 103: East Asia Market Value Share and BPS Analysis by Claims & Positioning, 2025 and 2035
  • Figure 104: East Asia Market Y-o-Y Growth Comparison by Claims & Positioning, 2025-2035
  • Figure 105: East Asia Market Attractiveness Analysis by Claims & Positioning
  • Figure 106: South Asia & Pacific Market Value Share and BPS Analysis by Country, 2025 and 2035
  • Figure 107: South Asia & Pacific Market Value Share and BPS Analysis by Product Type, 2025 and 2035
  • Figure 108: South Asia & Pacific Market Y-o-Y Growth Comparison by Product Type, 2025-2035
  • Figure 109: South Asia & Pacific Market Attractiveness Analysis by Product Type
  • Figure 110: South Asia & Pacific Market Value Share and BPS Analysis by GABA Source, 2025 and 2035
  • Figure 111: South Asia & Pacific Market Y-o-Y Growth Comparison by GABA Source, 2025-2035
  • Figure 112: South Asia & Pacific Market Attractiveness Analysis by GABA Source
  • Figure 113: South Asia & Pacific Market Value Share and BPS Analysis by Target Demographic, 2025 and 2035
  • Figure 114: South Asia & Pacific Market Y-o-Y Growth Comparison by Target Demographic, 2025-2035
  • Figure 115: South Asia & Pacific Market Attractiveness Analysis by Target Demographic
  • Figure 116: South Asia & Pacific Market Value Share and BPS Analysis by Sales Channel, 2025 and 2035
  • Figure 117: South Asia & Pacific Market Y-o-Y Growth Comparison by Sales Channel, 2025-2035
  • Figure 118: South Asia & Pacific Market Attractiveness Analysis by Sales Channel
  • Figure 119: South Asia & Pacific Market Value Share and BPS Analysis by Packaging Format, 2025 and 2035
  • Figure 120: South Asia & Pacific Market Y-o-Y Growth Comparison by Packaging Format, 2025-2035
  • Figure 121: South Asia & Pacific Market Attractiveness Analysis by Packaging Format
  • Figure 122: South Asia & Pacific Market Value Share and BPS Analysis by Claims & Positioning, 2025 and 2035
  • Figure 123: South Asia & Pacific Market Y-o-Y Growth Comparison by Claims & Positioning, 2025-2035
  • Figure 124: South Asia & Pacific Market Attractiveness Analysis by Claims & Positioning
  • Figure 125: Middle East and Africa Market Value Share and BPS Analysis by Country, 2025 and 2035
  • Figure 126: Middle East and Africa Market Value Share and BPS Analysis by Product Type, 2025 and 2035
  • Figure 127: Middle East and Africa Market Y-o-Y Growth Comparison by Product Type, 2025-2035
  • Figure 128: Middle East and Africa Market Attractiveness Analysis by Product Type
  • Figure 129: Middle East and Africa Market Value Share and BPS Analysis by GABA Source, 2025 and 2035
  • Figure 130: Middle East and Africa Market Y-o-Y Growth Comparison by GABA Source, 2025-2035
  • Figure 131: Middle East and Africa Market Attractiveness Analysis by GABA Source
  • Figure 132: Middle East and Africa Market Value Share and BPS Analysis by Target Demographic, 2025 and 2035
  • Figure 133: Middle East and Africa Market Y-o-Y Growth Comparison by Target Demographic, 2025-2035
  • Figure 134: Middle East and Africa Market Attractiveness Analysis by Target Demographic
  • Figure 135: Middle East and Africa Market Value Share and BPS Analysis by Sales Channel, 2025 and 2035
  • Figure 136: Middle East and Africa Market Y-o-Y Growth Comparison by Sales Channel, 2025-2035
  • Figure 137: Middle East and Africa Market Attractiveness Analysis by Sales Channel
  • Figure 138: Middle East and Africa Market Value Share and BPS Analysis by Packaging Format, 2025 and 2035
  • Figure 139: Middle East and Africa Market Y-o-Y Growth Comparison by Packaging Format, 2025-2035
  • Figure 140: Middle East and Africa Market Attractiveness Analysis by Packaging Format
  • Figure 141: Middle East and Africa Market Value Share and BPS Analysis by Claims & Positioning, 2025 and 2035
  • Figure 142: Middle East and Africa Market Y-o-Y Growth Comparison by Claims & Positioning, 2025-2035
  • Figure 143: Middle East and Africa Market Attractiveness Analysis by Claims & Positioning
  • Figure 144: Global Market - Tier Structure Analysis
  • Figure 145: Global Market - Company Share Analysis

Frequently Asked Questions

How big is the GABA-Infused Drinks Market in 2025?

The global GABA-Infused Drinks Market is estimated to be valued at USD 697.2 million in 2025.

What will be the size of the GABA-Infused Drinks Market in 2035?

The GABA-Infused Drinks Market size is projected to reach USD 1,255.8 million by 2035.

How much will the GABA-Infused Drinks Market grow between 2025 and 2035?

The GABA-Infused Drinks Market is expected to expand at a CAGR of 6.1% between 2025 and 2035.

What are the key product types in the GABA-Infused Drinks Market?

The key product types in the GABA-Infused Drinks Market include Functional Beverages (50% share, 2025), Nootropic Drinks (25%), and Sleep & Relaxation Drinks (25%).

Which GABA source segment is expected to dominate in 2025?

Fermented GABA is projected to command a 55% share in 2025, a leadership position supported by Japan’s regulatory comfort with fermentation technologies and global consumer preference for natural, science-backed formulations.

Explore Similar Insights

Future Market Insights

GABA-Infused Drinks Market