Beauty-from-Within Drinks Market Size and Share Forecast Outlook 2025 to 2035

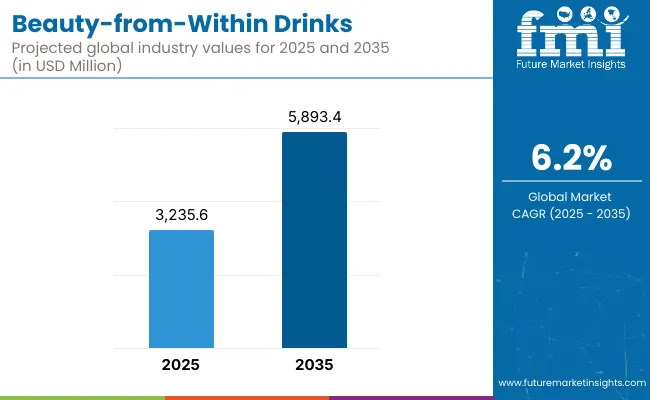
The global Beauty-from-Within Drinks Market is projected to be valued at USD 3,235.6 million in 2025, with a rise to USD 5,893.4 million by 2035, marking an absolute growth of USD 2,657.8 million over the decade. This expansion reflects a 6.2% CAGR, underpinned by measurable consumer shifts toward ingestible skincare solutions that bridge functional nutrition and aesthetic enhancement.
Quick Stats for Beauty-from-Within Drinks

  • Beauty-from-Within Drinks Value (2025): USD 3,235.6 million
  • Beauty-from-Within Drinks Forecast Value (2035): USD 5,893.4 million
  • Beauty-from-Within Drinks Forecast CAGR: 6.2%
  • Leading Segment in Beauty-from-Within Drinks in 2025, by Product Format: Ready-to-Drink (RTD) Bottles (35%).
  • Key Growth Regions in the Beauty-from-Within Drinks: North America, Asia-Pacific, Europe
  • Top Key Players in Beauty-from-Within Drinks: Vital Proteins, NeoCell, HUM Nutrition, Olly Nutrition, Skinade, Garden of Life, The Beauty Chef, Reserveage Nutrition, Sakara, and Collagen by Watsons

Beauty From Within Drinks

Beauty-from-Within Drinks Key Takeaways

Metric Value
Beauty-from-Within Drinks Estimated Value in (2025E) USD 3,235.6 million
Beauty-from-Within Drinks Forecast Value in (2035F) USD 5,893.4 million
Forecast CAGR (2025 to 2035) 6.2%

Demand is expected to be shaped not only by wellness trends but by verifiable performance claims, traceable ingredient sourcing, and innovations in bioavailability. During the first half of the decade (2025 to 2035), the market is forecast to increase by USD 1,077.5 million, reaching an estimated USD 4,313.1 million.

Growth during this period is expected to be concentrated around collagen peptide-based and hyaluronic acid-infused formulations, where evidence-backed skin hydration and elasticity outcomes have driven repeat usage. Influencer-backed brand activations and wellness subscription models are projected to catalyze consumer adoption, especially among digitally native demographics in East Asia and North America.

From 2030 to 2035, an additional USD 1,580.3 million in revenue is anticipated, signaling stronger mainstream penetration as regulatory harmonization, clean-label certifications, and personalization engines redefine product differentiation. Beauty-from-within drinks are projected to transition from niche premium offerings to core components of daily self-care routines, with growth led by adaptogen-infused and microbiome-supporting formats.

As science-led storytelling and AI-curated formulations become standard, the category is expected to shift toward clinically integrated beauty systems, further embedding these beverages within lifestyle-driven health regimens.

From 2020 to 2024, the Beauty-from-Within Drinks Market expanded from USD1,970 million to USD 3,235.6 million, driven by collagen-based RTD beverages and clean-label powdered drink mixes. During this period, the competitive landscape was led by USA-based and Australian-origin brands offering clinically supported, digitally native formulations. Influencer-led personalization and wellness subscription models dominated growth, while mainstream supplement brands began entering the beverage segment.

By 2025, the market is forecasted to reach USD 3,235.6 million, with a revenue shift toward science-driven personalizationand hybrid topical-ingestible ecosystems. Traditional supplement leaders are being challenged by beauty-tech startups offering AI-backed product pairing, microbiome-targeted drinks, and D2C platforms. Competitive edge is expected to move from brand recall alone to clinical validation, delivery format innovation, and consumer data integration across digital wellness touchpoints.

Why the Beauty-from-Within Drinks is growing?

Growth in the Beauty-from-Within Drinks Market is being driven by a fundamental shift in consumer behavior, where beauty is increasingly viewed through the lens of holistic wellness. Traditional topical routines are being complemented and in many cases, replaced by ingestible solutions that promise measurable internal benefits for skin, hair, and nails.

The category’s momentum has been reinforced by clinical validation of key bioactives. For example, a 2023 Nestlé Health Science white paper reported a statistically significant reduction in wrinkle depth and skin roughness among users consuming collagen-based RTD beverages for 90 days.

Convenience and palatability advantages are being realized through ready-to-drink and powdered mix formats, which are being favored over pills or capsules. Personalized wellness journeys are being enabled through digital platforms, where ingredient transparency and targeted claims are influencing brand loyalty. Concurrently, rising environmental stressors and lifestyle-induced skin issues are fueling demand for ingestible beauty regimens that support skin health from within.

Supportive regulatory clarity and widespread access via e-commerce and D2C platforms have expanded consumer reach. Influencer marketing, peer reviews, and clinical storytelling are amplifying adoption, especially among younger demographics. As beauty-from-within products are integrated into spa, salon, and specialty health retail formats, this category is expected to transition from emerging trend to core wellness staple.

Segmental Analysis

The Beauty-from-Within Drinks Market has been segmented across active ingredient type, product format, benefit claim, target consumer, sales channel, and packaging type to capture the nuanced evolution of product development and demand behavior. Ingredient segmentation has been defined by the bio functional actives used-ranging from collagen peptides and hyaluronic acid to adaptogen and marine extracts-each aligned to specific efficacy outcomes.

Product formats have been structured around consumption convenience, including ready-to-drink (RTD) bottles, powdered mixes, and concentrated shots. Functional benefits have been categorized by claims such as anti-aging, hydration, detoxification, and gut-skin health-each reflecting emerging priorities in preventative beauty. Segmentation by consumer profile has recognized women, men, and unisex positioning, enabling tailored marketing strategies.

Distribution has been mapped through Omni channel pathways, including e-commerce, specialty health retailers, salons, and D2C models. Finally, packaging segmentation has accounted for unit economics, sustainability, and user experience, featuring bottles, sachets, and multi-pack formats designed for on-the-go wellness integration.
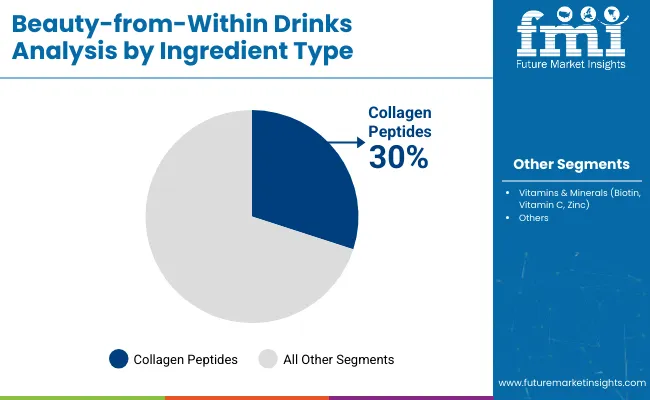
Insights into the Active Ingredient Type Segment with Collagen Peptides Leading in Market Share

Beauty From Within Drinks Analysis By Ingredient Type

Active Ingredient Type 2025 Share %
Collagen Peptides 30%
Vitamins & Minerals (Biotin, Vitamin C, Zinc) 12%

Collagen peptides are expected to capture 30% of the total market share in 2025, supported by extensive clinical validation of their role in improving skin elasticity and hydration. According to studies published in the Journal of Cosmetic Dermatology (2024), daily intake of hydrolyzed collagen peptides resulted in a 20% increase in skin firmness within 8 weeks.

This leadership is being sustained by high clinical credibility in enhancing skin elasticity, moisture retention, and wrinkle reduction. A CAGR of 9.00% is forecasted as consumers increasingly demand ingestible formats with visible results. The segment is being strengthened by improved hydrolyzation techniques and dual-benefit positioning, such as joint and bone health.

Meanwhile, hyaluronic acid, holding 10% share, is gaining favor for its water-binding properties, especially in hydration-focused beverages. Vitamins and minerals, accounting for 12%, remain essential support actives, often used in synergistic blends to enhance absorption and cellular regeneration. Growth across all three is being reinforced by formulation science, transparent labeling, and outcome-oriented marketing.
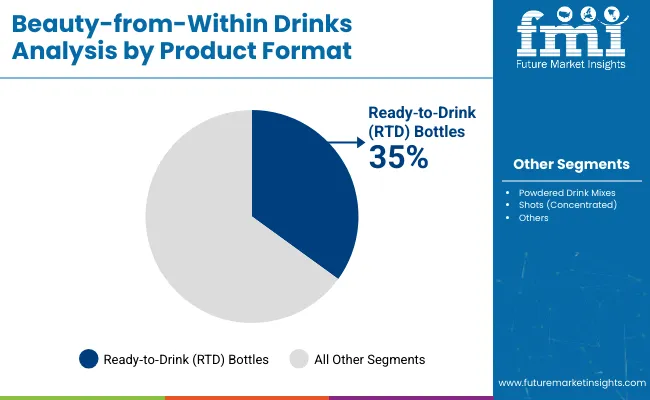
Insights into the Product Format Segment with Ready to Drink (RTD) Bottles Dominating the Demand

Beauty From Within Drinks Analysis By Product Format

Product Format 2025 Share %
Ready to Drink (RTD) Bottles 35%
Powdered Drink Mixes 25%
Shots (Concentrated) 15%

Ready-to-Drink (RTD) bottles are projected to lead the market in 2025 with a 35% share, driven by consumer preference for convenient, no-prep beauty solutions. According to a 2025 Euromonitor survey, 62% of wellness-focused consumers in urban Asia reported daily RTD collagen drink consumption as part of their skincare regimen. Their CAGR of 9.20% underscores continued consumer preference for liquid formats that offer immediacy and ease of use.

Powdered drink mixes, with a 25% share, are being favored for customization, lower shipping costs, and clean-label adaptability. Their 9.40% CAGR reflects rising traction in subscription-based D2C models. Concentrated shots, projected at 15% share, are benefiting from high nutrient density and format novelty, with a strong 9.70% CAGR, the highest among all formats. These three formats are expected to dominate future formulations as functionality, convenience, and user engagement are prioritized in product development.
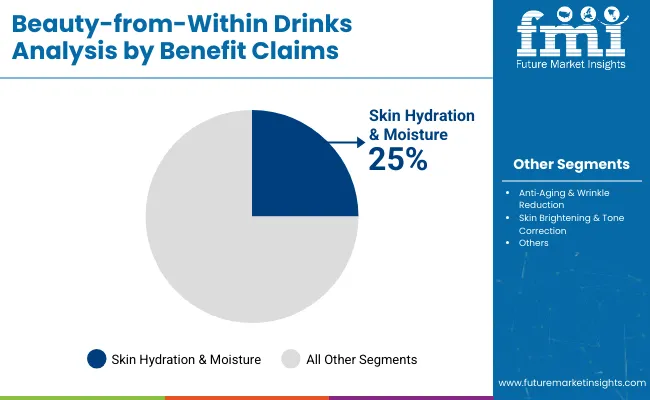
Insights into the Benefit Claims Segment with Focus on Skin Hydration & Moisture

Beauty From Within Drinks Analysis By Benifits Claims

Benefit Claims 2025 Share %
Skin Hydration & Moisture 25%
Anti Aging & Wrinkle Reduction 25%
Skin Brightening & Tone Correction 15%

In 2025, skin hydration and anti-aging are each projected to command 25% of the market, together accounting for half of the category’s total value. Anti-aging’s 9.60% CAGR is expected to lead all claim types, driven by increasing consumer focus on collagen preservation, wrinkle smoothing, and elasticity improvement-often backed by dermatologist-endorsed studies.

Simultaneously, hydration claims are being driven by hyaluronic acid, ceramides, and electrolyte-based formulations, with a CAGR of 9.30%. As consumers shift toward preventive approaches and functional aesthetics, both claims are expected to remain top drivers of formulation strategy.

Skin brightening, holding 15% share, continues to rise in Asia and Latin America, where tone correction and radiance enhancement are strongly prioritized. Its 9.20% CAGR is supported by the use of antioxidant-rich botanicals and vitamin C-enriched blends.

What are the Drivers, Restraints, and Key Trends of the Beauty-from-Within Drinks?

Ingredient innovation and consumer demand for multifunctional wellness products have fueled the rise of beauty-from-within drinks, yet challenges persist in maintaining scientific credibility and navigating fragmented regulations. As category maturity deepens, the market is being redefined by clinically supported formulations, direct-to-consumer strategies, and personalized delivery formats.

Scientifically Backed Ingredient Efficacy Is Reshaping Consumer Trust

A major driver has been the growing body of peer-reviewed evidence validating the efficacy of ingredients such as collagen peptides, hyaluronic acid, and ceramides. A 2024 study in Clinical Nutrition Journal demonstrated a 28% improvement in dermal hydration after daily oral intake of hyaluronic acid over 6 weeks. Products making evidence-backed claims have been met with higher consumer trust and repeat purchase intent.

Formulations with quantifiable outcomes-such as improved hydration or wrinkle depth reduction-are being preferred, especially in premium pricing tiers. As demand shifts toward measurable functionality over aspirational marketing, brand portfolios are being repositioned around bioavailability, absorption rates, and synergistic ingredient stacks. This scientific rigor is expected to elevate category legitimacy and drive greater penetration in medically inclined wellness segments.

Personalized Beauty-From-Within Routines Are Being Normalized

A key trend has been the normalization of personalized ingestible beauty routines, enabled by AI-driven recommendation engines, skin diagnostics, and DNA-based assessments. These technologies are being integrated into beauty apps, D2C subscription models, and wellness ecosystems. As consumer expectations evolve from general benefits to targeted outcomes, brands are being compelled to deliver hyper-customized solutions aligned with skin type, age, lifestyle, and environment.
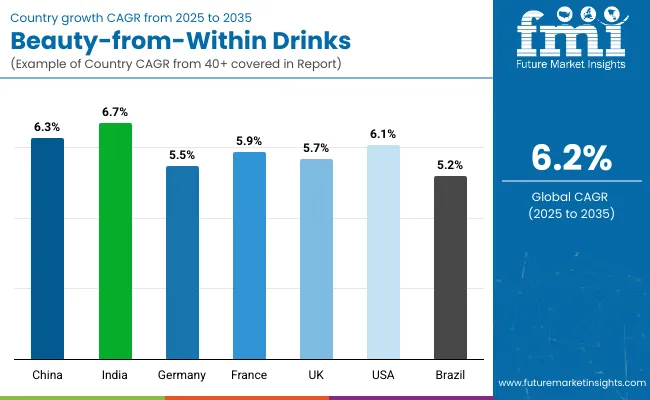
Analysis of Beauty-from-Within Drinksby Key Countries

Beauty From Within Drinks Country Wise Analysis

Country CAGR (2025 to 2035)
China 6.3%
India 6.7%
Germany 5.5%
France 5.9%
UK 5.7%
USA 6.1%
Brazil 5.2%

Growth within the global Beauty-from-Within Drinks Market is being shaped by pronounced regional dynamics, reflecting variations in consumer awareness, wellness infrastructure, and regulatory alignment. Asia-Pacific has emerged as the most accelerated growth cluster, with India projected at a CAGR of 6.7% and China closely following at 6.31%.

Expansion in these countries is being driven by rising disposable incomes, rapid urbanization, and growing adoption of functional beverages among younger consumers. In China, domestic beauty innovation ecosystems and KOL-led product endorsements have created a favorable environment for ingestible skincare. In India, the integration of Ayurvedic botanicals with modern formats has enabled a unique product proposition aligned with preventive wellness.

Europe remains a critical market for premium-positioned beauty drinks, supported by France(5.9%), Germany (5.5%), and theUK (5.7%), where skin health is increasingly being managed through clinically supported formulations. Regulatory emphasis on clean-label claims and ingredient traceability is expected to reinforce brand credibility.

In North America, where the USA is projected at a CAGR of 6.1%, growth is being led by D2C wellness platforms and tech-enabled personalization tools. Meanwhile, Brazil (5.2%) is witnessing growing traction in collagen- and antioxidant-based formats through pharmacy and beauty retail, driven by rising beauty-consciousness in urban centers.

Sales Outlook for Beauty-from-Within Drinks in the United States

Year USA Berberine Market (USD Million)
2025 776.5
2026 829.3
2027 883.3
2028 942.2
2029 993.7
2030 1,051.1
2031 1,110.4
2032 1,174.8
2033 1,247.6
2034 1,327.9
2035 1,411.1

The Beauty-from-Within Drinks Market in the United States is projected to grow at a CAGR of 6.1% from 2025 to 2035, reaching USD 1,411.1 million by 2035, up from USD 776.5 million in 2025. Growth is being fueled by increased consumer investment in holistic health regimens, with skin, hair, and gut-focused beverages gaining wider acceptance across demographics.

Premium-positioned RTD collagen beverages have been increasingly stocked by wellness-focused retailers and pharmacies, while powdered beauty blends are being incorporated into personalized subscription models. Scientific backing for ingredient efficacy particularly for hyaluronic acid, ceramides, and probiotics is expected to drive repeat purchase rates and increase product loyalty.

  • Skin hydration and anti-aging are the most cited claims in USA marketing, reinforcing demand across age groups.
  • Retailers are expanding clean-label and traceable ingredient product lines in response to consumer scrutiny.
  • D2C and influencer-driven channels are being prioritized for new launches, enhancing speed-to-market and consumer education.

As consumer sophistication deepens and product differentiation becomes more clinically grounded, the USA market is expected to anchor regional leadership in North America.

Growth and Expansion Outlook for Beauty-from-Within Drinks in the United Kingdom

The UK Beauty-from-Within Drinks Market is expected to experience sustained momentum, supported by a growing alignment between beauty routines and wellness behaviors. A strong demand for clean-label, non-GMO, and plant-based functional beverages has been observed, particularly in urban centers. With the CAGR projected at 5.7%, innovation is being driven by botanical extracts and antioxidant-rich formulations targeted at stress-related skin concerns.

  • Subscription wellness boxes have emerged as a primary channel for introducing ingestible beauty formats.
  • Regulatory compliance with EU/UK food supplement laws is prompting brands to invest in EFSA-aligned claims.
  • A growing number of men are adopting ingestible skincare regimens, diversifying target demographics.
  • Beauty retailers are integrating skin tests and AI tools to guide supplement pairing in stores.

Growth and Expansion Outlook for Beauty-from-Within Drinks in India

India’s Beauty-from-Within Drinks Market is forecasted to expand at a 6.7% CAGR, driven by increasing disposable income, beauty-conscious youth populations, and the fusion of Ayurveda traditions with modern delivery formats. Regional brands are leveraging herbal actives like ashwagandha and turmeric to offer preventive and rejuvenating benefits in affordable formats.

  • Ayurveda-inspired beauty drinks have gained momentum in tier-1 and tier-2 cities.
  • Functional beverages are being distributed through pharmacies and wellness clinics alongside OTC supplements.
  • Rising female workforce participation is fueling demand for anti-fatigue and glow-enhancing blends.
  • D2C Ayurvedic beauty startups are receiving strong investor interest, promoting ingredient transparency and personalization.

Sales Outlook for Beauty-from-Within Drinksin China

China is anticipated to grow at a 6.3% CAGR, driven by widespread consumer acceptance of functional beauty beverages and highly developed influencer-led ecosystems. Collagen and hyaluronic acid drinks have become embedded in daily skincare routines among urban millennials and Gen Z women, with domestic players innovating in convenience, packaging, and co-branding.

  • Beauty-from-within drinks are being cross-promoted with topical skincare under unified brand ecosystems.
  • Collagen-enriched teas and marine extract-based drinks have gained popularity in TCM-inspired wellness lines.
  • Tmall and Xiaohongshu are driving category education through short-form content and expert endorsements.
  • Clinical efficacy, not celebrity appeal, is becoming the central purchasing trigger among premium users.

In-depth Analysis of Beauty-from-Within Drinksin Europe

Country 2025
UK 19.40%
Germany 21.93%
Italy 10.68%
France 13.10%
Spain 9.85%
BENELUX 6.23%
Nordic 5.60%
Rest of Europe 13%
Country 2035
UK 18.38%
Germany 21.57%
Italy 11.59%
France 13.55%
Spain 11.45%
BENELUX 5.02%
Nordic 5.46%
Rest of Europe 13%

Germany’s Beauty-from-Within Drinks Market is projected to expand at a 5.5% CAGR, led by demand for scientifically validated, additive-free products that meet stringent consumer safety and transparency standards. German consumers prioritize formulation integrity and often prefer products backed by dermatological associations and clinical data.

  • In-pharmacy beauty drinks have gained consumer trust, especially among aging populations.
  • Nutricosmetic brands are collaborating with dermatologists to validate skin-benefit claims for retail use.
  • Gut-skin health claims are growing rapidly, especially via probiotic and prebiotic drinks.
  • Demand for vegan collagen alternatives is expanding, supported by Germany’s strong plant-based movement.

Growth Outlook for Beauty-from-Within Drinks in Japan

Product Type Segment Market Value Share, 2025
Collagen Peptides 32.0%
Hyaluronic Acid 9.0%
Vitamins & Minerals (Biotin, Vitamin C, Zinc) 12.0%
Antioxidants (Polyphenols, Astaxanthin) 10.0%
Adaptogens (Ashwagandha, Rhodiola) 6.0%
Botanical Extracts (Goji Berry, Aloe Vera) 8.0%
Probiotics & Prebiotics 7.0%
Marine Extracts (Algae, Seaweed) 6.0%
Ceramides 10.0%

The Beauty-from-Within Drinks Market in Japan is projected to reach USD 42.7 million in 2025, withcollagen peptides contributing 32.0% of the total market value. A clear preference for clinically supported actives especially those associated with anti-aging and skin firmness-has been observed across key consumer segments. Ceramides and hyaluronic acid, each holding 10.0%, reflect Japan’s strong emphasis on skin barrier support and moisture retention, particularly among aging and sensitive-skin populations.

This composition signals Japan’s evolution into a science-forward ingestible beauty market, where consumer trust is grounded in efficacy, traceability, and dermatological endorsement. Ceramides have been favored in combination formats with probiotics and vitamins to enhance bioavailability and functional synergy. Hyaluronic acid’s presence is being reinforced by growing consumer education around deep hydration and cellular rejuvenation.

  • Japan is projected to hold a significant share of the global beauty-from-within drinks market by 2025.
  • Collagen peptides lead the market at 32.0%, followed by ceramides and hyaluronic acid at 10.0% each.
  • Growth is supported by high dermatological literacy and demand for clinically proven hydration solutions
  • Functional drink innovation is being driven by Japan’s aging population and strong wellness retail culture

Opportunity Analysis of South Korea Beauty-from-Within Drinks

Product Format Segment Market Value Share, 2025
Ready to Drink (RTD) Bottles 36.0%
Powdered Drink Mixes 24.0%
Shots (Concentrated) 14.0%
Carbonated Beauty Drinks 16.0%
Tea & Infused Water 10.0%

The Beauty-from-Within Drinks Market in South Korea is projected to reach USD 31.1 million in 2025, with ready-to-drink (RTD) bottles accounting for 36% of total market value, followed by carbonated beauty drinks at 16%. These segments are expected to maintain dominance due to cultural preferences for convenience, taste variety, and aesthetic packaging.

The RTD format has been widely adopted across South Korea’s urban centers, driven by demand for seamless integration into K-beauty routines. Functional beverages are being positioned as daily wellness enhancers, often co-branded with cosmetics or endorsed by K-pop influencers. RTD collagen drinks, in particular, are being embedded into skin-brightening and hydration regimes.

Carbonated beauty drinks have captured rising attention among younger consumers seeking novel textures and flavor-forward formulations. These formats are often infused with vitamins, hyaluronic acid, and antioxidants-designed to deliver both sensorial pleasure and functional benefit.

  • RTD bottles lead the format landscape with 36% share, supported by strong cosmetic-beverage synergies
  • Carbonated beauty drinks contribute 16%, propelled by flavor innovation and influencer-led launches
  • Convenience, taste, and daily beauty integration define South Korean consumer preferences

Competitive Landscape of Beauty-from-Within Drinks

Companies Global Value Share 2025
Vital Proteins 10%
Others 90%

The Beauty-from-Within Drinks Market is moderately fragmented, with established global wellness brands, premium lifestyle players, and niche nutraceutical innovators competing across diverse functional positioning. Global leaders such as Vital Proteins, NeoCell, andGarden of Lifeare holding significant market share, driven by strong collagen-based portfolios, nationwide retail partnerships, and clinically supported formulations. Strategic focus has been placed on clean-label certifications, cross-category expansion, and integration into personalized wellness platforms.

Mid-sized innovators including HUM Nutrition, Olly Nutrition, andSkinade are gaining consumer traction through targeted formulations for skin hydration, anti-aging, and mood-beauty connections. Growth is being enabled by digital-first distribution, influencer-led storytelling, and subscription-based personalization, particularly among Gen Z and millennial users.

Premium lifestyle and holistic wellness brands such as The Beauty Chef, Sakara, and Reserveage Nutritionare differentiating through gut-skin health positioning, fermented ingredients, and adaptogen-infused formats. Emphasis has been placed on organic sourcing, sustainability narratives, and editorial-driven brand ecosystems.

Competitive advantage is expected to shift from ingredient claims alone to ecosystemintegration where efficacy, traceability, and consumer education converge. Future leadership will likely be defined by clinical data transparency, format innovation, andcustomized delivery systems embedded into holistic beauty routines.

Key Developments in Beauty-from-Within Drinks

  • April 2025 - DSM‑Firmenich introduces SYN®‑COLL CB peptide technology. A next‑generation peptide ingredient, SYN®‑COLL CB, was unveiled by DSM‑Firmenich at in‑cosmetics Global in April 2025. This eco‑conscious collagen alternative is expected to enable higher skin efficacy with sustainable sourcing, positioning future beauty drinks for premium, science‑based differentiation.
  • In January 2025, Perfect Corp’s Skincare Pro AI skin‑analysis platform was integrated into Amazon’s first parapharmacy in Milan. Personalized ingestible beauty suggestions were enabled in‑store via tablets, accelerating tech-embedded retail experiences and data-driven pairing of formulations.

Scope of the Report

Item Value
Quantitative Units USD 3,235.6 Million
Active Ingredient Type Collagen Peptides, Hyaluronic Acid, Vitamins & Minerals (Biotin, Vitamin C, Zinc), Antioxidants (Polyphenols, Astaxanthin), Adaptogens (Ashwagandha, Rhodiola), Botanical Extracts (Goji Berry, Aloe Vera), Probiotics & Prebiotics, Marine Extracts (Algae, Seaweed), Ceramides
Product Format Ready-to-Drink (RTD) Bottles, Powdered Drink Mixes, Concentrated Shots, Carbonated Beauty Drinks, Tea & Infused Water
Benefit Claims Skin Hydration, Anti-Aging & Wrinkle Reduction, Skin Brightening, Hair & Nail Strengthening, Detox & Radiance Boost, Gut-Skin Health Connection
Target Consumer Women, Men, and Unisex
Sales Channel Supermarkets & Hypermarkets, Specialty Health Stores, Online Retail, Direct-to-Consumer (D2C), and Salons & Spas
Packaging Type Bottles (Glass, PET), Sachets/Stick Packs, Multi-Pack Bundles
Regions Covered North America, Europe, Asia-Pacific, Latin America, Middle East & Africa
Country Covered United States, Canada, Germany, France, United Kingdom, China, Japan, India, Brazil, South Africa
Key Companies Profiled Vital Proteins, HUM Nutrition, Collagen ny Watsons,Olly Nutrition, NeoCell, The Beauty Chef, Skinade, Garden of Life, Reserveage Nutrition, Sakara
Additional Attributes Market share by ingredient type and format, clean-label and organic adoption trends, rise in personalized nutrition, integration of AI diagnostics and D2C models, collagen formulation advancements, probiotic beauty innovation, regulatory influence on claim substantiation, and growth via influencer commerce and tech-driven retail.

Key Segments

By Product Type:

  • Raw Bovine Brain Extract (Concentrates, Powders)
  • Encapsulated Supplements (Capsules, Tablets)
  • Injectable Formulations (for Medical Use)
  • Functional Ingredients (Peptides, Phospholipids)
  • Cosmetic Ingredients (Anti-aging, Skin Repair)

By Application:

  • Cognitive & Memory Support Supplements
  • Neurological Health & Nerve Regeneration
  • Medical Nutrition (Neurodegenerative Disease Support)
  • Cosmetic & Dermatological Applications
  • Research & Pharmaceutical Use

By Purity Grade:

  • Pharmaceutical Grade
  • Food Grade
  • Cosmetic Grade

By Source:

  • Organic Bovine Brain Extract
  • Conventional Bovine Brain Extract

By End User:

  • Medical Professionals & Clinics
  • Nutraceutical Companies
  • Cosmetic Companies
  • Researchers & Academics

By Sales Channel:

  • Pharmacies & Drugstores
  • Nutraceutical & Supplement Manufacturers (B2B)
  • Research Institutions & Laboratories
  • Cosmetic Ingredient Suppliers
  • Online Retail

By Region:

  • North America
  • Latin America
  • Europe
  • East Asia
  • South Asia & Pacific
  • MEA

Table of Content

  1. Executive Summary
    • Global Market Outlook
    • Demand-side Trends
    • Supply-side Trends
    • Technology Roadmap Analysis
    • Analysis and Recommendations
  2. Market Overview
    • Market Coverage / Taxonomy
    • Market Definition / Scope / Limitations
  3. Market Background
    • Market Dynamics
      • Drivers
      • Restraints
      • Opportunity
      • Trends
    • Scenario Forecast
      • Demand in Optimistic Scenario
      • Demand in Likely Scenario
      • Demand in Conservative Scenario
    • Opportunity Map Analysis
    • Product Life Cycle Analysis
    • Supply Chain Analysis
      • Supply Side Participants and their Roles
        • Producers
        • Mid-Level Participants (Traders/ Agents/ Brokers)
        • Wholesalers and Distributors
      • Value Added and Value Created at Node in the Supply Chain
      • List of Raw Material Suppliers
      • List of Existing and Potential Buyer’s
    • Investment Feasibility Matrix
    • Value Chain Analysis
      • Profit Margin Analysis
      • Wholesalers and Distributors
      • Retailers
    • PESTLE and Porter’s Analysis
    • Regulatory Landscape
      • By Key Regions
      • By Key Countries
    • Regional Parent Market Outlook
    • Production and Consumption Statistics
    • Import and Export Statistics
  4. Global Bovine Brain Extract Market Analysis 2020 to 2024 and Forecast, 2025 to 2035
    • Historical Market Size Value (USD Million) & Volume (MT) Analysis, 2020 to 2024
    • Current and Future Market Size Value (USD Million) & Volume (MT) Projections, 2025 to 2035
      • Y-o-Y Growth Trend Analysis
      • Absolute $ Opportunity Analysis
  5. Global Bovine Brain Extract Market Analysis 2020 to 2024 and Forecast 2025 to 2035, By Product Type
    • Introduction / Key Findings
    • Historical Market Size Value (USD Million) & Volume (MT) Analysis By Product Type, 2020 to 2024
    • Current and Future Market Size Value (USD Million) & Volume (MT) Analysis and Forecast By Product Type, 2025 to 2035
      • Raw Bovine Brain Extract (Concentrates, Powders)
      • Encapsulated Supplements (Capsules, Tablets)
      • Injectable Formulations (for Medical Use)
      • Functional Ingredients (Peptides, Phospholipids)
      • Cosmetic Ingredients (Anti-aging, Skin Repair)
    • Y-o-Y Growth Trend Analysis By Product Type, 2020 to 2024
    • Absolute $ Opportunity Analysis By Product Type, 2025 to 2035
  6. Global Bovine Brain Extract Market Analysis 2020 to 2024 and Forecast 2025 to 2035, By Application
    • Introduction / Key Findings
    • Historical Market Size Value (USD Million) & Volume (MT) Analysis By Application, 2020 to 2024
    • Current and Future Market Size Value (USD Million) & Volume (MT) Analysis and Forecast By Application, 2025 to 2035
      • Cognitive & Memory Support Supplements
      • Neurological Health & Nerve Regeneration
      • Medical Nutrition (Neurodegenerative Disease Support)
      • Cosmetic & Dermatological Applications
      • Research & Pharmaceutical Use
    • Y-o-Y Growth Trend Analysis By Application, 2020 to 2024
    • Absolute $ Opportunity Analysis By Application, 2025 to 2035
  7. Global Bovine Brain Extract Market Analysis 2020 to 2024 and Forecast 2025 to 2035, By Purity Grade
    • Introduction / Key Findings
    • Historical Market Size Value (USD Million) & Volume (MT) Analysis By Purity Grade, 2020 to 2024
    • Current and Future Market Size Value (USD Million) & Volume (MT) Analysis and Forecast By Purity Grade, 2025 to 2035
      • Pharmaceutical Grade
      • Food Grade
      • Cosmetic Grade
    • Y-o-Y Growth Trend Analysis By Purity Grade, 2020 to 2024
    • Absolute $ Opportunity Analysis By Purity Grade, 2025 to 2035
  8. Global Bovine Brain Extract Market Analysis 2020 to 2024 and Forecast 2025 to 2035, By Source
    • Introduction / Key Findings
    • Historical Market Size Value (USD Million) & Volume (MT) Analysis By Source, 2020 to 2024
    • Current and Future Market Size Value (USD Million) & Volume (MT) Analysis and Forecast By Source, 2025 to 2035
      • Organic Bovine Brain Extract
      • Conventional Bovine Brain Extract
    • Y-o-Y Growth Trend Analysis By Source, 2020 to 2024
    • Absolute $ Opportunity Analysis By Source, 2025 to 2035
  9. Global Bovine Brain Extract Market Analysis 2020 to 2024 and Forecast 2025 to 2035, By End User
    • Introduction / Key Findings
    • Historical Market Size Value (USD Million) & Volume (MT) Analysis By End User, 2020 to 2024
    • Current and Future Market Size Value (USD Million) & Volume (MT) Analysis and Forecast By End User, 2025 to 2035
      • Medical Professionals & Clinics
      • Nutraceutical Companies
      • Cosmetic Companies
      • Researchers & Academics
    • Y-o-Y Growth Trend Analysis By End User, 2020 to 2024
    • Absolute $ Opportunity Analysis By End User, 2025 to 2035
  10. Global Bovine Brain Extract Market Analysis 2020 to 2024 and Forecast 2025 to 2035, By Sales Channel
    • Introduction / Key Findings
    • Historical Market Size Value (USD Million) & Volume (MT) Analysis By Sales Channel, 2020 to 2024
    • Current and Future Market Size Value (USD Million) & Volume (MT) Analysis and Forecast By Sales Channel, 2025 to 2035
      • Pharmacies & Drugstores
      • Nutraceutical & Supplement Manufacturers (B2B)
      • Research Institutions & Laboratories
      • Cosmetic Ingredient Suppliers
      • Online Retail
    • Y-o-Y Growth Trend Analysis By Sales Channel, 2020 to 2024
    • Absolute $ Opportunity Analysis By Sales Channel, 2025 to 2035
  11. Global Bovine Brain Extract Market Analysis 2020 to 2024 and Forecast 2025 to 2035, By Region
    • Introduction
    • Historical Market Size Value (USD Million) & Volume (MT) Analysis By Region, 2020 to 2024
    • Current Market Size Value (USD Million) & Volume (MT) Analysis and Forecast By Region, 2025 to 2035
      • North America
      • Latin America
      • Europe
      • East Asia
      • South Asia & Pacific
      • MEA
    • Market Attractiveness Analysis By Region
  12. North America Bovine Brain Extract Market Analysis 2020 to 2024 and Forecast 2025 to 2035, By Country
    • Historical Market Size Value (USD Million) & Volume (MT) Trend Analysis By Market Taxonomy, 2020 to 2024
    • Market Size Value (USD Million) & Volume (MT) Forecast By Market Taxonomy, 2025 to 2035
      • By Country
        • USA
        • Canada
      • By Product Type
      • By Application
      • By Purity Grade
      • By Source
      • By End User
      • By Sales Channel
    • Market Attractiveness Analysis
      • By Country
      • By Product Type
      • By Application
      • By Purity Grade
      • By Source
      • By End User
      • By Sales Channel
    • Key Takeaways
  13. Latin America Bovine Brain Extract Market Analysis 2020 to 2024 and Forecast 2025 to 2035, By Country
    • Historical Market Size Value (USD Million) & Volume (MT) Trend Analysis By Market Taxonomy, 2020 to 2024
    • Market Size Value (USD Million) & Volume (MT) Forecast By Market Taxonomy, 2025 to 2035
      • By Country
        • Brazil
        • Mexico
        • Colombia
        • Rest of Latin America
      • By Product Type
      • By Application
      • By Purity Grade
      • By Source
      • By End User
      • By Sales Channel
    • Market Attractiveness Analysis
      • By Country
      • By Product Type
      • By Application
      • By Purity Grade
      • By Source
      • By End User
      • By Sales Channel
    • Key Takeaways
  14. Europe Bovine Brain Extract Market Analysis 2020 to 2024 and Forecast 2025 to 2035, By Country
    • Historical Market Size Value (USD Million) & Volume (MT) Trend Analysis By Market Taxonomy, 2020 to 2024
    • Market Size Value (USD Million) & Volume (MT) Forecast By Market Taxonomy, 2025 to 2035
      • By Country
        • Germany
        • UK
        • France
        • Italy
        • Spain
        • Belgium
        • Netherlands
        • Nordic
        • Switzerland
        • Russia
        • Poland
        • Rest of Europe
      • By Product Type
      • By Application
      • By Purity Grade
      • By Source
      • By End User
      • By Sales Channel
    • Market Attractiveness Analysis
      • By Country
      • By Product Type
      • By Application
      • By Purity Grade
      • By Source
      • By End User
      • By Sales Channel
    • Key Takeaways
  15. East Asia Bovine Brain Extract Market Analysis 2020 to 2024 and Forecast 2025 to 2035, By Country
    • Historical Market Size Value (USD Million) & Volume (MT) Trend Analysis By Market Taxonomy, 2020 to 2024
    • Market Size Value (USD Million) & Volume (MT) Forecast By Market Taxonomy, 2025 to 2035
      • By Country
        • China
        • Japan
        • South Korea
      • By Product Type
      • By Application
      • By Purity Grade
      • By Source
      • By End User
      • By Sales Channel
    • Market Attractiveness Analysis
      • By Country
      • By Product Type
      • By Application
      • By Purity Grade
      • By Source
      • By End User
      • By Sales Channel
    • Key Takeaways
  16. South Asia & Pacific Bovine Brain Extract Market Analysis 2020 to 2024 and Forecast 2025 to 2035, By Country
    • Historical Market Size Value (USD Million) & Volume (MT) Trend Analysis By Market Taxonomy, 2020 to 2024
    • Market Size Value (USD Million) & Volume (MT) Forecast By Market Taxonomy, 2025 to 2035
      • By Country
        • India
        • Thailand
        • Malaysia
        • Indonesia
        • Singapore
        • Vietnam
        • Australia
        • New Zealand
        • Rest of South Asia
      • By Product Type
      • By Application
      • By Purity Grade
      • By Source
      • By End User
      • By Sales Channel
    • Market Attractiveness Analysis
      • By Country
      • By Product Type
      • By Application
      • By Purity Grade
      • By Source
      • By End User
      • By Sales Channel
    • Key Takeaways
  17. MEA Bovine Brain Extract Market Analysis 2020 to 2024 and Forecast 2025 to 2035, By Country
    • Historical Market Size Value (USD Million) & Volume (MT) Trend Analysis By Market Taxonomy, 2020 to 2024
    • Market Size Value (USD Million) & Volume (MT) Forecast By Market Taxonomy, 2025 to 2035
      • By Country
        • Turkey
        • UAE
        • Saudi Arabia
        • Israel
        • Other GCC Countries
        • North Africa
        • South Africa
        • Central Africa
        • Rest of MEA
      • By Product Type
      • By Application
      • By Purity Grade
      • By Source
      • By End User
      • By Sales Channel
    • Market Attractiveness Analysis
      • By Country
      • By Product Type
      • By Application
      • By Purity Grade
      • By Source
      • By End User
      • By Sales Channel
    • Key Takeaways
  18. Key Countries Bovine Brain Extract Market Analysis
    • USA
      • Pricing Analysis
      • Market Share Analysis, 2024
        • By Product Type
        • By Application
        • By Purity Grade
        • By Source
        • By End User
        • By Sales Channel
    • Canada
      • Pricing Analysis
      • Market Share Analysis, 2024
        • By Product Type
        • By Application
        • By Purity Grade
        • By Source
        • By End User
        • By Sales Channel
    • Brazil
      • Pricing Analysis
      • Market Share Analysis, 2024
        • By Product Type
        • By Application
        • By Purity Grade
        • By Source
        • By End User
        • By Sales Channel
    • Mexico
      • Pricing Analysis
      • Market Share Analysis, 2024
        • By Product Type
        • By Application
        • By Purity Grade
        • By Source
        • By End User
        • By Sales Channel
    • Colombia
      • Pricing Analysis
      • Market Share Analysis, 2024
        • By Product Type
        • By Application
        • By Purity Grade
        • By Source
        • By End User
        • By Sales Channel
    • Germany
      • Pricing Analysis
      • Market Share Analysis, 2024
        • By Product Type
        • By Application
        • By Purity Grade
        • By Source
        • By End User
        • By Sales Channel
    • UK
      • Pricing Analysis
      • Market Share Analysis, 2024
        • By Product Type
        • By Application
        • By Purity Grade
        • By Source
        • By End User
        • By Sales Channel
    • France
      • Pricing Analysis
      • Market Share Analysis, 2024
        • By Product Type
        • By Application
        • By Purity Grade
        • By Source
        • By End User
        • By Sales Channel
    • Italy
      • Pricing Analysis
      • Market Share Analysis, 2024
        • By Product Type
        • By Application
        • By Purity Grade
        • By Source
        • By End User
        • By Sales Channel
    • Spain
      • Pricing Analysis
      • Market Share Analysis, 2024
        • By Product Type
        • By Application
        • By Purity Grade
        • By Source
        • By End User
        • By Sales Channel
    • Belgium
      • Pricing Analysis
      • Market Share Analysis, 2024
        • By Product Type
        • By Application
        • By Purity Grade
        • By Source
        • By End User
        • By Sales Channel
    • Netherlands
      • Pricing Analysis
      • Market Share Analysis, 2024
        • By Product Type
        • By Application
        • By Purity Grade
        • By Source
        • By End User
        • By Sales Channel
    • Nordic
      • Pricing Analysis
      • Market Share Analysis, 2024
        • By Product Type
        • By Application
        • By Purity Grade
        • By Source
        • By End User
        • By Sales Channel
    • Switzerland
      • Pricing Analysis
      • Market Share Analysis, 2024
        • By Product Type
        • By Application
        • By Purity Grade
        • By Source
        • By End User
        • By Sales Channel
    • Russia
      • Pricing Analysis
      • Market Share Analysis, 2024
        • By Product Type
        • By Application
        • By Purity Grade
        • By Source
        • By End User
        • By Sales Channel
    • Poland
      • Pricing Analysis
      • Market Share Analysis, 2024
        • By Product Type
        • By Application
        • By Purity Grade
        • By Source
        • By End User
        • By Sales Channel
    • China
      • Pricing Analysis
      • Market Share Analysis, 2024
        • By Product Type
        • By Application
        • By Purity Grade
        • By Source
        • By End User
        • By Sales Channel
    • Japan
      • Pricing Analysis
      • Market Share Analysis, 2024
        • By Product Type
        • By Application
        • By Purity Grade
        • By Source
        • By End User
        • By Sales Channel
    • South Korea
      • Pricing Analysis
      • Market Share Analysis, 2024
        • By Product Type
        • By Application
        • By Purity Grade
        • By Source
        • By End User
        • By Sales Channel
    • India
      • Pricing Analysis
      • Market Share Analysis, 2024
        • By Product Type
        • By Application
        • By Purity Grade
        • By Source
        • By End User
        • By Sales Channel
    • Thailand
      • Pricing Analysis
      • Market Share Analysis, 2024
        • By Product Type
        • By Application
        • By Purity Grade
        • By Source
        • By End User
        • By Sales Channel
    • Indonesia
      • Pricing Analysis
      • Market Share Analysis, 2024
        • By Product Type
        • By Application
        • By Purity Grade
        • By Source
        • By End User
        • By Sales Channel
    • Australia
      • Pricing Analysis
      • Market Share Analysis, 2024
        • By Product Type
        • By Application
        • By Purity Grade
        • By Source
        • By End User
        • By Sales Channel
    • New Zealand
      • Pricing Analysis
      • Market Share Analysis, 2024
        • By Product Type
        • By Application
        • By Purity Grade
        • By Source
        • By End User
        • By Sales Channel
    • Turkey
      • Pricing Analysis
      • Market Share Analysis, 2024
        • By Product Type
        • By Application
        • By Purity Grade
        • By Source
        • By End User
        • By Sales Channel
    • UAE
      • Pricing Analysis
      • Market Share Analysis, 2024
        • By Product Type
        • By Application
        • By Purity Grade
        • By Source
        • By End User
        • By Sales Channel
    • Saudi Arabia
      • Pricing Analysis
      • Market Share Analysis, 2024
        • By Product Type
        • By Application
        • By Purity Grade
        • By Source
        • By End User
        • By Sales Channel
    • Israel
      • Pricing Analysis
      • Market Share Analysis, 2024
        • By Product Type
        • By Application
        • By Purity Grade
        • By Source
        • By End User
        • By Sales Channel
    • North Africa
      • Pricing Analysis
      • Market Share Analysis, 2024
        • By Product Type
        • By Application
        • By Purity Grade
        • By Source
        • By End User
        • By Sales Channel
    • South Africa
      • Pricing Analysis
      • Market Share Analysis, 2024
        • By Product Type
        • By Application
        • By Purity Grade
        • By Source
        • By End User
        • By Sales Channel
  19. Market Structure Analysis
    • Competition Dashboard
    • Competition Benchmarking
    • Market Share Analysis of Top Players
      • By Regional
      • By Product Type
      • By Application
      • By Purity Grade
      • By Source
      • By End User
      • By Sales Channel
  20. Competition Analysis
    • Competition Deep Dive
      • Lonza Group
        • Overview
        • Product Portfolio
        • Profitability by Market Segments (Product/Age /Sales Channel/Region)
        • Sales Footprint
        • Strategy Overview
          • Marketing Strategy
          • Product Strategy
          • Channel Strategy
      • Cell Applications, Inc.
        • Overview
        • Product Portfolio
        • Profitability by Market Segments (Product/Age /Sales Channel/Region)
        • Sales Footprint
        • Strategy Overview
          • Marketing Strategy
          • Product Strategy
          • Channel Strategy
      • MP Biomedicals
        • Overview
        • Product Portfolio
        • Profitability by Market Segments (Product/Age /Sales Channel/Region)
        • Sales Footprint
        • Strategy Overview
          • Marketing Strategy
          • Product Strategy
          • Channel Strategy
      • Viscoll (Livecell™)
        • Overview
        • Product Portfolio
        • Profitability by Market Segments (Product/Age /Sales Channel/Region)
        • Sales Footprint
        • Strategy Overview
          • Marketing Strategy
          • Product Strategy
          • Channel Strategy
      • Sigma Aldrich (Merck KgaA)
        • Overview
        • Product Portfolio
        • Profitability by Market Segments (Product/Age /Sales Channel/Region)
        • Sales Footprint
        • Strategy Overview
          • Marketing Strategy
          • Product Strategy
          • Channel Strategy
      • ATCC
        • Overview
        • Product Portfolio
        • Profitability by Market Segments (Product/Age /Sales Channel/Region)
        • Sales Footprint
        • Strategy Overview
          • Marketing Strategy
          • Product Strategy
          • Channel Strategy
      • Thomas Scientific
        • Overview
        • Product Portfolio
        • Profitability by Market Segments (Product/Age /Sales Channel/Region)
        • Sales Footprint
        • Strategy Overview
          • Marketing Strategy
          • Product Strategy
          • Channel Strategy
      • HangzhouPantaTradingCo.,Ltd
        • Overview
        • Product Portfolio
        • Profitability by Market Segments (Product/Age /Sales Channel/Region)
        • Sales Footprint
        • Strategy Overview
          • Marketing Strategy
          • Product Strategy
          • Channel Strategy
      • Beijing Hongrun Baoshun Technology, Co. Ltd.
        • Overview
        • Product Portfolio
        • Profitability by Market Segments (Product/Age /Sales Channel/Region)
        • Sales Footprint
        • Strategy Overview
          • Marketing Strategy
          • Product Strategy
          • Channel Strategy
      • MorNatural Health Solutions
        • Overview
        • Product Portfolio
        • Profitability by Market Segments (Product/Age /Sales Channel/Region)
        • Sales Footprint
        • Strategy Overview
          • Marketing Strategy
          • Product Strategy
          • Channel Strategy
      • Others
        • Overview
        • Product Portfolio
        • Profitability by Market Segments (Product/Age /Sales Channel/Region)
        • Sales Footprint
        • Strategy Overview
          • Marketing Strategy
          • Product Strategy
          • Channel Strategy
  21. Assumptions & Acronyms Used
  22. Research Methodology

List of Tables

  • Table 1: Global Market Value (USD Million) Forecast by Region, 2020-2035
  • Table 2: Global Market Volume (MT) Forecast by Region, 2020-2035
  • Table 3: Global Market Value (USD Million) Forecast by Active Ingredient Type, 2020-2035
  • Table 4: Global Market Volume (MT) Forecast by Active Ingredient Type, 2020-2035
  • Table 5: Global Market Value (USD Million) Forecast by Product Format, 2020-2035
  • Table 6: Global Market Volume (MT) Forecast by Product Format, 2020-2035
  • Table 7: Global Market Value (USD Million) Forecast by Target Consumer, 2020-2035
  • Table 8: Global Market Volume (MT) Forecast by Target Consumer, 2020-2035
  • Table 9: Global Market Value (USD Million) Forecast by Benefit Claims, 2020-2035
  • Table 10: Global Market Volume (MT) Forecast by Benefit Claims, 2020-2035
  • Table 11: Global Market Value (USD Million) Forecast by Packaging Type, 2020-2035
  • Table 12: Global Market Volume (MT) Forecast by Packaging Type, 2020-2035
  • Table 13: Global Market Value (USD Million) Forecast by Sales Channel, 2020-2035
  • Table 14: Global Market Volume (MT) Forecast by Sales Channel, 2020-2035
  • Table 15: North America Market Value (USD Million) Forecast by Country, 2020-2035
  • Table 16: North America Market Volume (MT) Forecast by Country, 2020-2035
  • Table 17: North America Market Value (USD Million) Forecast by Active Ingredient Type, 2020-2035
  • Table 18: North America Market Volume (MT) Forecast by Active Ingredient Type, 2020-2035
  • Table 19: North America Market Value (USD Million) Forecast by Product Format, 2020-2035
  • Table 20: North America Market Volume (MT) Forecast by Product Format, 2020-2035
  • Table 21: North America Market Value (USD Million) Forecast by Target Consumer, 2020-2035
  • Table 22: North America Market Volume (MT) Forecast by Target Consumer, 2020-2035
  • Table 23: North America Market Value (USD Million) Forecast by Benefit Claims, 2020-2035
  • Table 24: North America Market Volume (MT) Forecast by Benefit Claims, 2020-2035
  • Table 25: North America Market Value (USD Million) Forecast by Packaging Type, 2020-2035
  • Table 26: North America Market Volume (MT) Forecast by Packaging Type, 2020-2035
  • Table 27: North America Market Value (USD Million) Forecast by Sales Channel, 2020-2035
  • Table 28: North America Market Volume (MT) Forecast by Sales Channel, 2020-2035
  • Table 29: Latin America Market Value (USD Million) Forecast by Country, 2020-2035
  • Table 30: Latin America Market Volume (MT) Forecast by Country, 2020-2035
  • Table 31: Latin America Market Value (USD Million) Forecast by Active Ingredient Type, 2020-2035
  • Table 32: Latin America Market Volume (MT) Forecast by Active Ingredient Type, 2020-2035
  • Table 33: Latin America Market Value (USD Million) Forecast by Product Format, 2020-2035
  • Table 34: Latin America Market Volume (MT) Forecast by Product Format, 2020-2035
  • Table 35: Latin America Market Value (USD Million) Forecast by Target Consumer, 2020-2035
  • Table 36: Latin America Market Volume (MT) Forecast by Target Consumer, 2020-2035
  • Table 37: Latin America Market Value (USD Million) Forecast by Benefit Claims, 2020-2035
  • Table 38: Latin America Market Volume (MT) Forecast by Benefit Claims, 2020-2035
  • Table 39: Latin America Market Value (USD Million) Forecast by Packaging Type, 2020-2035
  • Table 40: Latin America Market Volume (MT) Forecast by Packaging Type, 2020-2035
  • Table 41: Latin America Market Value (USD Million) Forecast by Sales Channel, 2020-2035
  • Table 42: Latin America Market Volume (MT) Forecast by Sales Channel, 2020-2035
  • Table 43: Europe Market Value (USD Million) Forecast by Country, 2020-2035
  • Table 44: Europe Market Volume (MT) Forecast by Country, 2020-2035
  • Table 45: Europe Market Value (USD Million) Forecast by Active Ingredient Type, 2020-2035
  • Table 46: Europe Market Volume (MT) Forecast by Active Ingredient Type, 2020-2035
  • Table 47: Europe Market Value (USD Million) Forecast by Product Format, 2020-2035
  • Table 48: Europe Market Volume (MT) Forecast by Product Format, 2020-2035
  • Table 49: Europe Market Value (USD Million) Forecast by Target Consumer, 2020-2035
  • Table 50: Europe Market Volume (MT) Forecast by Target Consumer, 2020-2035
  • Table 51: Europe Market Value (USD Million) Forecast by Benefit Claims, 2020-2035
  • Table 52: Europe Market Volume (MT) Forecast by Benefit Claims, 2020-2035
  • Table 53: Europe Market Value (USD Million) Forecast by Packaging Type, 2020-2035
  • Table 54: Europe Market Volume (MT) Forecast by Packaging Type, 2020-2035
  • Table 55: Europe Market Value (USD Million) Forecast by Sales Channel, 2020-2035
  • Table 56: Europe Market Volume (MT) Forecast by Sales Channel, 2020-2035
  • Table 57: East Asia Market Value (USD Million) Forecast by Country, 2020-2035
  • Table 58: East Asia Market Volume (MT) Forecast by Country, 2020-2035
  • Table 59: East Asia Market Value (USD Million) Forecast by Active Ingredient Type, 2020-2035
  • Table 60: East Asia Market Volume (MT) Forecast by Active Ingredient Type, 2020-2035
  • Table 61: East Asia Market Value (USD Million) Forecast by Product Format, 2020-2035
  • Table 62: East Asia Market Volume (MT) Forecast by Product Format, 2020-2035
  • Table 63: East Asia Market Value (USD Million) Forecast by Target Consumer, 2020-2035
  • Table 64: East Asia Market Volume (MT) Forecast by Target Consumer, 2020-2035
  • Table 65: East Asia Market Value (USD Million) Forecast by Benefit Claims, 2020-2035
  • Table 66: East Asia Market Volume (MT) Forecast by Benefit Claims, 2020-2035
  • Table 67: East Asia Market Value (USD Million) Forecast by Packaging Type, 2020-2035
  • Table 68: East Asia Market Volume (MT) Forecast by Packaging Type, 2020-2035
  • Table 69: East Asia Market Value (USD Million) Forecast by Sales Channel, 2020-2035
  • Table 70: East Asia Market Volume (MT) Forecast by Sales Channel, 2020-2035
  • Table 71: South Asia & Pacific Market Value (USD Million) Forecast by Country, 2020-2035
  • Table 72: South Asia & Pacific Market Volume (MT) Forecast by Country, 2020-2035
  • Table 73: South Asia & Pacific Market Value (USD Million) Forecast by Active Ingredient Type, 2020-2035
  • Table 74: South Asia & Pacific Market Volume (MT) Forecast by Active Ingredient Type, 2020-2035
  • Table 75: South Asia & Pacific Market Value (USD Million) Forecast by Product Format, 2020-2035
  • Table 76: South Asia & Pacific Market Volume (MT) Forecast by Product Format, 2020-2035
  • Table 77: South Asia & Pacific Market Value (USD Million) Forecast by Target Consumer, 2020-2035
  • Table 78: South Asia & Pacific Market Volume (MT) Forecast by Target Consumer, 2020-2035
  • Table 79: South Asia & Pacific Market Value (USD Million) Forecast by Benefit Claims, 2020-2035
  • Table 80: South Asia & Pacific Market Volume (MT) Forecast by Benefit Claims, 2020-2035
  • Table 81: South Asia & Pacific Market Value (USD Million) Forecast by Packaging Type, 2020-2035
  • Table 82: South Asia & Pacific Market Volume (MT) Forecast by Packaging Type, 2020-2035
  • Table 83: South Asia & Pacific Market Value (USD Million) Forecast by Sales Channel, 2020-2035
  • Table 84: South Asia & Pacific Market Volume (MT) Forecast by Sales Channel, 2020-2035
  • Table 85: MEA Market Value (USD Million) Forecast by Country, 2020-2035
  • Table 86: MEA Market Volume (MT) Forecast by Country, 2020-2035
  • Table 87: MEA Market Value (USD Million) Forecast by Active Ingredient Type, 2020-2035
  • Table 88: MEA Market Volume (MT) Forecast by Active Ingredient Type, 2020-2035
  • Table 89: MEA Market Value (USD Million) Forecast by Product Format, 2020-2035
  • Table 90: MEA Market Volume (MT) Forecast by Product Format, 2020-2035
  • Table 91: MEA Market Value (USD Million) Forecast by Target Consumer, 2020-2035
  • Table 92: MEA Market Volume (MT) Forecast by Target Consumer, 2020-2035
  • Table 93: MEA Market Value (USD Million) Forecast by Benefit Claims, 2020-2035
  • Table 94: MEA Market Volume (MT) Forecast by Benefit Claims, 2020-2035
  • Table 95: MEA Market Value (USD Million) Forecast by Packaging Type, 2020-2035
  • Table 96: MEA Market Volume (MT) Forecast by Packaging Type, 2020-2035
  • Table 97: MEA Market Value (USD Million) Forecast by Sales Channel, 2020-2035
  • Table 98: MEA Market Volume (MT) Forecast by Sales Channel, 2020-2035

List of Figures

  • Figure 1: Global Market Value (USD Million) by Active Ingredient Type, 2025-2035
  • Figure 2: Global Market Value (USD Million) by Product Format, 2025-2035
  • Figure 3: Global Market Value (USD Million) by Target Consumer, 2025-2035
  • Figure 4: Global Market Value (USD Million) by Benefit Claims, 2025-2035
  • Figure 5: Global Market Value (USD Million) by Packaging Type, 2025-2035
  • Figure 6: Global Market Value (USD Million) by Sales Channel, 2025-2035
  • Figure 7: Global Market Value (USD Million) by Region, 2025-2035
  • Figure 8: Global Market Value (USD Million) Analysis by Region, 2020-2035
  • Figure 9: Global Market Volume (MT) Analysis by Region, 2020-2035
  • Figure 10: Global Market Value Share (%) and BPS Analysis by Region, 2025-2035
  • Figure 11: Global Market Y-o-Y Growth (%) Projections by Region, 2025-2035
  • Figure 12: Global Market Value (USD Million) Analysis by Active Ingredient Type, 2020-2035
  • Figure 13: Global Market Volume (MT) Analysis by Active Ingredient Type, 2020-2035
  • Figure 14: Global Market Value Share (%) and BPS Analysis by Active Ingredient Type, 2025-2035
  • Figure 15: Global Market Y-o-Y Growth (%) Projections by Active Ingredient Type, 2025-2035
  • Figure 16: Global Market Value (USD Million) Analysis by Product Format, 2020-2035
  • Figure 17: Global Market Volume (MT) Analysis by Product Format, 2020-2035
  • Figure 18: Global Market Value Share (%) and BPS Analysis by Product Format, 2025-2035
  • Figure 19: Global Market Y-o-Y Growth (%) Projections by Product Format, 2025-2035
  • Figure 20: Global Market Value (USD Million) Analysis by Target Consumer, 2020-2035
  • Figure 21: Global Market Volume (MT) Analysis by Target Consumer, 2020-2035
  • Figure 22: Global Market Value Share (%) and BPS Analysis by Target Consumer, 2025-2035
  • Figure 23: Global Market Y-o-Y Growth (%) Projections by Target Consumer, 2025-2035
  • Figure 24: Global Market Value (USD Million) Analysis by Benefit Claims, 2020-2035
  • Figure 25: Global Market Volume (MT) Analysis by Benefit Claims, 2020-2035
  • Figure 26: Global Market Value Share (%) and BPS Analysis by Benefit Claims, 2025-2035
  • Figure 27: Global Market Y-o-Y Growth (%) Projections by Benefit Claims, 2025-2035
  • Figure 28: Global Market Value (USD Million) Analysis by Packaging Type, 2020-2035
  • Figure 29: Global Market Volume (MT) Analysis by Packaging Type, 2020-2035
  • Figure 30: Global Market Value Share (%) and BPS Analysis by Packaging Type, 2025-2035
  • Figure 31: Global Market Y-o-Y Growth (%) Projections by Packaging Type, 2025-2035
  • Figure 32: Global Market Value (USD Million) Analysis by Sales Channel, 2020-2035
  • Figure 33: Global Market Volume (MT) Analysis by Sales Channel, 2020-2035
  • Figure 34: Global Market Value Share (%) and BPS Analysis by Sales Channel, 2025-2035
  • Figure 35: Global Market Y-o-Y Growth (%) Projections by Sales Channel, 2025-2035
  • Figure 36: Global Market Attractiveness by Active Ingredient Type, 2025-2035
  • Figure 37: Global Market Attractiveness by Product Format, 2025-2035
  • Figure 38: Global Market Attractiveness by Target Consumer, 2025-2035
  • Figure 39: Global Market Attractiveness by Benefit Claims, 2025-2035
  • Figure 40: Global Market Attractiveness by Packaging Type, 2025-2035
  • Figure 41: Global Market Attractiveness by Sales Channel, 2025-2035
  • Figure 42: Global Market Attractiveness by Region, 2025-2035
  • Figure 43: North America Market Value (USD Million) by Active Ingredient Type, 2025-2035
  • Figure 44: North America Market Value (USD Million) by Product Format, 2025-2035
  • Figure 45: North America Market Value (USD Million) by Target Consumer, 2025-2035
  • Figure 46: North America Market Value (USD Million) by Benefit Claims, 2025-2035
  • Figure 47: North America Market Value (USD Million) by Packaging Type, 2025-2035
  • Figure 48: North America Market Value (USD Million) by Sales Channel, 2025-2035
  • Figure 49: North America Market Value (USD Million) by Country, 2025-2035
  • Figure 50: North America Market Value (USD Million) Analysis by Country, 2020-2035
  • Figure 51: North America Market Volume (MT) Analysis by Country, 2020-2035
  • Figure 52: North America Market Value Share (%) and BPS Analysis by Country, 2025-2035
  • Figure 53: North America Market Y-o-Y Growth (%) Projections by Country, 2025-2035
  • Figure 54: North America Market Value (USD Million) Analysis by Active Ingredient Type, 2020-2035
  • Figure 55: North America Market Volume (MT) Analysis by Active Ingredient Type, 2020-2035
  • Figure 56: North America Market Value Share (%) and BPS Analysis by Active Ingredient Type, 2025-2035
  • Figure 57: North America Market Y-o-Y Growth (%) Projections by Active Ingredient Type, 2025-2035
  • Figure 58: North America Market Value (USD Million) Analysis by Product Format, 2020-2035
  • Figure 59: North America Market Volume (MT) Analysis by Product Format, 2020-2035
  • Figure 60: North America Market Value Share (%) and BPS Analysis by Product Format, 2025-2035
  • Figure 61: North America Market Y-o-Y Growth (%) Projections by Product Format, 2025-2035
  • Figure 62: North America Market Value (USD Million) Analysis by Target Consumer, 2020-2035
  • Figure 63: North America Market Volume (MT) Analysis by Target Consumer, 2020-2035
  • Figure 64: North America Market Value Share (%) and BPS Analysis by Target Consumer, 2025-2035
  • Figure 65: North America Market Y-o-Y Growth (%) Projections by Target Consumer, 2025-2035
  • Figure 66: North America Market Value (USD Million) Analysis by Benefit Claims, 2020-2035
  • Figure 67: North America Market Volume (MT) Analysis by Benefit Claims, 2020-2035
  • Figure 68: North America Market Value Share (%) and BPS Analysis by Benefit Claims, 2025-2035
  • Figure 69: North America Market Y-o-Y Growth (%) Projections by Benefit Claims, 2025-2035
  • Figure 70: North America Market Value (USD Million) Analysis by Packaging Type, 2020-2035
  • Figure 71: North America Market Volume (MT) Analysis by Packaging Type, 2020-2035
  • Figure 72: North America Market Value Share (%) and BPS Analysis by Packaging Type, 2025-2035
  • Figure 73: North America Market Y-o-Y Growth (%) Projections by Packaging Type, 2025-2035
  • Figure 74: North America Market Value (USD Million) Analysis by Sales Channel, 2020-2035
  • Figure 75: North America Market Volume (MT) Analysis by Sales Channel, 2020-2035
  • Figure 76: North America Market Value Share (%) and BPS Analysis by Sales Channel, 2025-2035
  • Figure 77: North America Market Y-o-Y Growth (%) Projections by Sales Channel, 2025-2035
  • Figure 78: North America Market Attractiveness by Active Ingredient Type, 2025-2035
  • Figure 79: North America Market Attractiveness by Product Format, 2025-2035
  • Figure 80: North America Market Attractiveness by Target Consumer, 2025-2035
  • Figure 81: North America Market Attractiveness by Benefit Claims, 2025-2035
  • Figure 82: North America Market Attractiveness by Packaging Type, 2025-2035
  • Figure 83: North America Market Attractiveness by Sales Channel, 2025-2035
  • Figure 84: North America Market Attractiveness by Country, 2025-2035
  • Figure 85: Latin America Market Value (USD Million) by Active Ingredient Type, 2025-2035
  • Figure 86: Latin America Market Value (USD Million) by Product Format, 2025-2035
  • Figure 87: Latin America Market Value (USD Million) by Target Consumer, 2025-2035
  • Figure 88: Latin America Market Value (USD Million) by Benefit Claims, 2025-2035
  • Figure 89: Latin America Market Value (USD Million) by Packaging Type, 2025-2035
  • Figure 90: Latin America Market Value (USD Million) by Sales Channel, 2025-2035
  • Figure 91: Latin America Market Value (USD Million) by Country, 2025-2035
  • Figure 92: Latin America Market Value (USD Million) Analysis by Country, 2020-2035
  • Figure 93: Latin America Market Volume (MT) Analysis by Country, 2020-2035
  • Figure 94: Latin America Market Value Share (%) and BPS Analysis by Country, 2025-2035
  • Figure 95: Latin America Market Y-o-Y Growth (%) Projections by Country, 2025-2035
  • Figure 96: Latin America Market Value (USD Million) Analysis by Active Ingredient Type, 2020-2035
  • Figure 97: Latin America Market Volume (MT) Analysis by Active Ingredient Type, 2020-2035
  • Figure 98: Latin America Market Value Share (%) and BPS Analysis by Active Ingredient Type, 2025-2035
  • Figure 99: Latin America Market Y-o-Y Growth (%) Projections by Active Ingredient Type, 2025-2035
  • Figure 100: Latin America Market Value (USD Million) Analysis by Product Format, 2020-2035
  • Figure 101: Latin America Market Volume (MT) Analysis by Product Format, 2020-2035
  • Figure 102: Latin America Market Value Share (%) and BPS Analysis by Product Format, 2025-2035
  • Figure 103: Latin America Market Y-o-Y Growth (%) Projections by Product Format, 2025-2035
  • Figure 104: Latin America Market Value (USD Million) Analysis by Target Consumer, 2020-2035
  • Figure 105: Latin America Market Volume (MT) Analysis by Target Consumer, 2020-2035
  • Figure 106: Latin America Market Value Share (%) and BPS Analysis by Target Consumer, 2025-2035
  • Figure 107: Latin America Market Y-o-Y Growth (%) Projections by Target Consumer, 2025-2035
  • Figure 108: Latin America Market Value (USD Million) Analysis by Benefit Claims, 2020-2035
  • Figure 109: Latin America Market Volume (MT) Analysis by Benefit Claims, 2020-2035
  • Figure 110: Latin America Market Value Share (%) and BPS Analysis by Benefit Claims, 2025-2035
  • Figure 111: Latin America Market Y-o-Y Growth (%) Projections by Benefit Claims, 2025-2035
  • Figure 112: Latin America Market Value (USD Million) Analysis by Packaging Type, 2020-2035
  • Figure 113: Latin America Market Volume (MT) Analysis by Packaging Type, 2020-2035
  • Figure 114: Latin America Market Value Share (%) and BPS Analysis by Packaging Type, 2025-2035
  • Figure 115: Latin America Market Y-o-Y Growth (%) Projections by Packaging Type, 2025-2035
  • Figure 116: Latin America Market Value (USD Million) Analysis by Sales Channel, 2020-2035
  • Figure 117: Latin America Market Volume (MT) Analysis by Sales Channel, 2020-2035
  • Figure 118: Latin America Market Value Share (%) and BPS Analysis by Sales Channel, 2025-2035
  • Figure 119: Latin America Market Y-o-Y Growth (%) Projections by Sales Channel, 2025-2035
  • Figure 120: Latin America Market Attractiveness by Active Ingredient Type, 2025-2035
  • Figure 121: Latin America Market Attractiveness by Product Format, 2025-2035
  • Figure 122: Latin America Market Attractiveness by Target Consumer, 2025-2035
  • Figure 123: Latin America Market Attractiveness by Benefit Claims, 2025-2035
  • Figure 124: Latin America Market Attractiveness by Packaging Type, 2025-2035
  • Figure 125: Latin America Market Attractiveness by Sales Channel, 2025-2035
  • Figure 126: Latin America Market Attractiveness by Country, 2025-2035
  • Figure 127: Europe Market Value (USD Million) by Active Ingredient Type, 2025-2035
  • Figure 128: Europe Market Value (USD Million) by Product Format, 2025-2035
  • Figure 129: Europe Market Value (USD Million) by Target Consumer, 2025-2035
  • Figure 130: Europe Market Value (USD Million) by Benefit Claims, 2025-2035
  • Figure 131: Europe Market Value (USD Million) by Packaging Type, 2025-2035
  • Figure 132: Europe Market Value (USD Million) by Sales Channel, 2025-2035
  • Figure 133: Europe Market Value (USD Million) by Country, 2025-2035
  • Figure 134: Europe Market Value (USD Million) Analysis by Country, 2020-2035
  • Figure 135: Europe Market Volume (MT) Analysis by Country, 2020-2035
  • Figure 136: Europe Market Value Share (%) and BPS Analysis by Country, 2025-2035
  • Figure 137: Europe Market Y-o-Y Growth (%) Projections by Country, 2025-2035
  • Figure 138: Europe Market Value (USD Million) Analysis by Active Ingredient Type, 2020-2035
  • Figure 139: Europe Market Volume (MT) Analysis by Active Ingredient Type, 2020-2035
  • Figure 140: Europe Market Value Share (%) and BPS Analysis by Active Ingredient Type, 2025-2035
  • Figure 141: Europe Market Y-o-Y Growth (%) Projections by Active Ingredient Type, 2025-2035
  • Figure 142: Europe Market Value (USD Million) Analysis by Product Format, 2020-2035
  • Figure 143: Europe Market Volume (MT) Analysis by Product Format, 2020-2035
  • Figure 144: Europe Market Value Share (%) and BPS Analysis by Product Format, 2025-2035
  • Figure 145: Europe Market Y-o-Y Growth (%) Projections by Product Format, 2025-2035
  • Figure 146: Europe Market Value (USD Million) Analysis by Target Consumer, 2020-2035
  • Figure 147: Europe Market Volume (MT) Analysis by Target Consumer, 2020-2035
  • Figure 148: Europe Market Value Share (%) and BPS Analysis by Target Consumer, 2025-2035
  • Figure 149: Europe Market Y-o-Y Growth (%) Projections by Target Consumer, 2025-2035
  • Figure 150: Europe Market Value (USD Million) Analysis by Benefit Claims, 2020-2035
  • Figure 151: Europe Market Volume (MT) Analysis by Benefit Claims, 2020-2035
  • Figure 152: Europe Market Value Share (%) and BPS Analysis by Benefit Claims, 2025-2035
  • Figure 153: Europe Market Y-o-Y Growth (%) Projections by Benefit Claims, 2025-2035
  • Figure 154: Europe Market Value (USD Million) Analysis by Packaging Type, 2020-2035
  • Figure 155: Europe Market Volume (MT) Analysis by Packaging Type, 2020-2035
  • Figure 156: Europe Market Value Share (%) and BPS Analysis by Packaging Type, 2025-2035
  • Figure 157: Europe Market Y-o-Y Growth (%) Projections by Packaging Type, 2025-2035
  • Figure 158: Europe Market Value (USD Million) Analysis by Sales Channel, 2020-2035
  • Figure 159: Europe Market Volume (MT) Analysis by Sales Channel, 2020-2035
  • Figure 160: Europe Market Value Share (%) and BPS Analysis by Sales Channel, 2025-2035
  • Figure 161: Europe Market Y-o-Y Growth (%) Projections by Sales Channel, 2025-2035
  • Figure 162: Europe Market Attractiveness by Active Ingredient Type, 2025-2035
  • Figure 163: Europe Market Attractiveness by Product Format, 2025-2035
  • Figure 164: Europe Market Attractiveness by Target Consumer, 2025-2035
  • Figure 165: Europe Market Attractiveness by Benefit Claims, 2025-2035
  • Figure 166: Europe Market Attractiveness by Packaging Type, 2025-2035
  • Figure 167: Europe Market Attractiveness by Sales Channel, 2025-2035
  • Figure 168: Europe Market Attractiveness by Country, 2025-2035
  • Figure 169: East Asia Market Value (USD Million) by Active Ingredient Type, 2025-2035
  • Figure 170: East Asia Market Value (USD Million) by Product Format, 2025-2035
  • Figure 171: East Asia Market Value (USD Million) by Target Consumer, 2025-2035
  • Figure 172: East Asia Market Value (USD Million) by Benefit Claims, 2025-2035
  • Figure 173: East Asia Market Value (USD Million) by Packaging Type, 2025-2035
  • Figure 174: East Asia Market Value (USD Million) by Sales Channel, 2025-2035
  • Figure 175: East Asia Market Value (USD Million) by Country, 2025-2035
  • Figure 176: East Asia Market Value (USD Million) Analysis by Country, 2020-2035
  • Figure 177: East Asia Market Volume (MT) Analysis by Country, 2020-2035
  • Figure 178: East Asia Market Value Share (%) and BPS Analysis by Country, 2025-2035
  • Figure 179: East Asia Market Y-o-Y Growth (%) Projections by Country, 2025-2035
  • Figure 180: East Asia Market Value (USD Million) Analysis by Active Ingredient Type, 2020-2035
  • Figure 181: East Asia Market Volume (MT) Analysis by Active Ingredient Type, 2020-2035
  • Figure 182: East Asia Market Value Share (%) and BPS Analysis by Active Ingredient Type, 2025-2035
  • Figure 183: East Asia Market Y-o-Y Growth (%) Projections by Active Ingredient Type, 2025-2035
  • Figure 184: East Asia Market Value (USD Million) Analysis by Product Format, 2020-2035
  • Figure 185: East Asia Market Volume (MT) Analysis by Product Format, 2020-2035
  • Figure 186: East Asia Market Value Share (%) and BPS Analysis by Product Format, 2025-2035
  • Figure 187: East Asia Market Y-o-Y Growth (%) Projections by Product Format, 2025-2035
  • Figure 188: East Asia Market Value (USD Million) Analysis by Target Consumer, 2020-2035
  • Figure 189: East Asia Market Volume (MT) Analysis by Target Consumer, 2020-2035
  • Figure 190: East Asia Market Value Share (%) and BPS Analysis by Target Consumer, 2025-2035
  • Figure 191: East Asia Market Y-o-Y Growth (%) Projections by Target Consumer, 2025-2035
  • Figure 192: East Asia Market Value (USD Million) Analysis by Benefit Claims, 2020-2035
  • Figure 193: East Asia Market Volume (MT) Analysis by Benefit Claims, 2020-2035
  • Figure 194: East Asia Market Value Share (%) and BPS Analysis by Benefit Claims, 2025-2035
  • Figure 195: East Asia Market Y-o-Y Growth (%) Projections by Benefit Claims, 2025-2035
  • Figure 196: East Asia Market Value (USD Million) Analysis by Packaging Type, 2020-2035
  • Figure 197: East Asia Market Volume (MT) Analysis by Packaging Type, 2020-2035
  • Figure 198: East Asia Market Value Share (%) and BPS Analysis by Packaging Type, 2025-2035
  • Figure 199: East Asia Market Y-o-Y Growth (%) Projections by Packaging Type, 2025-2035
  • Figure 200: East Asia Market Value (USD Million) Analysis by Sales Channel, 2020-2035
  • Figure 201: East Asia Market Volume (MT) Analysis by Sales Channel, 2020-2035
  • Figure 202: East Asia Market Value Share (%) and BPS Analysis by Sales Channel, 2025-2035
  • Figure 203: East Asia Market Y-o-Y Growth (%) Projections by Sales Channel, 2025-2035
  • Figure 204: East Asia Market Attractiveness by Active Ingredient Type, 2025-2035
  • Figure 205: East Asia Market Attractiveness by Product Format, 2025-2035
  • Figure 206: East Asia Market Attractiveness by Target Consumer, 2025-2035
  • Figure 207: East Asia Market Attractiveness by Benefit Claims, 2025-2035
  • Figure 208: East Asia Market Attractiveness by Packaging Type, 2025-2035
  • Figure 209: East Asia Market Attractiveness by Sales Channel, 2025-2035
  • Figure 210: East Asia Market Attractiveness by Country, 2025-2035
  • Figure 211: South Asia & Pacific Market Value (USD Million) by Active Ingredient Type, 2025-2035
  • Figure 212: South Asia & Pacific Market Value (USD Million) by Product Format, 2025-2035
  • Figure 213: South Asia & Pacific Market Value (USD Million) by Target Consumer, 2025-2035
  • Figure 214: South Asia & Pacific Market Value (USD Million) by Benefit Claims, 2025-2035
  • Figure 215: South Asia & Pacific Market Value (USD Million) by Packaging Type, 2025-2035
  • Figure 216: South Asia & Pacific Market Value (USD Million) by Sales Channel, 2025-2035
  • Figure 217: South Asia & Pacific Market Value (USD Million) by Country, 2025-2035
  • Figure 218: South Asia & Pacific Market Value (USD Million) Analysis by Country, 2020-2035
  • Figure 219: South Asia & Pacific Market Volume (MT) Analysis by Country, 2020-2035
  • Figure 220: South Asia & Pacific Market Value Share (%) and BPS Analysis by Country, 2025-2035
  • Figure 221: South Asia & Pacific Market Y-o-Y Growth (%) Projections by Country, 2025-2035
  • Figure 222: South Asia & Pacific Market Value (USD Million) Analysis by Active Ingredient Type, 2020-2035
  • Figure 223: South Asia & Pacific Market Volume (MT) Analysis by Active Ingredient Type, 2020-2035
  • Figure 224: South Asia & Pacific Market Value Share (%) and BPS Analysis by Active Ingredient Type, 2025-2035
  • Figure 225: South Asia & Pacific Market Y-o-Y Growth (%) Projections by Active Ingredient Type, 2025-2035
  • Figure 226: South Asia & Pacific Market Value (USD Million) Analysis by Product Format, 2020-2035
  • Figure 227: South Asia & Pacific Market Volume (MT) Analysis by Product Format, 2020-2035
  • Figure 228: South Asia & Pacific Market Value Share (%) and BPS Analysis by Product Format, 2025-2035
  • Figure 229: South Asia & Pacific Market Y-o-Y Growth (%) Projections by Product Format, 2025-2035
  • Figure 230: South Asia & Pacific Market Value (USD Million) Analysis by Target Consumer, 2020-2035
  • Figure 231: South Asia & Pacific Market Volume (MT) Analysis by Target Consumer, 2020-2035
  • Figure 232: South Asia & Pacific Market Value Share (%) and BPS Analysis by Target Consumer, 2025-2035
  • Figure 233: South Asia & Pacific Market Y-o-Y Growth (%) Projections by Target Consumer, 2025-2035
  • Figure 234: South Asia & Pacific Market Value (USD Million) Analysis by Benefit Claims, 2020-2035
  • Figure 235: South Asia & Pacific Market Volume (MT) Analysis by Benefit Claims, 2020-2035
  • Figure 236: South Asia & Pacific Market Value Share (%) and BPS Analysis by Benefit Claims, 2025-2035
  • Figure 237: South Asia & Pacific Market Y-o-Y Growth (%) Projections by Benefit Claims, 2025-2035
  • Figure 238: South Asia & Pacific Market Value (USD Million) Analysis by Packaging Type, 2020-2035
  • Figure 239: South Asia & Pacific Market Volume (MT) Analysis by Packaging Type, 2020-2035
  • Figure 240: South Asia & Pacific Market Value Share (%) and BPS Analysis by Packaging Type, 2025-2035
  • Figure 241: South Asia & Pacific Market Y-o-Y Growth (%) Projections by Packaging Type, 2025-2035
  • Figure 242: South Asia & Pacific Market Value (USD Million) Analysis by Sales Channel, 2020-2035
  • Figure 243: South Asia & Pacific Market Volume (MT) Analysis by Sales Channel, 2020-2035
  • Figure 244: South Asia & Pacific Market Value Share (%) and BPS Analysis by Sales Channel, 2025-2035
  • Figure 245: South Asia & Pacific Market Y-o-Y Growth (%) Projections by Sales Channel, 2025-2035
  • Figure 246: South Asia & Pacific Market Attractiveness by Active Ingredient Type, 2025-2035
  • Figure 247: South Asia & Pacific Market Attractiveness by Product Format, 2025-2035
  • Figure 248: South Asia & Pacific Market Attractiveness by Target Consumer, 2025-2035
  • Figure 249: South Asia & Pacific Market Attractiveness by Benefit Claims, 2025-2035
  • Figure 250: South Asia & Pacific Market Attractiveness by Packaging Type, 2025-2035
  • Figure 251: South Asia & Pacific Market Attractiveness by Sales Channel, 2025-2035
  • Figure 252: South Asia & Pacific Market Attractiveness by Country, 2025-2035
  • Figure 253: MEA Market Value (USD Million) by Active Ingredient Type, 2025-2035
  • Figure 254: MEA Market Value (USD Million) by Product Format, 2025-2035
  • Figure 255: MEA Market Value (USD Million) by Target Consumer, 2025-2035
  • Figure 256: MEA Market Value (USD Million) by Benefit Claims, 2025-2035
  • Figure 257: MEA Market Value (USD Million) by Packaging Type, 2025-2035
  • Figure 258: MEA Market Value (USD Million) by Sales Channel, 2025-2035
  • Figure 259: MEA Market Value (USD Million) by Country, 2025-2035
  • Figure 260: MEA Market Value (USD Million) Analysis by Country, 2020-2035
  • Figure 261: MEA Market Volume (MT) Analysis by Country, 2020-2035
  • Figure 262: MEA Market Value Share (%) and BPS Analysis by Country, 2025-2035
  • Figure 263: MEA Market Y-o-Y Growth (%) Projections by Country, 2025-2035
  • Figure 264: MEA Market Value (USD Million) Analysis by Active Ingredient Type, 2020-2035
  • Figure 265: MEA Market Volume (MT) Analysis by Active Ingredient Type, 2020-2035
  • Figure 266: MEA Market Value Share (%) and BPS Analysis by Active Ingredient Type, 2025-2035
  • Figure 267: MEA Market Y-o-Y Growth (%) Projections by Active Ingredient Type, 2025-2035
  • Figure 268: MEA Market Value (USD Million) Analysis by Product Format, 2020-2035
  • Figure 269: MEA Market Volume (MT) Analysis by Product Format, 2020-2035
  • Figure 270: MEA Market Value Share (%) and BPS Analysis by Product Format, 2025-2035
  • Figure 271: MEA Market Y-o-Y Growth (%) Projections by Product Format, 2025-2035
  • Figure 272: MEA Market Value (USD Million) Analysis by Target Consumer, 2020-2035
  • Figure 273: MEA Market Volume (MT) Analysis by Target Consumer, 2020-2035
  • Figure 274: MEA Market Value Share (%) and BPS Analysis by Target Consumer, 2025-2035
  • Figure 275: MEA Market Y-o-Y Growth (%) Projections by Target Consumer, 2025-2035
  • Figure 276: MEA Market Value (USD Million) Analysis by Benefit Claims, 2020-2035
  • Figure 277: MEA Market Volume (MT) Analysis by Benefit Claims, 2020-2035
  • Figure 278: MEA Market Value Share (%) and BPS Analysis by Benefit Claims, 2025-2035
  • Figure 279: MEA Market Y-o-Y Growth (%) Projections by Benefit Claims, 2025-2035
  • Figure 280: MEA Market Value (USD Million) Analysis by Packaging Type, 2020-2035
  • Figure 281: MEA Market Volume (MT) Analysis by Packaging Type, 2020-2035
  • Figure 282: MEA Market Value Share (%) and BPS Analysis by Packaging Type, 2025-2035
  • Figure 283: MEA Market Y-o-Y Growth (%) Projections by Packaging Type, 2025-2035
  • Figure 284: MEA Market Value (USD Million) Analysis by Sales Channel, 2020-2035
  • Figure 285: MEA Market Volume (MT) Analysis by Sales Channel, 2020-2035
  • Figure 286: MEA Market Value Share (%) and BPS Analysis by Sales Channel, 2025-2035
  • Figure 287: MEA Market Y-o-Y Growth (%) Projections by Sales Channel, 2025-2035
  • Figure 288: MEA Market Attractiveness by Active Ingredient Type, 2025-2035
  • Figure 289: MEA Market Attractiveness by Product Format, 2025-2035
  • Figure 290: MEA Market Attractiveness by Target Consumer, 2025-2035
  • Figure 291: MEA Market Attractiveness by Benefit Claims, 2025-2035
  • Figure 292: MEA Market Attractiveness by Packaging Type, 2025-2035
  • Figure 293: MEA Market Attractiveness by Sales Channel, 2025-2035
  • Figure 294: MEA Market Attractiveness by Country, 2025-2035

Frequently Asked Questions

How big is the Beauty-from-Within Drinks in 2025?

The global Beauty-from-Within Drinks is estimated to be valued at USD 3,235.6 million in 2025.

What will be the size of Beauty-from-Within Drinks in 2035?

The market size for the Beauty-from-Within Drinks is projected to reach USD 5,893.4 million by 2035.

How much will be the Beauty-from-Within Drinks growth between 2025 and 2035?

The Beauty-from-Within Drinks is expected to grow at a 6.2% CAGR between 2025 and 2035.

What are the key product format in the Beauty-from-Within Drinks?

The key product formats in the Beauty-from-Within Drinks Market include Ready-to-Drink (RTD) Bottles, Powdered Drink Mixes, Concentrated Shots, Carbonated Beauty Drinks, and Tea & Infused Water.

Which benefit claims segment to contribute significant share in the Beauty-from-Within Drinks in 2025?

In terms of benefit claims, Skin Hydration & Moisture segment is projected to command the largest share at 25% in the Beauty-from-Within Drinks Market in 2025.

Explore Similar Insights

Future Market Insights

Beauty-from-Within Drinks Market