

- Market Size (2026)
- USD 2.0 Bn
- Forecast (2036)
- USD 5.6 Bn
- CAGR (2026 to 2036)
- 10.8%
How big is the sulphur recovery technology market in 2026?
USD 2.0 billion in 2026, reaching USD 5.6 billion by 2036 at a 10.8% CAGR
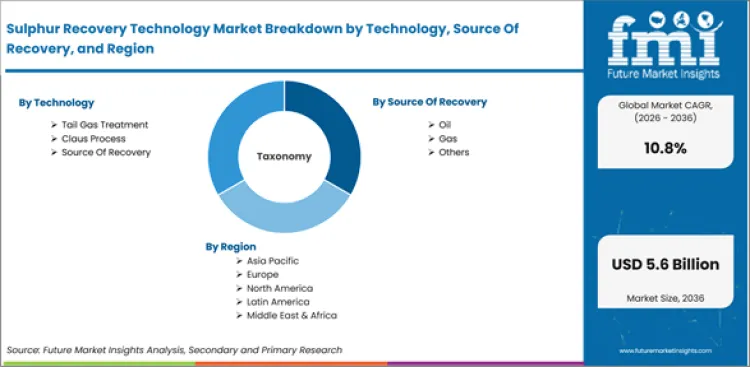
The sulphur recovery technology market was valued at USD 1.8 billion in 2025. The market is set to reach USD 2.0 billion by 2026-end and grow at a CAGR of 10.8% between 2026-2036 to reach USD 5.6 billion by 2036. Tail Gas Treatment will dominate with a 35.0% share, while Oil will lead with a 50.0% share.
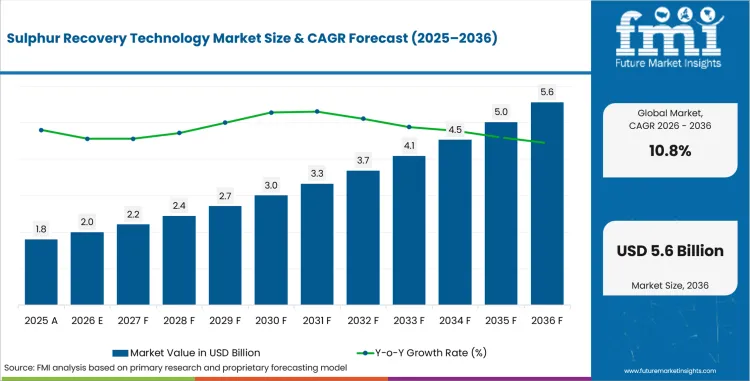
Key Takeaways, Market Size, and Forecast
- Sulphur Recovery Technology Market Value (2025): USD 1.8 Bn
- Sulphur Recovery Technology Market Forecast Value (2036): USD 5.6 Bn
- Sulphur Recovery Technology Market Forecast CAGR (2026 TO 2036): 10.8%
- Sulphur Recovery Technology Market Leading Technology Segment: Tail Gas Treatment (35.0%)
- Sulphur Recovery Technology Market Key Growth Regions: China, India, USA, European Union, South Korea, Japan
- Sulphur Recovery Technology Market Key Players: Schlumberger Limited (Cameron), Fluor Corporation, Worley Limited, Linde plc, Air Liquide Engineering & Construction, Honeywell UOP, Shell Global Solutions
| Parameter | Details |
|---|---|
| Market Size in 2026 (Value) | USD 2.0 Bn |
| Market Forecast in 2036 (Value) | USD 5.6 Bn |
| CAGR (2026 to 2036) | 10.8% |
| Years Considered | 2021 to 2036 |
| Base Year | 2025 |
| Forecast Period | 2026 to 2036 |
| Units Considered | Value (USD Bn) |
| Leading Sub-Region | China |
Summary of the Sulphur Recovery Technology Market
- Demand and Growth Drivers
- Tightening emissions regulations for hydrogen sulfide and sulfur dioxide across oil refining and gas processing operations are mandating investment in higher-efficiency sulphur recovery technology.
- Growing natural gas processing volumes, particularly sour gas reserves in the Middle East and Central Asia, are expanding the installed base of sulphur recovery units.
- Increasing demand for recovered elemental sulphur as fertilizer feedstock (sulphuric acid) is creating economic incentives for higher recovery rates beyond regulatory compliance.
- Product and Segment View
- Tail gas treatment technology holds 35.0% share, reflecting the adoption of post-Claus treatment systems required to achieve sulphur recovery rates above 99.5% mandated by emission standards.
- Oil sources account for 50.0% of recovery source share, as refinery desulphurization of crude oil produces hydrogen sulfide streams that require sulphur recovery processing.
- Oil and gas end use industry holds 61.0% share, as petroleum refining and natural gas processing represent the primary sources of hydrogen sulfide requiring treatment.
- Geography and Competitive Outlook
- China leads at 14.5% CAGR, reflecting refinery modernization, sour gas processing expansion, and tightening emission standards that require higher-efficiency sulphur recovery installations.
- North America and the Middle East maintain significant installed base, with ongoing capacity expansion and technology upgrade projects at existing refinery and gas processing complexes.
- Companies with proven Claus process and tail gas treatment technology, supported by engineering and construction capabilities, are positioned to serve growing global demand.
- Analyst Opinion
- Anurag Sharma, Principal Consultant at FMI says, 'Technology providers that can deliver higher recovery efficiency with lower energy consumption are likely to capture growing demand from refinery operators facing tightening emission limits and rising energy costs over the forecast period.'
- The sulphur recovery technology market is shifting toward higher-efficiency tail gas treatment systems as emission regulations mandate recovery rates approaching 99.9% at new and upgraded facilities.
- Adoption is increasing due to stricter environmental regulations across major refining regions that penalize sulphur dioxide emissions and incentivize investment in recovery technology upgrades.
- Demand is supported by growing sour gas and heavy crude processing volumes that increase hydrogen sulfide feedstock requiring treatment.
- Growth is attributable to the economic value of recovered elemental sulphur used in fertilizer production, creating a positive return on recovery technology investment.
What is sulphur recovery technology and what does the market cover?
Process equipment, engineering services and technology licenses for converting hydrogen sulfide into elemental sulphur
The sulphur recovery technology market encompasses process equipment, engineering services, and technology licenses used to convert hydrogen sulfide from oil refining and gas processing operations into elemental sulphur. Technologies include Claus process units, tail gas treatment systems, reaction furnaces, catalytic converters, and condensing equipment used in regenerative, non-regenerative, and hybrid recovery configurations.
What is included in the sulphur recovery technology market scope?
Claus process units, tail gas treatment systems and associated sulphur recovery process equipment and services, 2026 to 2036.
Market scope covers all commercially traded sulphur recovery technology categorized by technology (tail gas treatment, Claus process, source of recovery), source of recovery (oil, gas, others), capacity (greater than 300 t/d, less than 100 t/d, 101 to 200 t/d, 201 to 300 t/d), end user industry (oil and gas, petrochemical industry, power generation), process type (regenerative sulfur recovery, non-regenerative sulfur recovery, hybrid recovery systems), and component (reaction furnaces, catalytic converters, condensers and absorbers). Revenue is tracked from 2026 to 2036.
What is excluded from the sulphur recovery technology market scope?
Downstream sulphuric acid equipment, sulphur transport and storage infrastructure, and refinery desulphurization catalysts
The scope does not include downstream sulphuric acid manufacturing equipment, elemental sulphur transportation and storage infrastructure, or general refinery desulphurization catalyst products.
How was the sulphur recovery technology market research conducted?
Primary interviews, desk research, bottom-up sizing, and quarterly validation
- Primary Research: FMI analysts conducted interviews with refinery process engineers, gas processing plant operators, technology licensors, and EPC contractors across key refining and gas processing regions.
- Desk Research: Combined data from refinery capacity databases, environmental regulatory filings, and technology licensor revenue disclosures.
- Market Sizing and Forecasting: Bottom-up aggregation of new-build and retrofit project values across capacity tiers, process types, and geographic markets with regulatory compliance timeline projections.
- Data Validation: Cross-validated quarterly against refinery capital expenditure tracking, EPC contract announcements, and environmental permit application data.
Why is the sulphur recovery technology market growing?
Tightening emission standards and sour-gas processing driving high-efficiency recovery investment
- Tightening emission standards in major refining areas require the investment in tail gas treatment facilities with sulphur recovery efficiencies exceeding 99.5% to replace the older, less efficient Claus-only configurations.
- The growing sour gas processing in the Middle East, Central Asia and North America is increasing the installed base of sulphur recovery units and creating demand for larger capacity technology configurations.
- China is leading at 14.5% CAGR, with the largest refinery modernization program in the world, with emission standard upgrades calling for higher-efficiency sulphur recovery at existing and new-build facilities.
Sulphur recovery technology demand is driven by the convergence of environmental regulations, trends in crude oil quality, and growth in natural gas processing. The technology share for tail gas treatment is 35.0%, which is related to the use of post-Claus treatment systems that raise the overall recovery rate from about 95 to 97% (Claus only) to more than 99.5%. Regulatory requirements in the United States, European Union, China and the Middle East mandate these higher recovery rates at new facilities and are increasingly mandating retrofit upgrades at existing installations.
The petroleum refineries are processing heavier, more sour crude oil grades that generate more hydrogen sulfide during hydrodesulphurization, making oil-source hydrogen sulfide 50.0% of the recovery source share. The second major source is gas processing. Sour natural gas containing hydrogen sulphide and carbon dioxide needs acid gas removal and sulphur recovery prior to delivery to pipeline gas specifications. Regenerative sulphur recovery has 54.0% process type shares in the Claus process and tail gas treatment configurations with the recovery and recycling of sulphur compounds through multiple catalytic conversion stages.
Capacity share of large capacity units (over 300 tons per day) is 35.0%, which indicates the scale of sulphur recovery needs at large refinery and gas processing complexes. Reaction furnaces account for the largest share of the components with 36.0%. The thermal reaction stage is the basic equipment in Claus process configurations where the hydrogen sulfide is partially oxidized to form elemental sulphur. Recovery process train is completed by catalytic converters and condensing devices.
How is the sulphur recovery technology market segmented?
By technology, source of recovery, capacity, end user industry, process type and component
- The tail gas treatment leads technology share is at 35.0%, with recovery rates > 99.5% driven by tightening emission standards in all major refining and gas processing regions.
- 50.0% of recovery source share is from oil sources. • Refinery desulphurization of increasing sour crude grades is producing increasing volumes of hydrogen sulphide requiring treatment.
- Regenerative sulphur recovery dominates the process type share at 54.0%, with Claus process and tail gas treatment combinations the industry standard recovery approach.
Why does tail gas treatment lead the sulphur recovery technology market?
It holds 35.0% share, led by post-Claus residual sulphur cleanup units
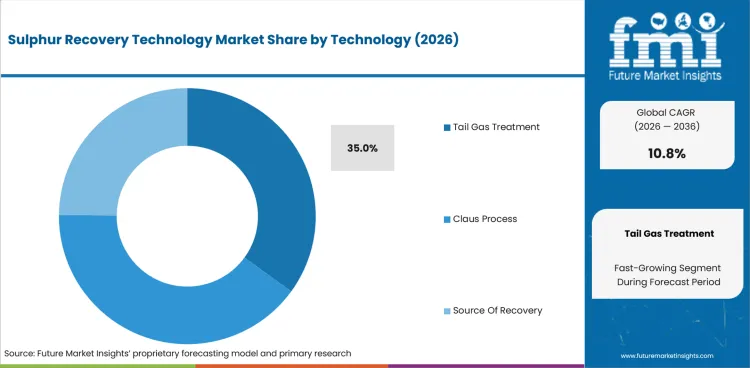
Tail gas treatment will be 35.0% of the technology share in 2026. These systems are dealing with the sulphur compounds left over after the Claus process conversion and give usually an incremental recovery which improves the overall efficiency from 97% up to above 99.5%. Technologies include SCOT (Shell Claus Off-gas Treatment), Beavon-Stretford and proprietary licensor processes which hydrogenate or absorb residual sulphur species.
Regulatory mandates for tail gas treatment in new and major-retrofit facilities establish a compliance-driven demand floor. The economic value of incremental sulphur recovery and avoided emission penalty costs results in a positive investment return which supports adoption beyond minimum regulatory requirements.
How big is the oil and gas segment in the sulphur recovery technology market?
About 61.0% share, led by refinery hydrodesulphurization of fuels
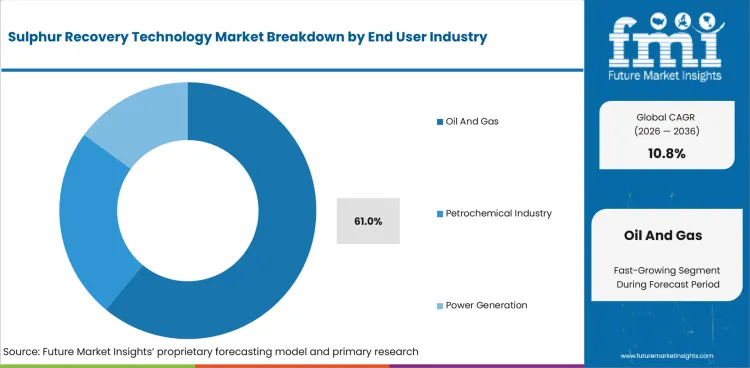
Oil and gas end user industry share 61.0% in 2026. Hydrogen sulfide is generated by hydrodesulphurization of diesel, gasoline and other petroleum fractions in petroleum refineries processing sour crude oil grades. This hydrogen sulphide is then converted into marketable elemental sulphur in sulphur recovery units and sulphur dioxide is not released into the atmosphere.
The second major application is sour gas processing plants for natural gas reserves. Sour gas fields in the Middle East, Central Asia, and western Canada produce gas streams with high concentrations of hydrogen sulfide that must be removed prior to pipeline delivery, thus generating large-scale sulfur recovery needs.
What drives and restrains the sulphur recovery technology market?
Driven by tightening emission standards; restrained by long refinery project lead times and delays
- Tightening emission standards are being adopted in all of the world’s refining regions, creating compliance-driven demand for tail gas treatment technology upgrades and new-build sulphur recovery installations.
- Refinery and gas processing capital investments have long project lead times resulting in uneven demand patterns. Project delays and cancellations create revenue volatility.
- Structural demand for larger-capacity sulphur recovery technology configurations is being driven by expanding sour gas reserve development and heavy crude processing.
The sulphur recovery technology market is witnessing double digit growth due to tightening emission regulation, expanding sour feedstock processing and technology upgrade requirements. Demand is variable due to project cycle volatility and timing of capital investments. Structural growth is underpinned by regulatory compliance mandates and sour gas development.
What drives recovery investment?
Tighter SO2 and H2S emission standards on refineries and gas processing
Tighter environmental standards on sulphur dioxide and hydrogen sulfide emissions from petroleum refining and gas processing operations affect demand. The EPA, EU Industrial Emissions Directive and similar regulations in Asia and the Middle East are driving the installation of tail gas treatment technology at new and existing plants, and the recovery rates required.
What constrains adoption timing?
Long lead times and large capital requirements of refinery projects
The adoption patterns are affected by the long lead times and large capital requirements of refinery and gas processing investment projects. Technology providers and EPC contractors have to face revenue variability due to economic cycles, swings in commodity prices and regulatory uncertainty that can delay project schedules.
What opportunity does sour gas development create?
Processing of high-sulphur acid gas from sour reserves
Growth is driven by the development of sour gas reserves, where the processing of acid gas and the recovery of sulphur are an indispensable part of the design of production facilities. As large sour gas developments proceed in the Middle East, Central Asia and North America, major technology procurement opportunities exist for reaction furnaces, catalytic converters and tail gas treatment systems.
How does recovered sulphur add value?
Recovered elemental sulphur is a valuable feedstock for sulphuric acid and fertilizers
Recovered elemental sulphur is economically valuable as a feedstock for the production of sulphuric acid used in the manufacture of phosphate fertilizer. This value downstream creates positive economics to justify investment in higher recovery efficiency, adding commercial return motivation to regulatory compliance drivers.
Analysis of Sulphur Recovery Technology Market By Key Countries
Which countries are growing fastest in the sulphur recovery technology market?
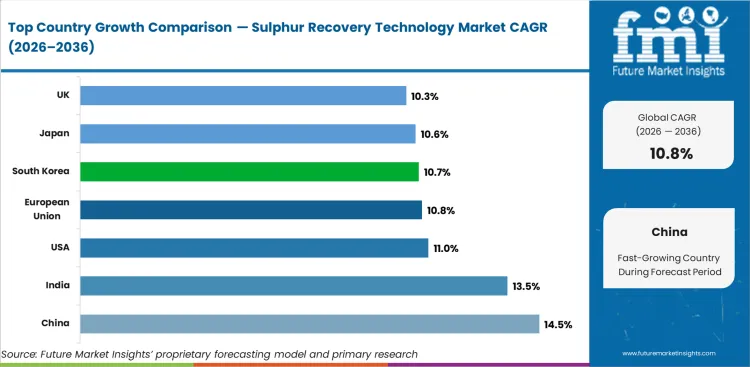
China 14.5%, India 13.5%, USA 11.0%, European Union 10.8%, South Korea 10.7% through 2036
.webp "Top Country Growth Comparison Sulphur Recovery Technology Market Cagr (2026 2036)")
| Country | CAGR |
|---|---|
| China | 14.5% |
| India | 13.5% |
| USA | 11.0% |
| European Union | 10.8% |
| South Korea | 10.7% |
| Japan | 10.6% |
| UK | 10.3% |
- China leads at 14.5% CAGR, reflecting strong investment and infrastructure expansion driving demand.
- India follows at 13.5%, supported by expanding market penetration and growing volumes.
- USA (11.0%) and European Union (10.8%) sustain growth through established demand and policy support.
The global sulphur recovery technology market is estimated to grow at 10.8% CAGR from 2026 to 2036. The study covers more than 30 countries, and the key markets are listed below.
What is the sulphur recovery technology market outlook in the United States?
11.0% CAGR, driven by EPA emission standards, Gulf Coast refinery modernization, and Permian Basin sour gas
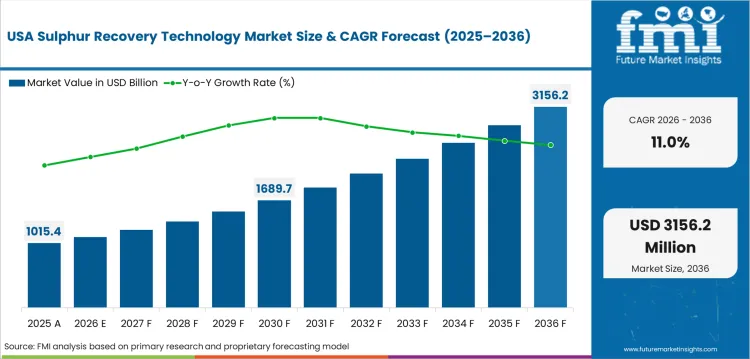
The United States is projected to register 11.0% CAGR through 2036. EPA emission standards, Gulf Coast refinery modernization, and Permian Basin sour gas processing expansion drive technology demand.
- EPA New Source Performance Standards mandate tail gas treatment for new and major-modified sulphur recovery installations at petroleum refineries.
- Gulf Coast refinery modernization projects include sulphur recovery unit upgrades to process heavier sour crude oil grades from domestic and imported sources.
- Permian Basin natural gas processing expansion is creating new sulphur recovery unit installations at sour gas treatment facilities across West Texas and New Mexico.
How fast is the sulphur recovery technology market growing in China?
14.5% CAGR through 2036, the fastest country-level market in the study
China leads at 14.5% CAGR through 2036. The largest refinery modernization program globally, combined with emission standard upgrades, is creating sustained demand for higher-efficiency sulphur recovery technology.
- National emission standards for petroleum refineries are being tightened to require sulphur recovery rates above 99.5%, mandating tail gas treatment at existing and new-build facilities.
- Mega-refinery construction projects along the eastern seaboard include integrated sulphur recovery units designed for sour crude processing capacity expansion.
- Domestic engineering companies are developing localized sulphur recovery technology that competes with international licensors on cost while meeting national performance standards.
What is driving sulphur recovery technology growth in India?
13.5% CAGR, driven by Refinery capacity expansion and emission standard modernization
India is projected to register 13.5% CAGR through 2036. Refinery capacity expansion and emission standard modernization are driving investment in sulphur recovery technology across public and private sector facilities.
- Indian Oil Corporation, Bharat Petroleum, and Reliance Industries refinery expansion projects include sulphur recovery unit installations designed for sour crude processing requirements.
- Central Pollution Control Board emission standards are being updated to require higher recovery rates at petroleum refinery operations, driving retrofit technology investment.
- Growing demand for recovered sulphur as domestic fertilizer feedstock is creating economic incentives for higher recovery efficiency beyond minimum regulatory compliance.
What is the growth opportunity for sulphur recovery technology in the European Union?
10.8% CAGR, driven by EU Industrial Emissions Directive requirements and refinery environmental compliance
The European Union is projected to register 10.8% CAGR through 2036. EU Industrial Emissions Directive requirements and refinery environmental compliance upgrades sustain technology demand.
- EU Industrial Emissions Directive Best Available Technique conclusions mandate high-efficiency sulphur recovery at refinery installations, requiring tail gas treatment systems.
- Refinery environmental compliance upgrades across established refining complexes in Netherlands, Germany, and Italy create retrofit technology procurement opportunities.
- EU carbon border adjustment mechanism is creating additional incentives for process efficiency improvements that reduce emissions per unit of refined product output.
How is the sulphur recovery technology market performing in South Korea?
10.7% CAGR, driven by Advanced refinery infrastructure and stringent emission standards
South Korea is projected to register 10.7% CAGR through 2036. Advanced refinery infrastructure and stringent emission standards support sulphur recovery technology adoption.
- Major refinery complexes operated by SK Innovation and S-Oil maintain high-efficiency sulphur recovery units that undergo periodic technology upgrades to meet tightening standards.
- National emission regulations aligned with OECD best practices mandate tail gas treatment at large-scale refinery operations.
- Petrochemical complex integration creates additional sulphur recovery requirements from cracker and aromatics unit hydrogen sulfide streams.
What is the sulphur recovery technology market forecast for Japan?
10.6% CAGR, driven by refinery rationalization and environmental compliance upgrades at remaining facilities
Japan is projected to register 10.6% CAGR through 2036. Refinery rationalization and environmental compliance upgrades at remaining facilities sustain technology investment.
- Refinery consolidation in Japan is concentrating production at larger, more efficient facilities that require upgraded sulphur recovery technology to meet emission standards.
- Ministry of Environment emission regulations align with international best practices, mandating high recovery rates at petroleum refining operations.
- Technology upgrades at existing facilities focus on improving energy efficiency and reducing operating costs alongside emission compliance improvements.
Who are the leading companies in the sulphur recovery technology market?
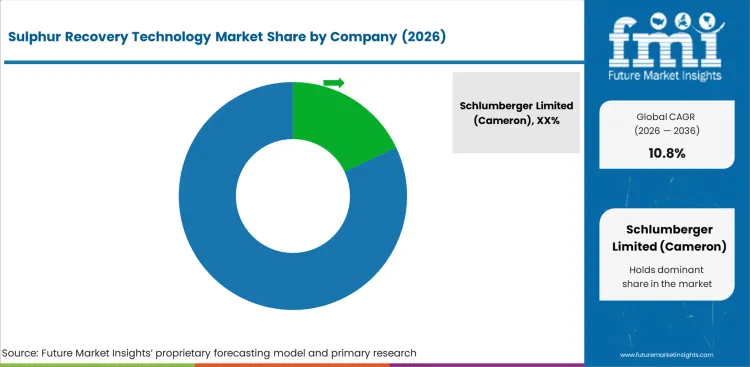
Schlumberger Limited (Cameron), Fluor Corporation, Worley Limited, Linde plc, and Air Liquide Engineering & Construction
- Honeywell UOP leads through proprietary Claus process and tail gas treatment technology licenses with decades of global refinery and gas processing installation experience.
- Fluor Corporation and Worley provide EPC services for sulphur recovery unit construction and retrofits, with project execution capability across global refining regions.
- Linde and Air Liquide offer gas processing technology including acid gas treatment and sulphur recovery systems integrated with broader gas plant design packages.
- Shell Global Solutions licenses SCOT tail gas treatment technology with an extensive installed base across major refining and gas processing operations.
Who are the key players in the sulphur recovery technology market?
Schlumberger Limited (Cameron), Fluor Corporation, Worley Limited, Linde plc and Air Liquide Engineering & Construction, plus regional players
Key global companies leading the sulphur recovery technology market include:
- Schlumberger (Cameron) (USA), Fluor Corporation (USA), Worley Limited (Australia), and Linde plc (UK) lead global sulphur recovery technology markets through process technology expertise, EPC project delivery capability, and established refinery and gas processing customer relationships across major petroleum-producing regions.
- Air Liquide Engineering and Construction (France), Honeywell UOP (USA), and Shell Global Solutions (Netherlands) hold strong positions through proprietary technology licenses, extensive installed base, and technical support infrastructure for Claus process and tail gas treatment systems.
- John Wood Group PLC (UK), Chiyoda Corporation (Japan), and Jacobs Engineering Group (USA) are expanding sulphur recovery project capabilities through engineering services, technology partnerships, and regional project execution experience.
How do top sulphur recovery technology companies compare?
Schlumberger Limited (Cameron) and Fluor Corporation lead globally; Worley Limited, Linde plc and Air Liquide Engineering & Construction are regional specialists
| Company | Technology License Portfolio | EPC Delivery Capability | Refinery Customer Network | Geographic Footprint |
|---|---|---|---|---|
| Honeywell UOP | High | High | Strong | Global |
| Fluor Corporation | High | High | Strong | Global |
| Worley Limited | High | High | Strong | Global |
| Linde plc | High | High | Strong | Global |
| Air Liquide | High | Medium | Strong | Global |
| Shell Global Solutions | High | High | Moderate | Global |
| Schlumberger | Medium | Medium | Moderate | Global |
| John Wood Group | Medium | Medium | Moderate | Europe, Middle East |
| Chiyoda Corporation | Medium | Medium | Moderate | Asia, Middle East |
| Jacobs Engineering | Medium | Medium | Moderate | N. America, Europe |
Source: Future Market Insights competitive analysis, 2026.
Key Developments in Sulphur Recovery Technology Market
- In 2025, Honeywell UOP continued expanding deployment of its Ortloff™ Sulfur Recovery Units (SRUs) and Tail Gas Cleanup technologies, supporting refineries and gas processing facilities in achieving sulfur recovery efficiencies of up to 99.95% while complying with increasingly stringent global emission regulations.
- In 2025, Shell Global Solutions strengthened its position in high-efficiency sulphur recovery by promoting its SCOT® (Shell Claus Off-Gas Treating) technology, which enables sulphur recovery levels as high as 99.98% and is being adopted in refinery and gas processing projects requiring ultra-low SO₂ emissions.
Key Players in the Sulphur Recovery Technology Market
Major Global Players
- Schlumberger Limited (Cameron)
- Fluor Corporation
- Worley Limited
- Linde plc
- Air Liquide Engineering & Construction
- Honeywell UOP
- Shell Global Solutions
- John Wood Group PLC
Emerging Players/Startups
- RedShift Energy
- DESULF PETROCHEM
- Siirtec Nigi
- KT-Kinetics Technology
- Enersul Limited Partnership
- Sulfur Recovery Engineering (SRE)
- GTC Technology US LLC
- Comprimo (ExxonMobil affiliate)
What does the sulphur recovery technology market report cover?
Sulphur Recovery Technology Market - Research Methodology
| Method | Description |
|---|---|
| Primary Research | FMI analysts conducted interviews with manufacturers, distributors, procurement specialists, and end-use operators across China, India, and USA to validate demand patterns and pricing structures for Tail Gas Treatment, and Claus Process and related product categories. |
| Desk Research | Combined trade statistics, regulatory filings, industry association data, and manufacturer disclosures to establish baseline parameters for Sulphur Recovery Technology across technology, source of recovery, capacity, end user industry, process, and component segments. |
| Market Sizing & Forecasting | Bottom-up aggregation across Tail Gas Treatment, Claus Process, and Source Of Recovery product categories and Oil, Gas, and Others source of recovery segments, triangulated with top-down macro indicators and regional adoption curves. |
| Data Validation | Cross-checked quarterly against production statistics, trade flow data, and manufacturer revenue disclosures for Sulphur Recovery Technology products. |
2016 to 2025 history and 2026 to 2036 forecasts across all segments and 30+ countries
| Parameter | Details |
|---|---|
| Market size by 2036 | USD 5.6 Bn |
| Growth rate | 10.8% CAGR (2026 to 2036) |
| Forecast period | 2026 to 2036 |
| Base year value (2025) | USD 1.8 Bn |
| Key Segment Covered | Technology, Source Of Recovery, Capacity, End User Industry, Process Type, Component |
| Regions covered | North America, Latin America, Eastern Europe, Western Europe, East Asia, South Asia and Pacific, Middle East and Africa |
| Countries covered | USA, China, India, European Union, South Korea, Japan, UK, 30 plus countries |
| Key companies profiled | Schlumberger Limited (Cameron), Fluor Corporation, Worley Limited, Linde plc, Air Liquide Engineering & Construction, Honeywell UOP, Shell Global Solutions, John Wood Group PLC, Chiyoda Corporation, Jacobs Engineering Group |
| Approach | Hybrid bottom-up and top-down methodology starting with verified transaction data, projecting adoption velocity across segments and regions. |
Market Segmentation Analysis
Sulphur Recovery Technology Market Segmented by Technology:
- Tail Gas Treatment
- Hydrogenation Tail Gas Systems
- Enhanced Sulfur Recovery Rates
- Emission Compliance Support
- Scavenging Tail Gas Technology
- Residual Sulfur Removal
- Environmental Pollution Reduction
- Hydrogenation Tail Gas Systems
- Claus Process
- Thermal Claus Process
- Hydrogen Sulfide Conversion
- High Sulfur Recovery Efficiency
- Catalytic Claus Process
- Multi Stage Sulfur Recovery
- Reduced Sulfur Emissions
- Thermal Claus Process
- Source Of Recovery
- Acid Gas Recovery Systems
- Refinery Sulfur Extraction
- Improved Process Efficiency
- Sour Water Stripper Recovery
- Hydrogen Sulfide Separation
- Industrial Waste Gas Treatment
- Acid Gas Recovery Systems
Sulphur Recovery Technology Market Segmented by Source Of Recovery:
- Oil
- Refinery Sulfur Recovery
- Crude Oil Desulfurization
- Emission Reduction Compliance
- Heavy Oil Processing
- High Sulfur Crude Treatment
- Improved Fuel Quality
- Refinery Sulfur Recovery
- Gas
- Natural Gas Processing
- Hydrogen Sulfide Removal
- Pipeline Gas Purification
- Sour Gas Treatment
- Sulfur Compound Separation
- Enhanced Gas Quality
- Natural Gas Processing
- Others
- Chemical Processing Plants
- Industrial Sulfur Extraction
- Waste Gas Treatment
- Petrochemical Facilities
- Byproduct Sulfur Recovery
- Environmental Safety Compliance
- Chemical Processing Plants
Sulphur Recovery Technology Market Segmented by Capacity:
- Greater Than 300 t-D
- Ultra Large Recovery Facilities
- High Throughput Sulfur Production
- Complex Refinery Operations
- Integrated Recovery Plants
- Continuous Industrial Processing
- Advanced Emission Control
- Ultra Large Recovery Facilities
- Less Than 100 t-D
- Small Scale Sulfur Recovery Units
- Compact Refinery Applications
- Low Volume Processing
- Modular Recovery Systems
- Flexible Industrial Deployment
- Reduced Capital Investment
- Small Scale Sulfur Recovery Units
- 101-200 t-D
- Medium Capacity Recovery Plants
- Balanced Processing Efficiency
- Refinery Integration Support
- Continuous Recovery Operations
- Stable Sulfur Output
- Industrial Emission Management
- Medium Capacity Recovery Plants
- 201-300 t-D
- Large Scale Recovery Systems
- High Sulfur Processing Capability
- Improved Operational Efficiency
- Advanced Claus Units
- Enhanced Recovery Performance
- Reduced Environmental Impact
- Large Scale Recovery Systems
Sulphur Recovery Technology Market Segmented by End User Industry:
- Oil And Gas
- Upstream Processing Facilities
- Sour Gas Treatment Applications
- Hydrogen Sulfide Removal
- Downstream Refineries
- Fuel Desulfurization Operations
- Emission Compliance Management
- Upstream Processing Facilities
- Petrochemical Industry
- Chemical Manufacturing Plants
- Sulfur Byproduct Recovery
- Industrial Waste Gas Treatment
- Fertilizer Production Facilities
- Sulfur Feedstock Utilization
- Process Efficiency Enhancement
- Chemical Manufacturing Plants
- Power Generation
- Coal Fired Power Plants
- Flue Gas Desulfurization
- Air Pollution Control
- Industrial Power Stations
- Emission Reduction Systems
- Environmental Compliance Support
- Coal Fired Power Plants
Sulphur Recovery Technology Market Segmented by Process Type:
- Regenerative Sulfur Recovery
- Amine Regeneration Systems
- Hydrogen Sulfide Separation
- Continuous Sulfur Recovery
- Catalytic Regeneration Processes
- Enhanced Sulfur Conversion Efficiency
- Reduced Operational Costs
- Amine Regeneration Systems
- Non Regenerative Sulfur Recovery
- Scavenger Based Recovery Systems
- Low Capacity Sulfur Treatment
- Simplified Process Operations
- Adsorption Recovery Processes
- Sulfur Compound Removal
- Industrial Gas Purification
- Scavenger Based Recovery Systems
- Hybrid Recovery Systems
- Integrated Claus Tail Gas Systems
- Maximum Sulfur Recovery Rates
- Advanced Emission Reduction
- Multi Stage Recovery Technology
- Improved Energy Efficiency
- Optimized Plant Performance
- Integrated Claus Tail Gas Systems
Sulphur Recovery Technology Market Segmented by Component:
- Reaction Furnaces
- High Temperature Combustion Units
- Hydrogen Sulfide Conversion
- Thermal Sulfur Recovery
- Waste Heat Boilers
- Heat Recovery Optimization
- Energy Efficiency Improvement
- High Temperature Combustion Units
- Catalytic Converters
- Multi Bed Catalytic Reactors
- Enhanced Sulfur Conversion
- Reduced Sulfur Emissions
- Activated Alumina Catalysts
- Improved Reaction Performance
- Long Operational Lifespan
- Multi Bed Catalytic Reactors
- Condensers And Absorbers
- Sulfur Condensers
- Sulfur Vapor Cooling
- Liquid Sulfur Collection
- Gas Absorption Towers
- Tail Gas Purification
- Emission Control Support
- Sulfur Condensers
Sulphur Recovery Technology Market by Region:
- North America
- USA
- Canada
- Mexico
- Latin America
- Brazil
- Chile
- Rest of Latin America
- Western Europe
- Germany
- UK
- Italy
- Spain
- France
- Nordic
- BENELUX
- Rest of Western Europe
- Eastern Europe
- Russia
- Poland
- Hungary
- Balkan & Baltic
- Rest of Eastern Europe
- East Asia
- China
- Japan
- South Korea
- South Asia and Pacific
- India
- ASEAN
- Australia & New Zealand
- Rest of South Asia and Pacific
- Middle East & Africa
- Kingdom of Saudi Arabia
- Other GCC Countries
- Türkiye
- South Africa
- Other African Union
- Rest of Middle East & Africa
Research Sources and Bibliography
- USA Environmental Protection Agency. (2025). EPA New Source Performance Standards: Petroleum Refineries. EPA.
- European Commission. (2025). EU Industrial Emissions Directive: Best Available Techniques for Refineries. EC.
- International Energy Agency. (2025). IEA Oil Market Report: Refinery Operations and Environmental Compliance. IEA.
- Sulphur Institute. (2025). TSI World Sulphur Production and Trade Report. TSI.
- American Petroleum Institute. (2025). API Standards for Sulphur Recovery Unit Design and Operation. API.
This bibliography is provided for reader reference.
This Report Answers
- Estimating the size of the sulphur recovery technology market and projected revenue from 2026 to 2036.
- Segmentation by technology, source of recovery, capacity, end user industry, process type, component.
- Insights about more than 30 regional markets.
- Analysis of key market dynamics including demand drivers, restraints, and emerging opportunities.
- Assessment of the competitive landscape and strategic positioning of leading companies.
- Identifying investment opportunities across key product segments and geographic markets.
- Supply chain and distribution channel analysis.
- Delivery of data in PDF and Excel formats.
Frequently Asked Questions
How big is the sulphur recovery technology market in 2026?
The global sulphur recovery technology market is estimated to be valued at USD 2.0 billion in 2026.
What will be the size of the sulphur recovery technology market in 2036?
The market size for the sulphur recovery technology market is projected to reach USD 5.6 billion by 2036.
How much will the sulphur recovery technology market growth be between 2026 and 2036?
The sulphur recovery technology market is expected to grow at a 10.8% CAGR between 2026 and 2036.
What are the key technologies in the sulphur recovery technology market?
The key technologies in the sulphur recovery technology market are Tail Gas Treatment, Claus Process and Source Of Recovery.
Which source of recovery segment is expected to contribute a significant share in the sulphur recovery technology market in 2026?
In terms of source of recovery, the oil segment is expected to command 50.0% share in the sulphur recovery technology market in 2026.
Preview the report firsthand - request a free sample
Get SampleGet the brochure for pricing and purchase details.
Get PDFTable of Content
- Key Takeaways
- Market Size and CAGR
- Top Growth Driver
- Fastest Growing Segment
- Leading Region
- Key Companies
- Emerging Opportunities
- Executive Summary
- Global Market Outlook
- Demand-side Trends
- Supply-side Trends
- Technology Roadmap Analysis
- Analysis and Recommendations
- Analyst Perspective (What is happening? Why now? What should investors know?)
- Key Questions Answered
- How large is the market?
- What is the CAGR?
- What are key trends?
- Which region dominates?
- Who are the leaders?
- Market Overview
- Market Coverage / Taxonomy
- Market Definition / Scope / Limitations
- Research Methodology
- Chapter Orientation
- Analytical Lens and Working Hypotheses
- Market Structure, Signals, and Trend Drivers
- Benchmarking and Cross-market Comparability
- Market Sizing, Forecasting, and Opportunity Mapping
- Research Design and Evidence Framework
- Desk Research Programme (Secondary Evidence)
- Expert Input and Fieldwork (Primary Evidence)
- Tooling, Models, and Reference Databases
- Data Engineering and Model Build
- Quality Assurance and Audit Trail
- Market Background
- Market Dynamics (Drivers, Restraints, Opportunity, Trends)
- Scenario Forecast (Optimistic, Likely, Conservative)
- Impact Analysis
- AI Impact
- Sustainability Impact
- Regulatory Impact
- Technology Impact
- Consumer / Buyer Analysis
- Purchase Drivers
- Adoption Barriers
- Buyer Journey
- Opportunity Map Analysis
- Product Life Cycle Analysis
- Supply Chain Analysis
- Investment Feasibility Matrix
- Value Chain Analysis
- PESTLE and Porter's Analysis
- Regulatory Landscape
- Regional Parent Market Outlook
- Production and Consumption Statistics
- Import and Export Statistics
- Global Market Analysis and Forecast, 2021 to 2036
- Historical Market Size Value (USD Million) Analysis, 2021 to 2025
- Current and Future Market Size Value (USD Million) Projections, 2026 to 2036
- Y-o-Y Growth Trend Analysis
- Absolute $ Opportunity Analysis
- Global Market Pricing Analysis, 2021 to 2036
- Global Market Analysis and Forecast, By Technology, 2021 to 2036
- Introduction / Key Findings
- Historical Market Size Value (USD Million) Analysis By Technology, 2021 to 2025
- Current and Future Market Size Value (USD Million) Analysis and Forecast By Technology, 2026 to 2036
- Tail Gas Treatment
- Hydrogenation Tail Gas Systems
- Scavenging Tail Gas Technology
- Claus Process
- Thermal Claus Process
- Catalytic Claus Process
- Source Of Recovery
- Acid Gas Recovery Systems
- Sour Water Stripper Recovery
- Tail Gas Treatment
- Y-o-Y Growth Trend Analysis By Technology, 2021 to 2025
- Absolute $ Opportunity Analysis By Technology, 2026 to 2036
- Global Market Analysis and Forecast, By Source Of Recovery, 2021 to 2036
- Introduction / Key Findings
- Historical Market Size Value (USD Million) Analysis By Source Of Recovery, 2021 to 2025
- Current and Future Market Size Value (USD Million) Analysis and Forecast By Source Of Recovery, 2026 to 2036
- Oil
- Refinery Sulfur Recovery
- Heavy Oil Processing
- Gas
- Natural Gas Processing
- Sour Gas Treatment
- Others
- Chemical Processing Plants
- Petrochemical Facilities
- Oil
- Y-o-Y Growth Trend Analysis By Source Of Recovery, 2021 to 2025
- Absolute $ Opportunity Analysis By Source Of Recovery, 2026 to 2036
- Global Market Analysis and Forecast, By Capacity, 2021 to 2036
- Introduction / Key Findings
- Historical Market Size Value (USD Million) Analysis By Capacity, 2021 to 2025
- Current and Future Market Size Value (USD Million) Analysis and Forecast By Capacity, 2026 to 2036
- Greater Than 300 t-D
- Ultra Large Recovery Facilities
- Integrated Recovery Plants
- Less Than 100 t-D
- Small Scale Sulfur Recovery Value (USD Million)s
- Modular Recovery Systems
- 101-200 t-D
- Medium Capacity Recovery Plants
- Continuous Recovery Operations
- 201-300 t-D
- Large Scale Recovery Systems
- Advanced Claus Value (USD Million)s
- Greater Than 300 t-D
- Y-o-Y Growth Trend Analysis By Capacity, 2021 to 2025
- Absolute $ Opportunity Analysis By Capacity, 2026 to 2036
- Global Market Analysis and Forecast, By End User Industry, 2021 to 2036
- Introduction / Key Findings
- Historical Market Size Value (USD Million) Analysis By End User Industry, 2021 to 2025
- Current and Future Market Size Value (USD Million) Analysis and Forecast By End User Industry, 2026 to 2036
- Oil And Gas
- Upstream Processing Facilities
- Downstream Refineries
- Petrochemical Industry
- Chemical Manufacturing Plants
- Fertilizer Production Facilities
- Power Generation
- Coal Fired Power Plants
- Industrial Power Stations
- Oil And Gas
- Y-o-Y Growth Trend Analysis By End User Industry, 2021 to 2025
- Absolute $ Opportunity Analysis By End User Industry, 2026 to 2036
- Global Market Analysis and Forecast, By Process Type, 2021 to 2036
- Introduction / Key Findings
- Historical Market Size Value (USD Million) Analysis By Process Type, 2021 to 2025
- Current and Future Market Size Value (USD Million) Analysis and Forecast By Process Type, 2026 to 2036
- Regenerative Sulfur Recovery
- Amine Regeneration Systems
- Catalytic Regeneration Processes
- Non Regenerative Sulfur Recovery
- Scavenger Based Recovery Systems
- Adsorption Recovery Processes
- Hybrid Recovery Systems
- Integrated Claus Tail Gas Systems
- Multi Stage Recovery Technology
- Regenerative Sulfur Recovery
- Y-o-Y Growth Trend Analysis By Process Type, 2021 to 2025
- Absolute $ Opportunity Analysis By Process Type, 2026 to 2036
- Global Market Analysis and Forecast, By Component
- Introduction / Key Findings
- Historical Market Size Value (USD Million) Analysis By Component, 2021 to 2025
- Current and Future Market Size Value (USD Million) Analysis and Forecast By Component, 2026 to 2036
- Reaction Furnaces
- High Temperature Combustion Value (USD Million)s
- Waste Heat Boilers
- Catalytic Converters
- Multi Bed Catalytic Reactors
- Activated Alumina Catalysts
- Condensers And Absorbers
- Sulfur Condensers
- Gas Absorption Towers
- Reaction Furnaces
- Y-o-Y Growth Trend Analysis By Component, 2021 to 2025
- Absolute $ Opportunity Analysis By Component, 2026 to 2036
- Global Market Analysis and Forecast, By Region, 2021 to 2036
- Introduction
- Historical Market Size Value (USD Million) Analysis By Region, 2021 to 2025
- Current Market Size Value (USD Million) Analysis and Forecast By Region, 2026 to 2036
- North America
- Latin America
- Western Europe
- Eastern Europe
- East Asia
- South Asia and Pacific
- Middle East & Africa
- Market Attractiveness Analysis By Region
- North America Market Analysis and Forecast, By Country, 2021 to 2036
- Historical Market Size Value (USD Million) Trend Analysis By Market Taxonomy, 2021 to 2025
- Market Size Value (USD Million) Forecast By Market Taxonomy, 2026 to 2036
- By Country
- USA
- Canada
- Mexico
- By Technology
- By Source Of Recovery
- By Capacity
- By End User Industry
- By Process Type
- By Component
- By Country
- Market Attractiveness Analysis
- By Country
- By Technology
- By Source Of Recovery
- By Capacity
- By End User Industry
- By Process Type
- By Component
- Key Takeaways
- Latin America Market Analysis and Forecast, By Country
- Historical Market Size Value (USD Million) Trend Analysis By Market Taxonomy, 2021 to 2025
- Market Size Value (USD Million) Forecast By Market Taxonomy, 2026 to 2036
- By Country
- Brazil
- Chile
- Rest of Latin America
- By Technology
- By Source Of Recovery
- By Capacity
- By End User Industry
- By Process Type
- By Component
- By Country
- Market Attractiveness Analysis
- By Country
- By Technology
- By Source Of Recovery
- By Capacity
- By End User Industry
- By Process Type
- By Component
- Key Takeaways
- Western Europe Market Analysis and Forecast, By Country
- Historical Market Size Value (USD Million) Trend Analysis By Market Taxonomy, 2021 to 2025
- Market Size Value (USD Million) Forecast By Market Taxonomy, 2026 to 2036
- By Country
- Germany
- UK
- Italy
- Spain
- France
- Nordic
- BENELUX
- Rest of Western Europe
- By Technology
- By Source Of Recovery
- By Capacity
- By End User Industry
- By Process Type
- By Component
- By Country
- Market Attractiveness Analysis
- By Country
- By Technology
- By Source Of Recovery
- By Capacity
- By End User Industry
- By Process Type
- By Component
- Key Takeaways
- Eastern Europe Market Analysis and Forecast, By Country
- Historical Market Size Value (USD Million) Trend Analysis By Market Taxonomy, 2021 to 2025
- Market Size Value (USD Million) Forecast By Market Taxonomy, 2026 to 2036
- By Country
- Russia
- Poland
- Hungary
- Balkan & Baltic
- Rest of Eastern Europe
- By Technology
- By Source Of Recovery
- By Capacity
- By End User Industry
- By Process Type
- By Component
- By Country
- Market Attractiveness Analysis
- By Country
- By Technology
- By Source Of Recovery
- By Capacity
- By End User Industry
- By Process Type
- By Component
- Key Takeaways
- East Asia Market Analysis and Forecast, By Country
- Historical Market Size Value (USD Million) Trend Analysis By Market Taxonomy, 2021 to 2025
- Market Size Value (USD Million) Forecast By Market Taxonomy, 2026 to 2036
- By Country
- China
- Japan
- South Korea
- By Technology
- By Source Of Recovery
- By Capacity
- By End User Industry
- By Process Type
- By Component
- By Country
- Market Attractiveness Analysis
- By Country
- By Technology
- By Source Of Recovery
- By Capacity
- By End User Industry
- By Process Type
- By Component
- Key Takeaways
- South Asia and Pacific Market Analysis and Forecast, By Country
- Historical Market Size Value (USD Million) Trend Analysis By Market Taxonomy, 2021 to 2025
- Market Size Value (USD Million) Forecast By Market Taxonomy, 2026 to 2036
- By Country
- India
- ASEAN
- Australia & New Zealand
- Rest of South Asia and Pacific
- By Technology
- By Source Of Recovery
- By Capacity
- By End User Industry
- By Process Type
- By Component
- By Country
- Market Attractiveness Analysis
- By Country
- By Technology
- By Source Of Recovery
- By Capacity
- By End User Industry
- By Process Type
- By Component
- Key Takeaways
- Middle East & Africa Market Analysis and Forecast, By Country
- Historical Market Size Value (USD Million) Trend Analysis By Market Taxonomy, 2021 to 2025
- Market Size Value (USD Million) Forecast By Market Taxonomy, 2026 to 2036
- By Country
- Kingdom of Saudi Arabia
- Other GCC Countries
- Türkiye
- South Africa
- Other African Union
- Rest of Middle East & Africa
- By Technology
- By Source Of Recovery
- By Capacity
- By End User Industry
- By Process Type
- By Component
- By Country
- Market Attractiveness Analysis
- By Country
- By Technology
- By Source Of Recovery
- By Capacity
- By End User Industry
- By Process Type
- By Component
- Key Takeaways
- Key Countries Market Analysis
- USA
- Pricing Analysis
- Market Share Analysis, 2025
- By Technology
- By Source Of Recovery
- By Capacity
- By End User Industry
- By Process Type
- By Component
- Canada
- Pricing Analysis
- Market Share Analysis, 2025
- By Technology
- By Source Of Recovery
- By Capacity
- By End User Industry
- By Process Type
- By Component
- Mexico
- Pricing Analysis
- Market Share Analysis, 2025
- By Technology
- By Source Of Recovery
- By Capacity
- By End User Industry
- By Process Type
- By Component
- Brazil
- Pricing Analysis
- Market Share Analysis, 2025
- By Technology
- By Source Of Recovery
- By Capacity
- By End User Industry
- By Process Type
- By Component
- Chile
- Pricing Analysis
- Market Share Analysis, 2025
- By Technology
- By Source Of Recovery
- By Capacity
- By End User Industry
- By Process Type
- By Component
- Germany
- Pricing Analysis
- Market Share Analysis, 2025
- By Technology
- By Source Of Recovery
- By Capacity
- By End User Industry
- By Process Type
- By Component
- UK
- Pricing Analysis
- Market Share Analysis, 2025
- By Technology
- By Source Of Recovery
- By Capacity
- By End User Industry
- By Process Type
- By Component
- Italy
- Pricing Analysis
- Market Share Analysis, 2025
- By Technology
- By Source Of Recovery
- By Capacity
- By End User Industry
- By Process Type
- By Component
- Spain
- Pricing Analysis
- Market Share Analysis, 2025
- By Technology
- By Source Of Recovery
- By Capacity
- By End User Industry
- By Process Type
- By Component
- France
- Pricing Analysis
- Market Share Analysis, 2025
- By Technology
- By Source Of Recovery
- By Capacity
- By End User Industry
- By Process Type
- By Component
- India
- Pricing Analysis
- Market Share Analysis, 2025
- By Technology
- By Source Of Recovery
- By Capacity
- By End User Industry
- By Process Type
- By Component
- ASEAN
- Pricing Analysis
- Market Share Analysis, 2025
- By Technology
- By Source Of Recovery
- By Capacity
- By End User Industry
- By Process Type
- By Component
- Australia & New Zealand
- Pricing Analysis
- Market Share Analysis, 2025
- By Technology
- By Source Of Recovery
- By Capacity
- By End User Industry
- By Process Type
- By Component
- China
- Pricing Analysis
- Market Share Analysis, 2025
- By Technology
- By Source Of Recovery
- By Capacity
- By End User Industry
- By Process Type
- By Component
- Japan
- Pricing Analysis
- Market Share Analysis, 2025
- By Technology
- By Source Of Recovery
- By Capacity
- By End User Industry
- By Process Type
- By Component
- South Korea
- Pricing Analysis
- Market Share Analysis, 2025
- By Technology
- By Source Of Recovery
- By Capacity
- By End User Industry
- By Process Type
- By Component
- Russia
- Pricing Analysis
- Market Share Analysis, 2025
- By Technology
- By Source Of Recovery
- By Capacity
- By End User Industry
- By Process Type
- By Component
- Poland
- Pricing Analysis
- Market Share Analysis, 2025
- By Technology
- By Source Of Recovery
- By Capacity
- By End User Industry
- By Process Type
- By Component
- Hungary
- Pricing Analysis
- Market Share Analysis, 2025
- By Technology
- By Source Of Recovery
- By Capacity
- By End User Industry
- By Process Type
- By Component
- Kingdom of Saudi Arabia
- Pricing Analysis
- Market Share Analysis, 2025
- By Technology
- By Source Of Recovery
- By Capacity
- By End User Industry
- By Process Type
- By Component
- Türkiye
- Pricing Analysis
- Market Share Analysis, 2025
- By Technology
- By Source Of Recovery
- By Capacity
- By End User Industry
- By Process Type
- By Component
- South Africa
- Pricing Analysis
- Market Share Analysis, 2025
- By Technology
- By Source Of Recovery
- By Capacity
- By End User Industry
- By Process Type
- By Component
- USA
- Market Structure Analysis
- Competition Dashboard
- Competition Benchmarking
- Market Share Analysis of Top Players
- By Regional
- By Technology
- By Source Of Recovery
- By Capacity
- By End User Industry
- By Process Type
- By Component
- Emerging Startups
- Innovation Benchmarking
- Competition Analysis
- Competition Deep Dive
- Schlumberger Limited (Cameron)
- Overview
- Product Portfolio
- Profitability by Market Segments (Product/Region/Sales Channel)
- Sales Footprint
- Strategy Overview
- Marketing Strategy
- Product Strategy
- Channel Strategy
- Fluor Corporation
- Worley Limited
- Linde plc
- Air Liquide Engineering & Construction
- Honeywell UOP
- Shell Global Solutions
- John Wood Group PLC
- Chiyoda Corporation
- Jacobs Engineering Group
- Schlumberger Limited (Cameron)
- Case Studies
- Success Stories
- Recent Developments
- Competition Deep Dive
- Assumptions & Acronyms Used


