

- Market Size (2026)
- USD 21.9 Bn
- Forecast (2036)
- USD 58.3 Bn
- CAGR (2026 to 2036)
- 10.3%
Wind Turbine Automation Market Size, Market Forecast and Outlook By FMI
Summary of the Wind Turbine Automation Market
- Demand and Growth Drivers
- Demand for wind turbine automation systems is shaped by the global expansion of installed wind capacity, increasing turbine size and complexity, and the operational need for remote monitoring and predictive maintenance across distributed wind farm assets.
- Grid integration requirements and renewable energy mandates are creating structured demand for SCADA systems, condition monitoring platforms, and turbine control solutions that optimize energy output and reduce downtime.
- Offshore wind development is expanding the automation requirement per installation, with higher reliability standards and limited physical access driving investment in advanced remote monitoring and automated control systems.
- Product and Segment View
- SCADA systems are expected to hold 61.1% of the system segment in 2026, reflecting their central role in wind farm supervisory control, data acquisition, and performance optimization across turbine fleets.
- Hardware holds a significant share, supported by growing turbine fleet size and operational complexity across wind farm portfolios.
- The application segment includes Onshore Wind Power Generation, Offshore Wind Power Generation, with adoption patterns varying by turbine technology and site conditions.
- Geography and Competitive Outlook
- USA leads growth at 12.3%, driven by federal renewable energy incentives, onshore wind capacity expansion, and growing offshore wind project pipelines along the Atlantic coast.
- Germany at 11% reflects its mature wind energy sector, repowering activity, and increasing adoption of advanced automation for aging onshore turbine fleets.
- GE Renewable Energy maintains competitive leadership through integrated turbine and automation systems, global service networks, and established relationships with wind farm developers and operators.
- Analyst Opinion
- The wind turbine automation market is transitioning from basic SCADA monitoring into an integrated digital operations platform where predictive maintenance, real time performance optimization, and remote diagnostics define competitive positioning among turbine OEMs and automation providers.
- SCADA systems dominate the system segment at 61.1%, reflecting their foundational role in wind farm operations, but condition monitoring and advanced analytics capabilities are increasingly required as turbine fleets age and operators seek to extend asset life and maximize energy yield.
- Growth reflects the structural expansion of global wind capacity, with both new installations and retrofit programs on existing fleets creating demand for automation hardware, software, and service contracts.
- Companies with end to end capability spanning turbine control, farm level SCADA, condition monitoring, and data analytics are positioned to capture long term service and software revenue alongside initial equipment sales.
- Offshore wind is emerging as a premium automation segment where reliability requirements, remote access constraints, and higher per turbine investment justify more comprehensive automation and monitoring solutions.
Key Takeaways, Market Size, and Forecast
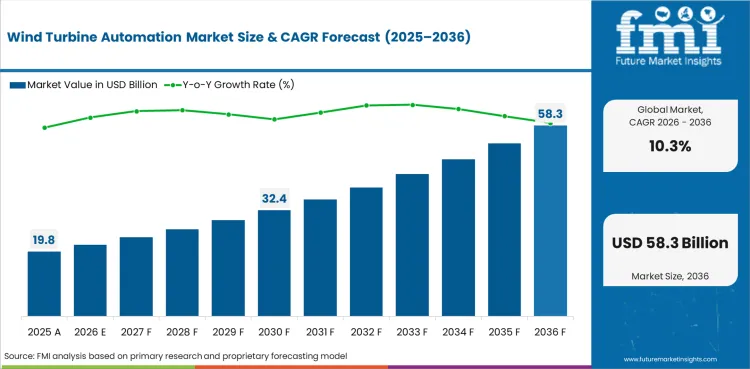
- The wind turbine automation market was valued at USD 19.8 billion in 2025.
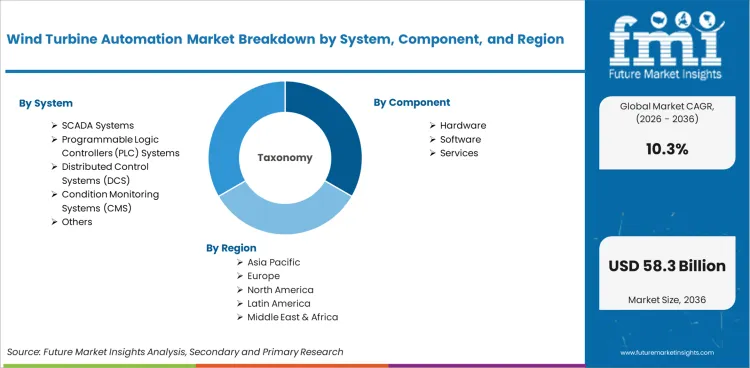
- The market is projected to reach USD 21.9 billion in 2026 and USD 58.3 billion by 2036, growing at a CAGR of 10.3%.
- By 2036, the wind turbine automation market is expected to be worth USD 58.30 billion.
- From 2026 to 2036, the market is projected to expand at a CAGR of 10.3%.
- The market is projected to create an incremental opportunity of USD 36.43 billion between 2026 and 2036.
- In 2026, SCADA Systems are expected to account for 61.1% of the system segment, driven by growing installed wind capacity, operational efficiency requirements, and the need for remote monitoring and predictive maintenance across onshore and offshore wind farms.
- USA (12.3%) and Germany (11.0%) are two of the fastest growing markets in the world.
Wind Turbine Automation Market Definition
The wind turbine automation market encompasses SCADA systems, condition monitoring systems, turbine control systems, pitch and yaw control automation, and remote monitoring platforms used to operate, optimize, and maintain wind turbine assets across onshore and offshore installations.
Wind Turbine Automation Market Inclusions
Market scope encompasses all commercially traded wind turbine automation systems categorized by system, component, application, end use. Revenue coverage spans from 2026 to 2036 across North America, Latin America, Europe, East Asia, South Asia and Pacific, and Middle East and Africa.
Wind Turbine Automation Market Exclusions
The scope does not include wind turbine manufacturing equipment, tower and foundation components, or grid connection infrastructure sold independently of turbine automation systems. Standalone weather monitoring stations without turbine integration are also excluded.
Wind Turbine Automation Market Research Methodology
- Primary Research: FMI analysts conducted interviews with industry participants, product specialists, and distribution channel stakeholders across key geographies.
- Desk Research: Aggregated data from trade associations, regulatory filings, and manufacturer disclosures to build a comprehensive market baseline.
- Market Sizing and Forecasting: Applied a bottom up methodology across product segments, end use categories, and regional adoption curves to arrive at market valuations from 2026 to 2036.
- Data Validation: Cross verified quarterly against production data, trade statistics, and manufacturer reported figures to maintain forecast accuracy.
Why is the Wind Turbine Automation Market Growing?
- Global wind capacity expansion, driven by renewable energy mandates and decarbonization targets, is creating sustained demand for turbine automation systems across new installations and retrofit programs.
- Increasing turbine size and complexity are expanding the automation content per unit, with multi megawatt offshore turbines requiring more sophisticated monitoring and control systems than earlier onshore models.
- USA leads growth at 12.3%, supported by federal tax credits, onshore capacity additions, and growing offshore wind project development.
The wind turbine automation market expands as global installed wind capacity grows and operators invest in digital tools to optimize energy output, reduce maintenance costs, and extend asset lifecycles. SCADA systems hold 61.1% of the system segment, reflecting their foundational role in wind farm supervisory control, real time data acquisition, and performance reporting. Condition monitoring systems are gaining share as operators adopt vibration analysis, oil quality monitoring, and thermal imaging to detect component degradation before failure occurs.
Onshore wind remains the largest installation base, with automation systems integrated into new turbine deliveries and retrofit programs on aging fleets. Offshore wind is growing rapidly as a premium automation segment, with higher per turbine automation content driven by remote access constraints, harsh operating environments, and the economic consequences of unplanned downtime at sea. Floating offshore wind technology is emerging as a future growth category with distinct automation requirements.
Regional growth reflects wind energy policy frameworks, installed capacity trajectories, and repowering activity. The USA (12.3%) leads growth driven by federal incentives and both onshore and offshore project pipelines. Germany (11.0%) reflects its mature wind sector and extensive repowering and retrofit activity. Emerging wind markets in South Asia and Latin America represent growing adoption opportunities as renewable energy targets drive capacity additions.
The competitive landscape is shaped by turbine OEM integration strategies, independent automation provider capabilities, and the growing importance of software and analytics services. Companies that offer end to end solutions spanning turbine control, farm level SCADA, condition monitoring, and predictive analytics are positioned to capture recurring revenue from operations and maintenance contracts alongside initial equipment sales.
Market Segmentation Analysis
- SCADA systems hold 61.1% of the system segment, reflecting their central operational role in wind farm monitoring, control, and performance optimization.
- Hardware represents a growing system category, driven by the need for predictive maintenance and asset lifecycle extension.
- The application segment includes Onshore Wind Power Generation, Offshore Wind Power Generation.
The wind turbine automation market is segmented by system, component, application, end use. Each segment reflects distinct operational requirements, technology platforms, and procurement dynamics.
Insights into the SCADA Systems Segment
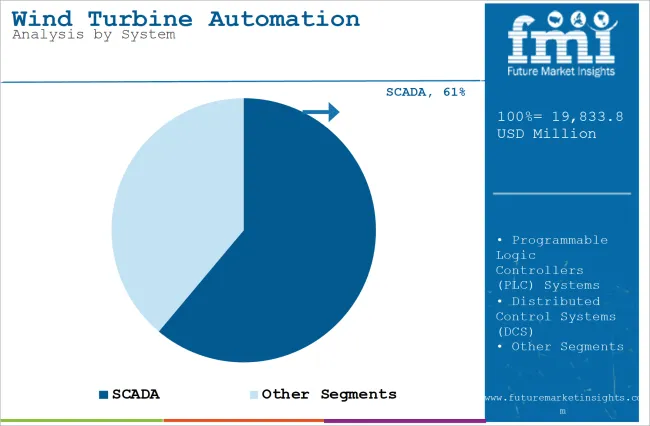
SCADA systems hold 61.1% of the system segment in 2026, providing centralized supervisory control, real time data acquisition, alarm management, and performance reporting for wind farm operations. Modern SCADA platforms integrate with turbine controllers, meteorological stations, and grid connection systems to optimize energy dispatch and curtailment management. Cloud based SCADA deployments are expanding, enabling remote access and fleet level performance analysis across geographically distributed wind farm portfolios.
Insights into the Hardware Segment
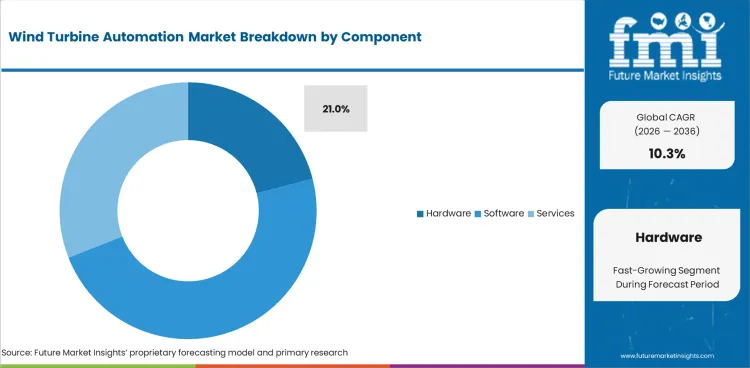
Hardware represent a growing system category, driven by operator demand for predictive maintenance capabilities that reduce unplanned downtime and extend component lifecycles. Vibration analysis, oil quality monitoring, bearing temperature tracking, and structural health monitoring are the primary sensing modalities. Offshore installations drive higher condition monitoring adoption due to the cost and logistical complexity of unplanned maintenance at sea.
Wind Turbine Automation Market Drivers, Restraints, and Opportunities
- Global wind capacity expansion and renewable energy mandates are creating sustained demand for turbine automation across new installations and fleet retrofit programs.
- Integration complexity between legacy turbine controls and modern SCADA and analytics platforms creates adoption friction during fleet upgrade programs.
- Offshore wind development is creating a premium automation segment with higher per turbine content and more demanding reliability requirements.
The wind turbine automation market evolves as installed capacity grows, turbine technology advances, and operators invest in digital operations and predictive maintenance capabilities.
Capacity Expansion and New Installation Demand
Global wind capacity additions, driven by national renewable energy targets and declining levelized cost of energy, are creating sustained demand for automation systems integrated into new turbine deliveries. Both onshore and offshore projects require SCADA, condition monitoring, and control systems as standard installation components.
Legacy Fleet Integration Challenges
Operators managing mixed fleets of turbine models and vintages face integration challenges when deploying modern automation platforms across legacy control systems. Protocol compatibility, data standardization, and retrofit engineering create adoption friction and favor automation providers with multi vendor integration capability.
Offshore Wind Premium Segment
Offshore wind installations require higher automation content per turbine due to remote access constraints, harsh operating environments, and the economic cost of unplanned maintenance. This creates a premium segment where comprehensive monitoring, remote diagnostics, and predictive analytics justify higher per unit automation investment.
Software and Analytics Revenue Growth
The shift from hardware centric to software and analytics driven automation creates recurring revenue opportunities for providers offering performance optimization, predictive maintenance, and fleet management platforms as subscription or service based offerings.
Analysis of Wind Turbine Automation Market By Key Countries
.webp "Top Country Growth Comparison Wind Turbine Automation Market Cagr (2026 2036)")
| Country | CAGR |
|---|---|
| USA | 12.3% |
| Germany | 11% |
| France | 10.3% |
| China | 9.9% |
| India | 9.6% |
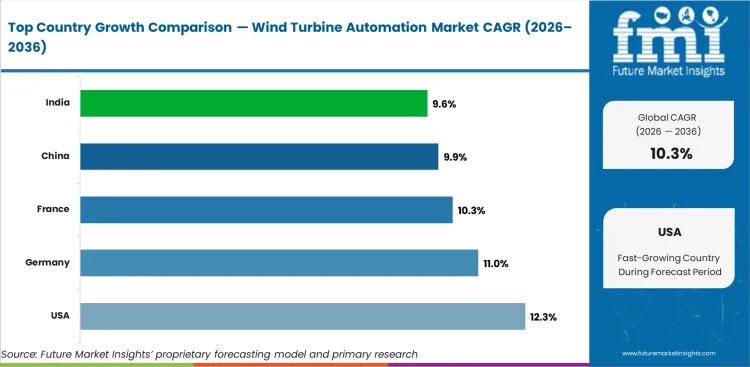
- USA leads at 12.3%, driven by federal renewable energy incentives, onshore capacity expansion, and offshore wind project development.
- Germany at 11% reflects mature wind sector repowering activity and advanced automation adoption for aging onshore fleets.
- France (10.3%) demonstrates growth through renewable energy policy support and capacity additions.
The global wind turbine automation market is expected to grow at a rate of 10.3% per year from 2026 to 2036. The study covers more than 30 countries, and the main markets are listed below.
Demand Outlook for Wind Turbine Automation Market in USA
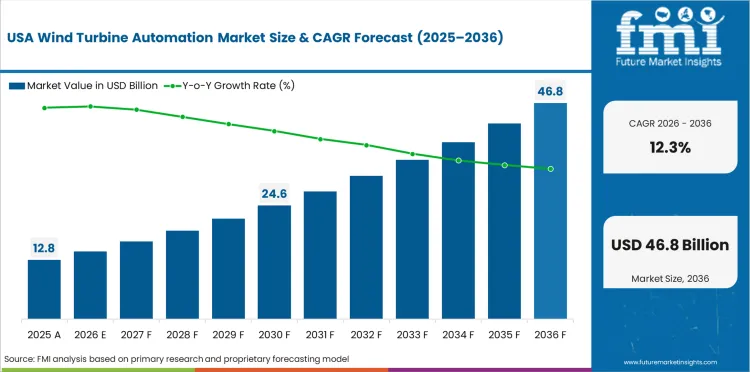
The USA is projected to grow at 12.3% through 2036, driven by federal production and investment tax credits, onshore wind capacity additions across the Midwest and Plains states, and growing offshore wind project pipelines along the Atlantic coast. Automation demand reflects both new installations and retrofit programs on existing turbine fleets.
- Federal tax credits sustain onshore wind capacity additions and automation procurement.
- Offshore wind project development creates demand for premium automation systems.
- Retrofit programs on existing turbine fleets drive SCADA and condition monitoring upgrades.
Future Outlook for Wind Turbine Automation Market in Germany
Germany is expected to grow at 11.0% through 2036, supported by its large installed onshore wind base, extensive repowering programs replacing aging turbines, and Energiewende driven renewable energy commitments. Automation investment focuses on fleet optimization, predictive maintenance, and grid integration compliance.
- Large installed onshore wind base creates substantial retrofit and repowering demand.
- Energiewende commitments sustain investment in wind energy infrastructure.
- Fleet optimization and predictive maintenance drive advanced automation adoption.
Opportunity Analysis of Wind Turbine Automation Market in France
France is expected to grow at 10.3% through 2036, supported by expanding demand and infrastructure investment.
- Expanding demand supports market growth.
- Infrastructure investment creates opportunities.
- Regulatory compliance shapes procurement.
In-depth Analysis of Wind Turbine Automation Market in China
China is projected to grow at 9.9% through 2036, reflecting the world's largest installed wind capacity, continued onshore and offshore expansion, and growing adoption of domestic automation platforms alongside global OEM systems.
- World largest installed wind capacity sustains high volume automation demand.
- Offshore wind expansion increases per turbine automation content.
- Domestic automation platform development expands alongside global OEM systems.
Sales Analysis of Wind Turbine Automation Market in India
India is expected to grow at 9.6% through 2036, driven by national renewable energy targets, onshore wind capacity additions, and growing investment in turbine fleet monitoring and maintenance optimization.
- National renewable energy targets drive onshore wind capacity expansion.
- Growing turbine fleet size increases monitoring and maintenance requirements.
- Infrastructure investment supports automation adoption in new installations.
Competitive Landscape and Strategic Positioning
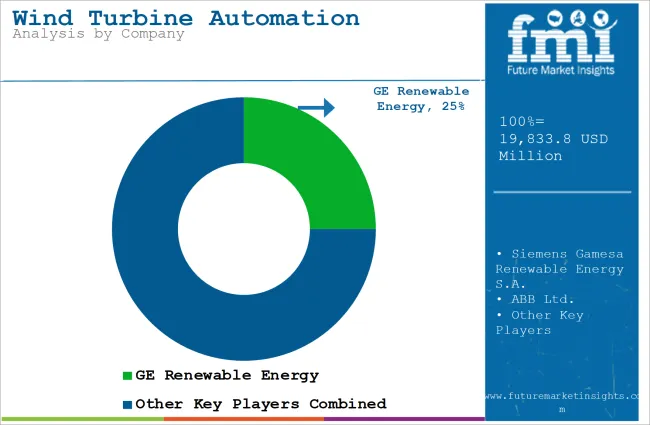
- GE Renewable Energy maintains competitive leadership through integrated turbine and automation platforms, global service infrastructure, and established relationships with wind farm developers and operators.
- Siemens Gamesa and ABB compete on turbine control systems, SCADA platforms, and industrial automation solutions adapted for wind energy applications.
- Independent automation providers target multi vendor fleet management, condition monitoring, and analytics services where turbine OEM neutrality creates competitive advantage.
GE Renewable Energy holds competitive leadership through its integrated turbine and digital wind farm platform, combining turbine control, SCADA, and predictive analytics into a unified operational solution. Siemens Gamesa competes with its own integrated turbine and automation portfolio serving both onshore and offshore markets.
ABB Ltd. and Schneider Electric bring broad industrial automation expertise to wind energy applications, with SCADA, condition monitoring, and power management solutions. Vestas and Goldwind maintain strong positions through integrated turbine and digital operations platforms.
Market entry barriers include turbine OEM integration requirements, wind energy domain expertise, the capital required for SCADA and monitoring platform development, and the established service relationships between turbine manufacturers and wind farm operators.
Key Companies in the Wind Turbine Automation Market
Key global companies leading the wind turbine automation market include:
- GE Renewable Energy, Siemens Gamesa Renewable Energy S.A., ABB Ltd., Schneider Electric hold established positions through operational scale, distribution reach, and product breadth across multiple segments and geographies.
- Mitsubishi Electric Corporation, Rockwell Automation, Honeywell International Inc. have built competitive positioning through focused portfolios and regional market presence.
- Emerson Electric Co., Nordex SE, Vestas Wind Systems A/S represent emerging participants investing in specialized capabilities and niche applications.
Competitive Benchmarking: Wind Turbine Automation Market
| Company | Automation Portfolio | Turbine Integration | Service Network | Geographic Reach |
|---|---|---|---|---|
| GE Renewable Energy | High | High | Strong | Global |
| Siemens Gamesa Renewable Energy S.A. | High | High | Strong | Global |
| ABB Ltd. | Medium | High | Moderate | Regional |
| Schneider Electric | Medium | Medium | Moderate | Regional |
| Mitsubishi Electric Corporation | Medium | Medium | Moderate | Regional |
| Rockwell Automation | Low | Medium | Moderate | Regional |
| Honeywell International Inc. | Low | Low | Low | Niche |
| Emerson Electric Co. | Low | Low | Low | Niche |
| Nordex SE | Low | Low | Low | Niche |
| Vestas Wind Systems A/S | Low | Low | Low | Niche |
Source: Future Market Insights competitive analysis, 2026.
Key Players in the Wind Turbine Automation Market
Major Global Players
- GE Renewable Energy
- Siemens Gamesa Renewable Energy S.A.
- ABB Ltd.
- Schneider Electric
- Mitsubishi Electric Corporation
- Rockwell Automation
- Honeywell International Inc.
Emerging Players/Startups
- Emerson Electric Co.
- Nordex SE
- Vestas Wind Systems A/S
Report Scope and Coverage
| Parameter | Details |
|---|---|
| Quantitative Units | USD 21.87 billion to USD 58.30 billion, at a CAGR of 10.3% |
| Market Definition | The wind turbine automation market covers SCADA, condition monitoring, and control systems for wind turbine operations across onshore and offshore installations. |
| Regions Covered | North America, Latin America, Europe, East Asia, South Asia and Pacific, Middle East and Africa |
| Countries Covered | USA, Germany, France, China, India, 30 plus countries |
| Key Companies Profiled | GE Renewable Energy, Siemens Gamesa Renewable Energy S.A., ABB Ltd., Schneider Electric, Mitsubishi Electric Corporation, Rockwell Automation, Honeywell International Inc., Emerson Electric Co., Nordex SE, Vestas Wind Systems A/S |
| Forecast Period | 2026 to 2036 |
| Approach | Hybrid bottom up and top down methodology starting with verified transaction data, projecting adoption velocity across segments and regions. |
Segmentation
Wind Turbine Automation Market Segmented by System:
- SCADA Systems
- Programmable Logic Controllers (PLC) Systems
- Distributed Control Systems (DCS)
- Condition Monitoring Systems (CMS)
- Others
Wind Turbine Automation Market Segmented by Component:
- Hardware
- Software
- Services
Wind Turbine Automation Market Segmented by Application:
- Onshore Wind Power Generation
- Offshore Wind Power Generation
Wind Turbine Automation Market Segmented by End Use:
- Energy and Utilities
- Independent Power Producers
- Renewable Energy Developers
Wind Turbine Automation Market by Region:
- North America
- USA
- Canada
- Mexico
- Latin America
- Brazil
- Chile
- Rest of Latin America
- Western Europe
- Germany
- UK
- Italy
- Spain
- France
- Nordic
- BENELUX
- Rest of Western Europe
- Eastern Europe
- Russia
- Poland
- Hungary
- Balkan & Baltic
- Rest of Eastern Europe
- East Asia
- China
- Japan
- South Korea
- South Asia and Pacific
- India
- ASEAN
- Australia & New Zealand
- Rest of South Asia and Pacific
- Middle East & Africa
- Kingdom of Saudi Arabia
- Other GCC Countries
- Turkiye
- South Africa
- Other African Union
- Rest of Middle East & Africa
Research Sources and Bibliography
- 1. International Renewable Energy Agency. (2025). IRENA Renewable Energy Statistics Report. IRENA.
- 2. Global Wind Energy Council. (2025). GWEC Global Wind Report. GWEC.
- 3. USA Department of Energy. (2025). DOE Wind Energy Technologies Office Annual Report. DOE.
- 4. European Wind Energy Association. (2025). WindEurope Annual Statistics. WindEurope.
- 5. International Energy Agency. (2025). IEA Wind Energy Outlook. IEA.
This bibliography is provided for reader reference. The full Future Market Insights report contains the complete reference list with publication dates, URLs, and supporting data for all cited works.
This Report Answers
- Estimating the size of the market and revenue projections from 2026 to 2036.
- Segmentation analysis across system, component, application, end use.
- Regional and country level insights covering more than 30 markets.
- Competitive landscape assessment including company positioning, benchmarking, and key developments.
- Identification of growth drivers, restraints, and strategic opportunities across segments.
- Investment opportunity assessment across high growth segments and geographies.
- Supply chain and distribution channel analysis.
- Data delivery in PDF and Excel formats.
Frequently Asked Questions
What is the global market demand for Wind Turbine Automation Market in 2026?
In 2026, the global wind turbine automation market is expected to be worth USD 21.87 billion.
How big will the Wind Turbine Automation Market be in 2036?
By 2036, the wind turbine automation market is expected to be worth USD 58.30 billion.
How much is demand expected to grow between 2026 and 2036?
Between 2026 and 2036, demand is expected to grow at a CAGR of 10.3%.
Which system segment leads in 2026?
SCADA systems are expected to hold 61.1% of the system segment in 2026, reflecting their central role in wind farm supervisory control and performance optimization.
What is causing demand to rise in the USA?
The USA is expected to grow at 12.3% through 2036, driven by federal renewable energy incentives, onshore capacity expansion, and offshore wind project development.
What is causing demand to rise in Germany?
Germany is expected to grow at 11.0% through 2036, reflecting its mature wind sector, repowering activity, and advanced automation adoption.
What does this report mean by 'Wind Turbine Automation Market definition'?
The wind turbine automation market covers SCADA, condition monitoring, and control systems for wind turbine operations across onshore and offshore installations.
How does FMI validate the forecast?
Forecasting models use a hybrid bottom up and top down approach, starting with verified transaction data and validating against installed capacity statistics and operator procurement data.
Preview the report firsthand - request a free sample
Get SampleGet the brochure for pricing and purchase details.
Get PDFTable of Content
- Executive Summary
- Global Market Outlook
- Demand-side Trends
- Supply-side Trends
- Technology Roadmap Analysis
- Analysis and Recommendations
- Market Overview
- Market Coverage / Taxonomy
- Market Definition / Scope / Limitations
- Research Methodology
- Chapter Orientation
- Analytical Lens and Working Hypotheses
- Market Structure, Signals, and Trend Drivers
- Benchmarking and Cross-market Comparability
- Market Sizing, Forecasting, and Opportunity Mapping
- Research Design and Evidence Framework
- Desk Research Programme (Secondary Evidence)
- Company Annual and Sustainability Reports
- Peer-reviewed Journals and Academic Literature
- Corporate Websites, Product Literature, and Technical Notes
- Earnings Decks and Investor Briefings
- Statutory Filings and Regulatory Disclosures
- Technical White Papers and Standards Notes
- Trade Journals, Industry Magazines, and Analyst Briefs
- Conference Proceedings, Webinars, and Seminar Materials
- Government Statistics Portals and Public Data Releases
- Press Releases and Reputable Media Coverage
- Specialist Newsletters and Curated Briefings
- Sector Databases and Reference Repositories
- FMI Internal Proprietary Databases and Historical Market Datasets
- Subscription Datasets and Paid Sources
- Social Channels, Communities, and Digital Listening Inputs
- Additional Desk Sources
- Expert Input and Fieldwork (Primary Evidence)
- Primary Modes
- Qualitative Interviews and Expert Elicitation
- Quantitative Surveys and Structured Data Capture
- Blended Approach
- Why Primary Evidence is Used
- Field Techniques
- Interviews
- Surveys
- Presidents and Vice Presidents
- R&D and Innovation Heads
- Technical Specialists
- Domain Subject-matter Experts
- Scientists
- Physicians and Other Healthcare Professionals
- Governance, Ethics, and Data Stewardship
- Research Ethics
- Data Integrity and Handling
- Primary Modes
- Tooling, Models, and Reference Databases
- Desk Research Programme (Secondary Evidence)
- Data Engineering and Model Build
- Data Acquisition and Ingestion
- Cleaning, Normalisation, and Verification
- Synthesis, Triangulation, and Analysis
- Quality Assurance and Audit Trail
- Market Background
- Market Dynamics
- Drivers
- Restraints
- Opportunity
- Trends
- Scenario Forecast
- Demand in Optimistic Scenario
- Demand in Likely Scenario
- Demand in Conservative Scenario
- Opportunity Map Analysis
- Product Life Cycle Analysis
- Supply Chain Analysis
- Investment Feasibility Matrix
- Value Chain Analysis
- PESTLE and Porter’s Analysis
- Regulatory Landscape
- Regional Parent Market Outlook
- Production and Consumption Statistics
- Import and Export Statistics
- Market Dynamics
- Global Market Analysis 2021 to 2025 and Forecast, 2026 to 2036
- Historical Market Size Value (USD Million) Analysis, 2021 to 2025
- Current and Future Market Size Value (USD Million) Projections, 2026 to 2036
- Y-o-Y Growth Trend Analysis
- Absolute $ Opportunity Analysis
- Global Market Pricing Analysis 2021 to 2025 and Forecast 2026 to 2036
- Global Market Analysis 2021 to 2025 and Forecast 2026 to 2036, By System
- Introduction / Key Findings
- Historical Market Size Value (USD Million) Analysis By System, 2021 to 2025
- Current and Future Market Size Value (USD Million) Analysis and Forecast By System, 2026 to 2036
- SCADA Systems
- Programmable Logic Controllers (PLC) Systems
- Distributed Control Systems (DCS)
- Condition Monitoring Systems (CMS)
- Others
- SCADA Systems
- Y-o-Y Growth Trend Analysis By System, 2021 to 2025
- Absolute $ Opportunity Analysis By System, 2026 to 2036
- Global Market Analysis 2021 to 2025 and Forecast 2026 to 2036, By Component
- Introduction / Key Findings
- Historical Market Size Value (USD Million) Analysis By Component, 2021 to 2025
- Current and Future Market Size Value (USD Million) Analysis and Forecast By Component, 2026 to 2036
- Hardware
- Software
- Services
- Hardware
- Y-o-Y Growth Trend Analysis By Component, 2021 to 2025
- Absolute $ Opportunity Analysis By Component, 2026 to 2036
- Global Market Analysis 2021 to 2025 and Forecast 2026 to 2036, By Application
- Introduction / Key Findings
- Historical Market Size Value (USD Million) Analysis By Application, 2021 to 2025
- Current and Future Market Size Value (USD Million) Analysis and Forecast By Application, 2026 to 2036
- Onshore Wind Power Generation
- Offshore Wind Power Generation
- Onshore Wind Power Generation
- Y-o-Y Growth Trend Analysis By Application, 2021 to 2025
- Absolute $ Opportunity Analysis By Application, 2026 to 2036
- Global Market Analysis 2021 to 2025 and Forecast 2026 to 2036, By End Use
- Introduction / Key Findings
- Historical Market Size Value (USD Million) Analysis By End Use, 2021 to 2025
- Current and Future Market Size Value (USD Million) Analysis and Forecast By End Use, 2026 to 2036
- Energy and Utilities
- Independent Power Producers
- Renewable Energy Developers
- Energy and Utilities
- Y-o-Y Growth Trend Analysis By End Use, 2021 to 2025
- Absolute $ Opportunity Analysis By End Use, 2026 to 2036
- Global Market Analysis 2021 to 2025 and Forecast 2026 to 2036, By Region
- Introduction
- Historical Market Size Value (USD Million) Analysis By Region, 2021 to 2025
- Current Market Size Value (USD Million) Analysis and Forecast By Region, 2026 to 2036
- North America
- Latin America
- Western Europe
- Eastern Europe
- East Asia
- South Asia and Pacific
- Middle East & Africa
- Market Attractiveness Analysis By Region
- North America Market Analysis 2021 to 2025 and Forecast 2026 to 2036, By Country
- Historical Market Size Value (USD Million) Trend Analysis By Market Taxonomy, 2021 to 2025
- Market Size Value (USD Million) Forecast By Market Taxonomy, 2026 to 2036
- By Country
- USA
- Canada
- Mexico
- By System
- By Component
- By Application
- By End Use
- By Country
- Market Attractiveness Analysis
- By Country
- By System
- By Component
- By Application
- By End Use
- Key Takeaways
- Latin America Market Analysis 2021 to 2025 and Forecast 2026 to 2036, By Country
- Historical Market Size Value (USD Million) Trend Analysis By Market Taxonomy, 2021 to 2025
- Market Size Value (USD Million) Forecast By Market Taxonomy, 2026 to 2036
- By Country
- Brazil
- Chile
- Rest of Latin America
- By System
- By Component
- By Application
- By End Use
- By Country
- Market Attractiveness Analysis
- By Country
- By System
- By Component
- By Application
- By End Use
- Key Takeaways
- Western Europe Market Analysis 2021 to 2025 and Forecast 2026 to 2036, By Country
- Historical Market Size Value (USD Million) Trend Analysis By Market Taxonomy, 2021 to 2025
- Market Size Value (USD Million) Forecast By Market Taxonomy, 2026 to 2036
- By Country
- Germany
- UK
- Italy
- Spain
- France
- Nordic
- BENELUX
- Rest of Western Europe
- By System
- By Component
- By Application
- By End Use
- By Country
- Market Attractiveness Analysis
- By Country
- By System
- By Component
- By Application
- By End Use
- Key Takeaways
- Eastern Europe Market Analysis 2021 to 2025 and Forecast 2026 to 2036, By Country
- Historical Market Size Value (USD Million) Trend Analysis By Market Taxonomy, 2021 to 2025
- Market Size Value (USD Million) Forecast By Market Taxonomy, 2026 to 2036
- By Country
- Russia
- Poland
- Hungary
- Balkan & Baltic
- Rest of Eastern Europe
- By System
- By Component
- By Application
- By End Use
- By Country
- Market Attractiveness Analysis
- By Country
- By System
- By Component
- By Application
- By End Use
- Key Takeaways
- East Asia Market Analysis 2021 to 2025 and Forecast 2026 to 2036, By Country
- Historical Market Size Value (USD Million) Trend Analysis By Market Taxonomy, 2021 to 2025
- Market Size Value (USD Million) Forecast By Market Taxonomy, 2026 to 2036
- By Country
- China
- Japan
- South Korea
- By System
- By Component
- By Application
- By End Use
- By Country
- Market Attractiveness Analysis
- By Country
- By System
- By Component
- By Application
- By End Use
- Key Takeaways
- South Asia and Pacific Market Analysis 2021 to 2025 and Forecast 2026 to 2036, By Country
- Historical Market Size Value (USD Million) Trend Analysis By Market Taxonomy, 2021 to 2025
- Market Size Value (USD Million) Forecast By Market Taxonomy, 2026 to 2036
- By Country
- India
- ASEAN
- Australia & New Zealand
- Rest of South Asia and Pacific
- By System
- By Component
- By Application
- By End Use
- By Country
- Market Attractiveness Analysis
- By Country
- By System
- By Component
- By Application
- By End Use
- Key Takeaways
- Middle East & Africa Market Analysis 2021 to 2025 and Forecast 2026 to 2036, By Country
- Historical Market Size Value (USD Million) Trend Analysis By Market Taxonomy, 2021 to 2025
- Market Size Value (USD Million) Forecast By Market Taxonomy, 2026 to 2036
- By Country
- Kingdom of Saudi Arabia
- Other GCC Countries
- Turkiye
- South Africa
- Other African Union
- Rest of Middle East & Africa
- By System
- By Component
- By Application
- By End Use
- By Country
- Market Attractiveness Analysis
- By Country
- By System
- By Component
- By Application
- By End Use
- Key Takeaways
- Key Countries Market Analysis
- USA
- Pricing Analysis
- Market Share Analysis, 2025
- By System
- By Component
- By Application
- By End Use
- Canada
- Pricing Analysis
- Market Share Analysis, 2025
- By System
- By Component
- By Application
- By End Use
- Mexico
- Pricing Analysis
- Market Share Analysis, 2025
- By System
- By Component
- By Application
- By End Use
- Brazil
- Pricing Analysis
- Market Share Analysis, 2025
- By System
- By Component
- By Application
- By End Use
- Chile
- Pricing Analysis
- Market Share Analysis, 2025
- By System
- By Component
- By Application
- By End Use
- Germany
- Pricing Analysis
- Market Share Analysis, 2025
- By System
- By Component
- By Application
- By End Use
- UK
- Pricing Analysis
- Market Share Analysis, 2025
- By System
- By Component
- By Application
- By End Use
- Italy
- Pricing Analysis
- Market Share Analysis, 2025
- By System
- By Component
- By Application
- By End Use
- Spain
- Pricing Analysis
- Market Share Analysis, 2025
- By System
- By Component
- By Application
- By End Use
- France
- Pricing Analysis
- Market Share Analysis, 2025
- By System
- By Component
- By Application
- By End Use
- India
- Pricing Analysis
- Market Share Analysis, 2025
- By System
- By Component
- By Application
- By End Use
- ASEAN
- Pricing Analysis
- Market Share Analysis, 2025
- By System
- By Component
- By Application
- By End Use
- Australia & New Zealand
- Pricing Analysis
- Market Share Analysis, 2025
- By System
- By Component
- By Application
- By End Use
- China
- Pricing Analysis
- Market Share Analysis, 2025
- By System
- By Component
- By Application
- By End Use
- Japan
- Pricing Analysis
- Market Share Analysis, 2025
- By System
- By Component
- By Application
- By End Use
- South Korea
- Pricing Analysis
- Market Share Analysis, 2025
- By System
- By Component
- By Application
- By End Use
- Russia
- Pricing Analysis
- Market Share Analysis, 2025
- By System
- By Component
- By Application
- By End Use
- Poland
- Pricing Analysis
- Market Share Analysis, 2025
- By System
- By Component
- By Application
- By End Use
- Hungary
- Pricing Analysis
- Market Share Analysis, 2025
- By System
- By Component
- By Application
- By End Use
- Kingdom of Saudi Arabia
- Pricing Analysis
- Market Share Analysis, 2025
- By System
- By Component
- By Application
- By End Use
- Turkiye
- Pricing Analysis
- Market Share Analysis, 2025
- By System
- By Component
- By Application
- By End Use
- South Africa
- Pricing Analysis
- Market Share Analysis, 2025
- By System
- By Component
- By Application
- By End Use
- USA
- Market Structure Analysis
- Competition Dashboard
- Competition Benchmarking
- Market Share Analysis of Top Players
- By Regional
- By System
- By Component
- By Application
- By End Use
- Competition Analysis
- Competition Deep Dive
- GE Renewable Energy
- Overview
- Product Portfolio
- Profitability by Market Segments (Product/Age /Sales Channel/Region)
- Sales Footprint
- Strategy Overview
- Marketing Strategy
- Product Strategy
- Channel Strategy
- Siemens Gamesa Renewable Energy S.A.
- ABB Ltd.
- Schneider Electric
- Mitsubishi Electric Corporation
- Rockwell Automation
- Honeywell International Inc.
- Emerson Electric Co.
- Nordex SE
- Vestas Wind Systems A/S
- GE Renewable Energy
- Competition Deep Dive
- Assumptions & Acronyms Used


