

- Market Size (2026)
- USD 142.2 Bn
- Forecast (2036)
- USD 756.8 Bn
- CAGR (2026 to 2036)
- 18.2%
How big is the mobile application store market in 2026?
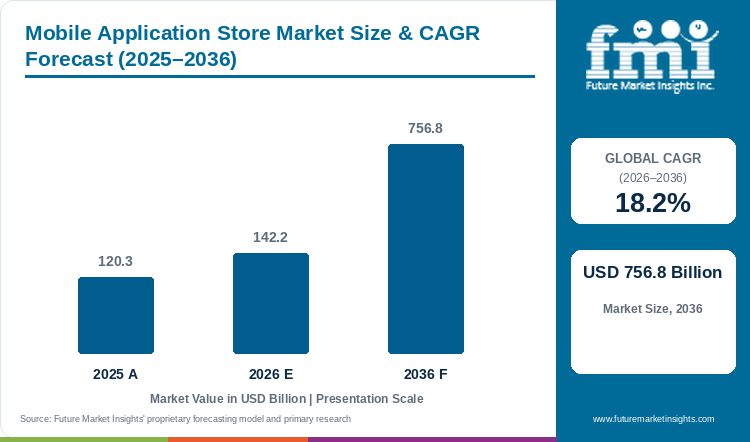
Demand is projected to expand at 18.2% CAGR from 2026 to 2036. Market value rises from USD 120.3 billion in 2025 to USD 142.19 billion in 2026 and USD 756.82 billion by 2036. [1]
The mobile application store market is estimated at USD 142.19 billion in 2026 and is projected to reach USD 756.82 billion by 2036, with a CAGR of 18.2% from 2026 to 2036. [1] A store’s commercial role extends from helping a user find an application to distributing updates, explaining purchase terms and supporting the relationship between the user and developer. This makes platform reach important, but it also places value on publishing tools, dependable payment handling and the trust that allows a customer to install unfamiliar software. Apple describes review and purchase disclosure within its store, while Google’s subscription policy addresses misleading offers and the information users need before subscribing. [2][3] Device-linked stores such as Samsung Galaxy Store and Huawei AppGallery provide additional distribution routes within their respective ecosystems. [4][5] Gaming remains a substantial application category, although demand also comes from communication, productivity and fitness apps that rely on recurring use rather than a single download. Developers therefore evaluate revenue opportunities alongside distribution access and platform rules, while buyers judge the clarity and usefulness of the service received. [1]
Key Market Trends and Insights
- Application distribution increasingly connects discovery with recurring payment and update relationships, making user trust and clear subscription information relevant to platform revenue. [1][2][3]
- Device-specific storefronts provide additional routes to users, although developers still need to consider publishing requirements and the practical reach of each ecosystem. [4][5]
- Games, productivity tools and fitness services monetize different forms of repeat use, so download activity alone does not describe the store’s commercial contribution. [1][3]
Regional Highlights
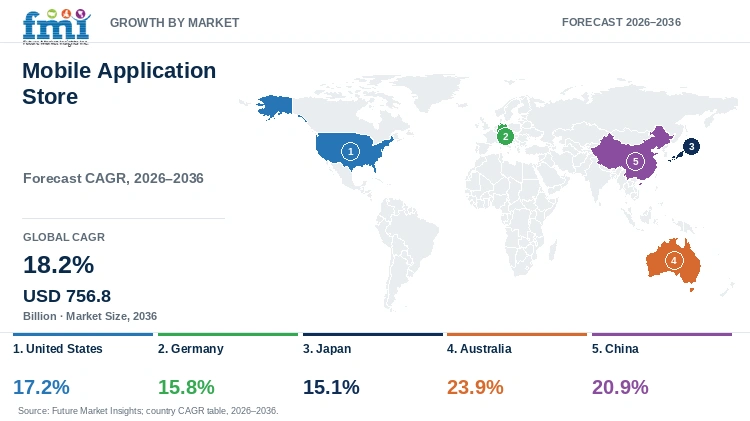
- The United States and Germany are projected at 17.2% and 15.8% CAGR from 2026 to 2036, with established digital purchasing supporting application revenue. [1]
- Japan is projected at 15.1% CAGR, while application categories such as gaming create distinct expectations for content, updates and repeat purchasing. [1]
- Australia and China are projected at 23.9% and 20.9% CAGR respectively, reflecting different device ecosystems and routes to application distribution. [1][4][5]
Market Size and Forecast
Table 1: Value outlook for the mobile application store market
| Metric | Value |
|---|---|
| 2025 market value | USD 120.3 billion [1] |
| 2026 market value | USD 142.19 billion [1] |
| 2036 market value | USD 756.82 billion [1] |
| CAGR 2026 to 2036 | 18.2% [1] |
| Revenue increase 2026 to 2036 | USD 614.63 billion [1] |
| Market expansion 2026 to 2036 | 5.32 times [1] |
The forecast reflects an expansion of paid application relationships, including subscriptions and in-app purchases, rather than equating every installation with revenue. Stores can support developers through publishing and payment tools, while users need clear descriptions of what a charge provides and when it renews. The connection with Web3 gaming is relevant where games introduce new ownership or payment arrangements, although those features still need to fit the distribution platform’s requirements and provide an understandable experience for the user. [1][2][3]
What distribution and payment evidence shapes application stores?
An application store sits between a developer and user throughout discovery, installation, payment and updates, so commercial performance depends on more than the number of applications listed. Platform documentation identifies different publishing and subscription requirements, while device-specific stores show how distribution follows the hardware ecosystem as well as the developer’s content or service model. [2][3][4][5]
Table 2: Industry evidence relevant to the mobile application store market
| Indicator | Data point or observation | Market relevance | Source |
|---|---|---|---|
| User disclosure | Apple describes review, price and subscription information | Trust depends on understandable purchase terms and safe distribution | [2] |
| Subscription policy | Google prohibits misleading subscription offers | Developers need clarity around recurring charges and service access | [3] |
| Device ecosystems | Samsung and Huawei operate their own storefronts | Distribution access varies with device and platform relationships | [4][5] |
Analyst Perspective
"The mobile application store market is shifting toward platform ecosystems where discovery, payment flows, and user trust decide revenue scale. Developers still need useful applications and understandable subscription terms, because access to a large distribution channel only creates an opportunity when users can discover, trust and continue using the product." [1]
- Sudip Saha, Co-founder, Future Market Insights
How is the mobile application store market segmented?
The market is segmented by Store Type, Application, and Region.
The market is segmented by Store Type, Application, and Region. By store type, coverage includes Google Play Store, Apple Store, Other Stores. By application, coverage includes Gaming, Music & Entertainment, Health & Fitness, Productivity, Communication, Security, Other Applications. [1]
Why does the Google Play Store segment lead demand within the store type category?
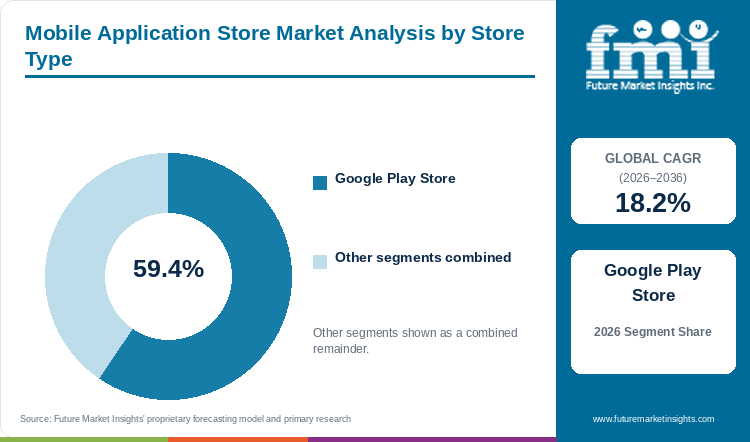
The Google Play Store segment accounts for 59.4% of store type demand in 2026. [1]
The Google Play Store segment is projected to represent 59.4% of store type demand in 2026 because Android distribution gives developers access to a broad device ecosystem through a familiar storefront. A developer can combine discovery, updates and payment functions within that environment, although commercial success still depends on the application’s usefulness and ability to retain users. [1] Google’s subscription policy shows that recurring revenue also requires clear terms and non-misleading offers, making payment design and user communication part of platform participation. [3] The share reflects the reach of this distribution route rather than proving that every Android application earns comparable revenue, while competing device-linked stores create additional options that developers may assess according to audience and operating requirements. [4][5]
- The Google Play Store segment is estimated to represent 59.4% of store type demand in 2026, because Android distribution provides a broad route from developer publishing to device users. [1][3]
- Store participation requires developers to understand payment and subscription rules alongside the tools used to publish, update and distribute their applications. [3]
Table 3: Leading store type share in 2026
| Segment | Share of demand |
|---|---|
| Google Play Store | 59.4% [1] |
| Other store type segments | 40.6% [1] |
| Total | 100.0% |
Why does the Gaming segment lead demand within the application category?
The Gaming segment accounts for 41.8% of application demand in 2026. [1]
The Gaming segment is estimated to account for 41.8% of application demand in 2026 because games can combine an initial download with continued content, optional purchases and subscriptions that support repeat use. This creates a relationship between discovery and ongoing engagement, while the store provides the distribution and payment environment through which those offerings reach a user. [1] The commercial opportunity needs clear communication about what a purchase includes, because a game’s appeal does not remove the platform’s expectations for understandable charges and recurring terms. Apple and Google describe these disclosure and subscription requirements, making payment clarity relevant to retention as well as compliance with store policies. Developers consequently need to balance content updates with a purchasing experience that users can follow. [2][3]
- The Gaming segment is estimated to represent 41.8% of application demand in 2026, as repeat content and optional purchasing create continuing commercial relationships beyond the initial download. [1]
- Gaming purchases need clear descriptions of access and charges, particularly where recurring subscriptions or in-app content extend the relationship after installation. [2][3]
What are the drivers, restraints, and opportunities in the mobile application store market?
Driver
The growth of application-based services supports store demand because users need a practical route to discover, install and maintain software on their devices. Revenue can extend through subscriptions and in-app purchases when an application remains useful, while platform payment and update tools help developers manage this continuing relationship. Apple and Google’s documentation show how trust and purchase disclosure sit within distribution, making clear communication relevant to demand as well as the breadth of the application catalogue. [1][2][3]
Restraint
Platform requirements and the difficulty of reaching a paying audience can limit developer returns even when an application is readily available for download. Publishing access does not guarantee discovery or retention, while unclear subscription terms can damage trust and conflict with store policy. Google and Apple set expectations for recurring offers and purchase information, so developers need to manage the service experience and payment presentation together rather than relying on installation growth alone. [1][2][3]
Opportunity
Developers and stores can expand value through applications that solve a recurring task well enough to justify repeat use, supported by clear purchasing and straightforward updates. Device-specific distribution can also help a developer reach a defined ecosystem, as illustrated by Samsung Galaxy Store and Huawei AppGallery. [4][5] The relationship with digital journal apps shows how a non-gaming service may build continuing engagement through useful personal workflows, while the store’s role remains distribution, payment and trusted access. [1][2][3]
Which country CAGRs are profiled in the mobile application store market?
Table 4: Country CAGR comparison for the mobile application store market
| Country or market | CAGR 2026 to 2036 |
|---|---|
| United States | 17.2% [1] |
| Germany | 15.8% [1] |
| Japan | 15.1% [1] |
| Australia | 23.9% [1] |
| China | 20.9% [1] |
Country-wise Analysis
United States
The United States brings established application development and digital purchasing into the same market, making user retention and payment clarity central to the commercial role of stores. Developers can distribute services across a broad smartphone audience, but a download still needs to become repeat use or a purchase before it supports revenue. The projected 17.2% CAGR from 2026 to 2036 reflects continued growth in this application relationship. [1] Apple and Google’s documentation illustrates why users need to understand charges and subscription terms, while developers need publishing and update arrangements that keep the service dependable after installation. A store’s value therefore combines access with trust and the ability to maintain a continuing user relationship. [2][3]
Germany
German application demand spans entertainment and practical digital services, so a developer’s purchasing model needs to match the value users receive rather than simply copy a successful game’s payment structure. An application intended for sales coaching or regular work may depend on a subscription, while a game can combine content updates with optional purchases. Germany is projected at a CAGR of 15.8% from 2026 to 2036, with stores continuing to connect distribution and payment within device ecosystems. [1] Published Apple and Google requirements support clear pricing and recurring terms, making understandable offers important to adoption. Developers can compare platform access and payment arrangements while keeping the application’s actual purpose central to the user experience. [2][3]
Japan
Japan’s application market gives gaming a prominent commercial role, while other categories create their own expectations for usefulness, continuity and purchasing. A developer must consider how an update or optional purchase fits the user’s ongoing experience, because frequent content alone does not establish a dependable service relationship. Japan is projected to record a CAGR of 15.1% from 2026 to 2036, reflecting continued demand for application distribution and monetization. [1] Store policies remain relevant to the way charges and subscriptions are explained, while device-specific routes can be assessed according to the intended audience. Apple and Google’s public information provides a reference for clear purchase communication across different content and service models. [2][3]
Australia
Australia’s projected 23.9% CAGR from 2026 to 2036 places the market among the faster-growing profiles, with stores connecting mobile services to users who access entertainment and practical applications through their devices. [1] Commercial growth depends on converting access into a useful continuing relationship, whether through a subscription, optional content or a paid application. Developers therefore need to consider onboarding, updates and purchasing clarity alongside the reach of a storefront, particularly when a service competes for regular attention. Apple and Google’s requirements illustrate the importance of explaining recurring charges, while Samsung and Huawei provide additional device-linked distribution examples that can be evaluated against the developer’s intended audience and platform support. [2][3][4][5]
China
China’s application distribution environment includes device-linked ecosystems that influence how developers reach users and maintain software, making platform selection a practical part of the commercial model. Huawei AppGallery illustrates a storefront connected to its wider mobile services, while other distribution routes serve different devices and audiences. [5] The market is projected at a CAGR of 20.9% from 2026 to 2036, with application demand spanning gaming and other recurring mobile tasks. [1] A developer needs to assess publishing support, updates and payment handling within the chosen ecosystem, while users need an understandable purchase and dependable access to the service. These requirements connect platform reach with the quality of the continuing application relationship rather than treating availability alone as commercial success.
Who are the notable companies in the mobile application store market?
Google Play; Apple App Store; Samsung Galaxy Store; Huawei AppGallery; Amazon Appstore
Competitive Benchmarking
Application store competition follows device ecosystems as well as publishing, discovery and payment functions, making a developer’s target audience central to platform selection. Google Play and Apple App Store provide broad distribution environments, while Samsung Galaxy Store and Huawei AppGallery serve their respective device relationships. [2][3][4][5] Amazon Appstore remains relevant to the Fire ecosystem, creating a different route from ordinary Android distribution. The comparison should therefore consider supported devices, publishing access and user purchasing arrangements rather than treating each storefront as an identical channel. [1]
Table 5: Competitive positioning for the mobile application store market
| Company | Positioning | Evidence or purchasing distinction |
|---|---|---|
| Google Play | Android application distribution | Subscriptions and payment policy [3] |
| Apple App Store | iOS application distribution | App review, privacy and purchase disclosure [2] |
| Samsung Galaxy Store | Samsung device application ecosystem | Device-specific storefront [4] |
| Huawei AppGallery | Huawei application distribution | Mobile application ecosystem [5] |
| Amazon Appstore | Fire-device application distribution | Fire ecosystem storefront [1] |
Key Developments in the Mobile Application Store Market
- Google’s current subscription policy requires developers to avoid misleading offers and provide clear information about recurring services, reinforcing the connection between monetization and user trust. [3]
- Apple’s current App Store information describes review, privacy and purchase disclosure as parts of the distribution environment, showing why store value extends beyond application discovery. [2]
- Samsung Galaxy Store and Huawei AppGallery continue to provide device-linked application distribution, giving developers additional ecosystem routes to assess alongside publishing and payment requirements. [4][5]
Key Players in the Mobile Application Store Market
- Google Play
- Apple App Store
- Samsung Galaxy Store
- Huawei AppGallery
- Amazon Appstore
Mobile Application Store Market Report Scope
Table 6: Report coverage for the mobile application store market
| Attribute | Coverage |
|---|---|
| Market | Mobile Application Store Market |
| Base year | 2026 |
| Historical reference | 2025 |
| Forecast period | 2026 to 2036 |
| Currency and units | USD billion |
| Segmentation | Store Type, Application |
| Geographic coverage | North America, Latin America, Western Europe, Eastern Europe, East Asia, South Asia & Pacific, Middle East & Africa |
| Country and market profiles | United States, Germany, Japan, Australia, China |
| Competitive coverage | Google Play, Apple App Store, Samsung Galaxy Store, Huawei AppGallery, Amazon Appstore |
Mobile Application Store Market Research Methodology
Table 7: Research methods for the mobile application store market
| Method | Approach |
|---|---|
| Market definition | The market covers application store revenue associated with distribution, paid applications, subscriptions and in-app purchasing, excluding standalone device sales. |
| Desk research | Published market outlooks, official technical documentation, institutional publications and company disclosures inform the assessment. |
| Segment assessment | Product, deployment and buyer categories are distinguished according to the role each plays in the defined market. |
| Country assessment | Local procurement conditions and service requirements are assessed alongside the country and market growth outlook. |
| Competitive comparison | Product portfolios, service roles and operating requirements inform the assessment of representative companies. |
| Forecast assessment | The 2026 base and 2036 outlook reflect demand drivers, adoption constraints and the market coverage specified in this report. |
Mobile Application Store Market by Segments
Mobile Application Store Market segmented by Store Type:
- Google Play Store
- Apple Store
- Other Stores
Mobile Application Store Market segmented by Application:
- Gaming
- Music & Entertainment
- Health & Fitness
- Productivity
- Communication
- Security
- Other Applications
Mobile Application Store Market by Region
- North America
- United States
- Canada
- Latin America
- Brazil
- Mexico
- Argentina
- Chile
- Western Europe
- Germany
- France
- United Kingdom
- Italy
- Spain
- Benelux
- Nordics
- Eastern Europe
- Poland
- Czech Republic
- Romania
- Hungary
- East Asia
- China
- Japan
- South Korea
- South Asia and Pacific
- India
- ASEAN
- Australia and New Zealand
- Middle East and Africa
- GCC Countries
- South Africa
- Türkiye
- Israel
Research Sources and Bibliography
- [1] Future Market Insights. Accessed 14 October 2026. Mobile Application Store Market
- [2] Apple. Accessed 14 October 2026. App Store
- [3] Google. Accessed 14 October 2026. Subscriptions: Play Console Help
- [4] Samsung. Accessed 14 October 2026. Galaxy Store
- [5] Huawei. Accessed 14 October 2026. AppGallery
This Report Answers
- How big is the mobile application store market in 2026?
- What is the forecast for the mobile application store market?
- Which segment has the largest profiled share?
- Which countries and markets are profiled?
- Which companies are covered?
Frequently Asked Questions
How big is the mobile application store market in 2026?
The market is estimated at USD 142.19 billion in 2026, compared with USD 120.30 billion in 2025. [1]
What is the forecast for the mobile application store market?
Market value is projected to reach USD 756.82 billion by 2036, with a CAGR of 18.2% from 2026 to 2036. [1]
Which segment has the largest profiled share?
The Google Play Store segment holds a projected 59.4% share of the store type segment in 2026, while the Gaming segment represents 41.8% of the application segment. [1]
Which countries and markets are profiled?
The analysis profiles United States, Germany, Japan, Australia, China, with each growth rate stated for 2026 to 2036. [1]
Which companies are covered?
Representative participants include Google Play, Apple App Store, Samsung Galaxy Store, Huawei AppGallery, Amazon Appstore, whose differing commercial roles are described in the company comparisons. [1]
Preview the report firsthand - request a free sample
Get SampleGet the brochure for pricing and purchase details.
Get PDFTable of Content
- Key Takeaways
- Market Size and CAGR
- Top Growth Driver
- Fastest Growing Segment
- Leading Region
- Key Companies
- Emerging Opportunities
- Executive Summary
- Global Market Outlook
- Demand-side Trends
- Supply-side Trends
- Technology Roadmap Analysis
- Analysis and Recommendations
- Analyst Perspective (What is happening? Why now? What should investors know?)
- Key Questions Answered
- How large is the market?
- What is the CAGR?
- What are key trends?
- Which region dominates?
- Who are the leaders?
- Market Overview
- Market Coverage / Taxonomy
- Market Definition / Scope / Limitations
- Research Methodology
- Chapter Orientation
- Analytical Lens and Working Hypotheses
- Market Structure, Signals, and Trend Drivers
- Benchmarking and Cross-market Comparability
- Market Sizing, Forecasting, and Opportunity Mapping
- Research Design and Evidence Framework
- Desk Research Programme (Secondary Evidence)
- Expert Input and Fieldwork (Primary Evidence)
- Tooling, Models, and Reference Databases
- Data Engineering and Model Build
- Quality Assurance and Audit Trail
- Market Background
- Market Dynamics (Drivers, Restraints, Opportunity, Trends)
- Scenario Forecast (Optimistic, Likely, Conservative)
- Impact Analysis
- AI Impact
- Sustainability Impact
- Regulatory Impact
- Technology Impact
- Consumer / Buyer Analysis
- Purchase Drivers
- Adoption Barriers
- Buyer Journey
- Opportunity Map Analysis
- Product Life Cycle Analysis
- Supply Chain Analysis
- Investment Feasibility Matrix
- Value Chain Analysis
- PESTLE and Porter's Analysis
- Regulatory Landscape
- Regional Parent Market Outlook
- Production and Consumption Statistics
- Import and Export Statistics
- Global Market Analysis and Forecast, 2021 to 2036
- Historical Market Size Value (USD Billion) Analysis, 2021 to 2025
- Current and Future Market Size Value (USD Billion) Projections, 2026 to 2036
- Y-o-Y Growth Trend Analysis
- Absolute $ Opportunity Analysis
- Global Market Pricing Analysis, 2021 to 2036
- Global Market Analysis and Forecast, By Store Type, 2021 to 2036
- Introduction / Key Findings
- Historical Market Size Value (USD Billion) Analysis By Store Type, 2021 to 2025
- Current and Future Market Size Value (USD Billion) Analysis and Forecast By Store Type, 2026 to 2036
- Google Play Store
- Apple Store
- Other Stores
- Y-o-Y Growth Trend Analysis By Store Type, 2021 to 2025
- Absolute $ Opportunity Analysis By Store Type, 2026 to 2036
- Global Market Analysis and Forecast, By Application, 2021 to 2036
- Introduction / Key Findings
- Historical Market Size Value (USD Billion) Analysis By Application, 2021 to 2025
- Current and Future Market Size Value (USD Billion) Analysis and Forecast By Application, 2026 to 2036
- Gaming
- Music & Entertainment
- Health & Fitness
- Productivity
- Communication
- Security
- Other Applications
- Y-o-Y Growth Trend Analysis By Application, 2021 to 2025
- Absolute $ Opportunity Analysis By Application, 2026 to 2036
- Global Market Analysis and Forecast, By Region, 2021 to 2036
- Introduction
- Historical Market Size Value (USD Billion) Analysis By Region, 2021 to 2025
- Current Market Size Value (USD Billion) Analysis and Forecast By Region, 2026 to 2036
- North America
- Latin America
- Western Europe
- Eastern Europe
- East Asia
- South Asia & Pacific
- Middle East & Africa
- Market Attractiveness Analysis By Region
- North America Market Analysis and Forecast, By Country, 2021 to 2036
- Historical Market Size Value (USD Billion) Trend Analysis By Market Taxonomy, 2021 to 2025
- Market Size Value (USD Billion) Forecast By Market Taxonomy, 2026 to 2036
- By Country
- United States
- Canada
- By Store Type
- By Application
- By Country
- Market Attractiveness Analysis
- By Country
- By Store Type
- By Application
- Key Takeaways
- Latin America Market Analysis and Forecast, By Country
- Historical Market Size Value (USD Billion) Trend Analysis By Market Taxonomy, 2021 to 2025
- Market Size Value (USD Billion) Forecast By Market Taxonomy, 2026 to 2036
- By Country
- Brazil
- Mexico
- Argentina
- By Store Type
- By Application
- By Country
- Market Attractiveness Analysis
- By Country
- By Store Type
- By Application
- Key Takeaways
- Western Europe Market Analysis and Forecast, By Country
- Historical Market Size Value (USD Billion) Trend Analysis By Market Taxonomy, 2021 to 2025
- Market Size Value (USD Billion) Forecast By Market Taxonomy, 2026 to 2036
- By Country
- Germany
- United Kingdom
- France
- Italy
- Spain
- BENELUX
- Nordics
- By Store Type
- By Application
- By Country
- Market Attractiveness Analysis
- By Country
- By Store Type
- By Application
- Key Takeaways
- Eastern Europe Market Analysis and Forecast, By Country
- Historical Market Size Value (USD Billion) Trend Analysis By Market Taxonomy, 2021 to 2025
- Market Size Value (USD Billion) Forecast By Market Taxonomy, 2026 to 2036
- By Country
- Poland
- Russia
- Czech Republic
- Romania
- By Store Type
- By Application
- By Country
- Market Attractiveness Analysis
- By Country
- By Store Type
- By Application
- Key Takeaways
- East Asia Market Analysis and Forecast, By Country
- Historical Market Size Value (USD Billion) Trend Analysis By Market Taxonomy, 2021 to 2025
- Market Size Value (USD Billion) Forecast By Market Taxonomy, 2026 to 2036
- By Country
- China
- Japan
- South Korea
- By Store Type
- By Application
- By Country
- Market Attractiveness Analysis
- By Country
- By Store Type
- By Application
- Key Takeaways
- South Asia & Pacific Market Analysis and Forecast, By Country
- Historical Market Size Value (USD Billion) Trend Analysis By Market Taxonomy, 2021 to 2025
- Market Size Value (USD Billion) Forecast By Market Taxonomy, 2026 to 2036
- By Country
- India
- ASEAN
- Australia & New Zealand
- By Store Type
- By Application
- By Country
- Market Attractiveness Analysis
- By Country
- By Store Type
- By Application
- Key Takeaways
- Middle East & Africa Market Analysis and Forecast, By Country
- Historical Market Size Value (USD Billion) Trend Analysis By Market Taxonomy, 2021 to 2025
- Market Size Value (USD Billion) Forecast By Market Taxonomy, 2026 to 2036
- By Country
- GCC Countries
- South Africa
- Israel
- By Store Type
- By Application
- By Country
- Market Attractiveness Analysis
- By Country
- By Store Type
- By Application
- Key Takeaways
- Key Countries Market Analysis
- United States
- Pricing Analysis
- Market Share Analysis, 2025
- By Store Type
- By Application
- Canada
- Pricing Analysis
- Market Share Analysis, 2025
- By Store Type
- By Application
- Mexico
- Pricing Analysis
- Market Share Analysis, 2025
- By Store Type
- By Application
- Brazil
- Pricing Analysis
- Market Share Analysis, 2025
- By Store Type
- By Application
- Germany
- Pricing Analysis
- Market Share Analysis, 2025
- By Store Type
- By Application
- United Kingdom
- Pricing Analysis
- Market Share Analysis, 2025
- By Store Type
- By Application
- Italy
- Pricing Analysis
- Market Share Analysis, 2025
- By Store Type
- By Application
- Spain
- Pricing Analysis
- Market Share Analysis, 2025
- By Store Type
- By Application
- France
- Pricing Analysis
- Market Share Analysis, 2025
- By Store Type
- By Application
- India
- Pricing Analysis
- Market Share Analysis, 2025
- By Store Type
- By Application
- ASEAN
- Pricing Analysis
- Market Share Analysis, 2025
- By Store Type
- By Application
- Australia & New Zealand
- Pricing Analysis
- Market Share Analysis, 2025
- By Store Type
- By Application
- China
- Pricing Analysis
- Market Share Analysis, 2025
- By Store Type
- By Application
- Japan
- Pricing Analysis
- Market Share Analysis, 2025
- By Store Type
- By Application
- South Korea
- Pricing Analysis
- Market Share Analysis, 2025
- By Store Type
- By Application
- Russia
- Pricing Analysis
- Market Share Analysis, 2025
- By Store Type
- By Application
- Poland
- Pricing Analysis
- Market Share Analysis, 2025
- By Store Type
- By Application
- South Africa
- Pricing Analysis
- Market Share Analysis, 2025
- By Store Type
- By Application
- Australia
- Pricing Analysis
- Market Share Analysis, 2025
- By Store Type
- By Application
- United States
- Market Structure Analysis
- Competition Dashboard
- Competition Benchmarking
- Market Share Analysis of Top Players
- By Regional
- By Store Type
- By Application
- Emerging Startups
- Innovation Benchmarking
- Competition Analysis
- Competition Deep Dive
- Google Play
- Overview
- Product Portfolio
- Profitability by Market Segments
- Sales Footprint
- Strategy Overview
- Marketing Strategy
- Product Strategy
- Channel Strategy
- Apple App Store
- Samsung Galaxy Store
- Huawei AppGallery
- Amazon Appstore
- Google Play
- Case Studies
- Success Stories
- Recent Developments
- Competition Deep Dive
- Assumptions & Acronyms Used


