The combi ovens market, valued at USD 2.6 billion in 2025, is expected to reach USD 7.2 billion by 2035, growing at a CAGR of 10.7% between 2025 and 2030. Growth is driven by rising demand for versatile cooking equipment in commercial kitchens, including restaurants, hotels, and catering services seeking efficiency and multifunctionality. Technological improvements, such as smart cooking features and energy-efficient designs, encourage operators to replace traditional ovens with advanced combi ovens. Automation in cooking processes attracts businesses aiming for consistent quality and reduced labor requirements, supporting revenue expansion during this period.
Demand for high-capacity, space-saving equipment and healthier cooking methods will further support market growth. Regions with expanding hospitality and foodservice sectors are expected to adopt combi ovens at a faster rate, strengthening overall market performance. Manufacturers focusing on product innovations, strategic collaborations, and targeted marketing campaigns will capture incremental market share, particularly in metropolitan areas and fast-developing economies.
The first five years of growth are expected to be shaped by increasing adoption of multifunctional ovens, evolving consumer preferences, and technological advancements, creating steady opportunities for both manufacturers and end users.
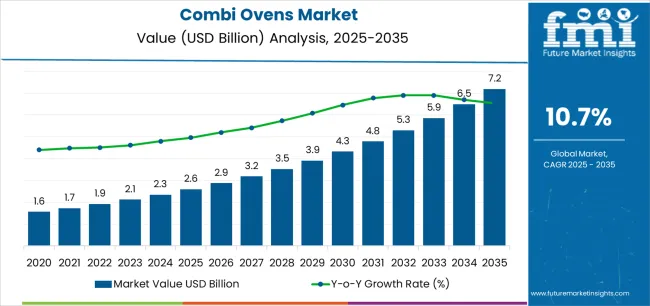
The combi ovens market demonstrates distinct growth phases with varying market characteristics and competitive dynamics. Between 2025 and 2030, the market progresses through its technology adoption phase, expanding from USD 2.6 billion to USD 4.5 billion with steady annual increments averaging 10.7% growth. This period showcases the transition from conventional manual cooking equipment to advanced cloud-connected systems with enhanced automation capabilities and integrated HACCP monitoring becoming mainstream features.
The 2025-2030 phase adds USD 1.9 billion to market value, representing 45% of total decade expansion. Market maturation factors include standardization of connectivity and IoT protocols, declining component costs for intelligent combi ovens, and increasing industry awareness of labor efficiency benefits reaching 60-70% productivity improvement in commercial kitchen applications. Competitive landscape evolution during this period features established equipment manufacturers like Rational and Electrolux Professional expanding their connected oven portfolios while specialty manufacturers focus on advanced auto-cook development and enhanced energy efficiency capabilities.
From 2030 to 2035, market dynamics shift toward advanced automation integration and global foodservice expansion, with growth continuing from USD 4.5 billion to USD 7.1 billion, adding USD 2.6 billion or 55% of total expansion. This phase transition centers on fully autonomous cooking systems, integration with comprehensive kitchen management networks, and deployment across diverse foodservice and retail scenarios, becoming standard rather than specialized applications. The competitive environment matures with focus shifting from basic cooking capability to comprehensive recipe optimization systems and integration with predictive maintenance platforms.
| Metric | Value |
|---|---|
| Market Value (2025) | USD 2.6 billion |
| Market Forecast (2035) | USD 7.1 billion |
| Growth Rate | 10.7% CAGR |
| Leading Technology | Medium Capacity Category |
| Primary End Use | Hotels & Restaurants Segment |
The market demonstrates strong fundamentals with medium capacity combi oven systems capturing a dominant share through advanced cooking versatility and operational flexibility capabilities. Hotels and restaurants applications drive primary demand, supported by increasing menu complexity requirements and labor optimization technology needs. Geographic expansion remains concentrated in developed foodservice markets with established commercial kitchen infrastructure, while emerging economies show accelerating adoption rates driven by quick-service restaurant expansion and rising food quality standards.
Market expansion rests on three fundamental shifts driving adoption across the foodservice, hospitality, and retail sectors.
The labor shortage challenges create compelling operational advantages through combi ovens that provide automated cooking programs without requiring skilled chef expertise, enabling foodservice operators to maintain consistent quality while addressing workforce availability and reducing training requirements.
The menu diversification acceleration worldwide as restaurants and hotels seek multifunctional equipment systems that replace multiple appliances, enabling space optimization and operational efficiency that align with kitchen footprint constraints and capital budget standards.
The food safety compliance mandates drive adoption from commercial kitchens and institutional facilities requiring effective HACCP monitoring solutions that ensure temperature control while maintaining cooking consistency during high-volume service operations and quality assurance requirements. The growth faces headwinds from capital investment barriers that vary across independent restaurants regarding the procurement of premium connected equipment and automation systems, which may limit adoption in price-sensitive foodservice environments. Technical complexity also persists regarding programming interfaces and connectivity requirements that may reduce operator comfort in traditional kitchen settings and legacy infrastructure, which affect equipment utilization and return on investment.
The combi ovens market represents a specialized yet critical equipment opportunity driven by expanding global foodservice operations, commercial kitchen modernization, and the need for superior cooking consistency in diverse culinary applications. As foodservice operators worldwide seek to achieve 60-70% labor cost reduction, improve food quality consistency by 40-50%, and integrate advanced cooking automation with recipe management platforms, combi ovens are evolving from basic steam-convection appliances to sophisticated culinary solutions ensuring menu excellence and operational efficiency.
The market's growth trajectory from USD 2.6 billion in 2025 to USD 7.1 billion by 2035 at a 10.7% CAGR reflects fundamental shifts in commercial kitchen automation requirements and food safety optimization. Geographic expansion opportunities are particularly pronounced in Asia Pacific markets, while the dominance of medium capacity systems (42.6% market share) and hotels & restaurants applications (37.4% share) provides clear strategic focus areas.
Strengthening the dominant medium capacity segment (42.6% market share) through enhanced cooking program configurations, superior temperature control precision, and automated cleaning systems. This pathway focuses on optimizing steam generation technology, improving cooking chamber design, extending equipment effectiveness to multi-format menu applications, and developing specialized programs for diverse cuisine requirements. Market leadership consolidation through advanced sensor engineering and cloud connectivity integration enables premium positioning while defending competitive advantages against conventional cooking equipment. Expected revenue pool: USD 380-490 million
Rapid quick-service restaurant growth and hotel infrastructure expansion across Asia Pacific creates substantial opportunities through local distribution partnerships and service network development. Growing middle-class dining expenditure and foodservice professionalization drive sustained demand for automated cooking systems. Regional market strategies enhance parts availability, enable faster technical support, and position companies advantageously for chain expansion programs while accessing growing commercial kitchen markets. Expected revenue pool: USD 340-440 million
Expansion within the dominant hotels & restaurants segment (37.4% market share) through specialized equipment addressing hospitality standards and multi-outlet consistency requirements. This pathway encompasses banquet cooking capability, à la carte menu flexibility, and compatibility with diverse culinary workflows. Premium positioning reflects superior cooking performance and comprehensive recipe management supporting modern hotel food & beverage operations. Expected revenue pool: USD 300-390 million
Strategic advancement in steam-generated combi ovens (55.0% market share) requires enhanced boiler efficiency and specialized steam injection addressing professional cooking requirements. This pathway addresses precise humidity control, rapid steam generation, and advanced cooking mode integration with sophisticated temperature management. Premium pricing reflects cooking quality excellence and professional chef preferences through superior steam performance. Expected revenue pool: USD 270-350 million
Development of comprehensive IoT cooking systems addressing remote monitoring, recipe standardization, and HACCP compliance requirements across multi-site foodservice operations. This pathway encompasses cloud recipe management, automated HACCP logging, and comprehensive fleet monitoring platforms. Technology differentiation through proprietary connectivity enables diversified revenue streams including subscription services while reducing dependency on hardware-only business models. Expected revenue pool: USD 240-310 million
Expansion targeting central kitchens, contract caterers, and delivery-only facilities through specialized equipment for high-volume standardized production. This pathway encompasses batch cooking optimization, tray-based cooking systems, and specialized integration for assembly-line food preparation. Market development through operational efficiency validation enables differentiated positioning while accessing rapidly growing ghost kitchen and cloud kitchen segments. Expected revenue pool: USD 210-270 million
Development of comprehensive energy-optimized cooking systems addressing sustainability mandates and electrification requirements across commercial foodservice operations. This pathway encompasses all-electric combi platforms, energy consumption monitoring, and comprehensive utility cost optimization. Premium positioning reflects environmental leadership and operational cost savings while enabling access to green building certified facilities and sustainability-focused operators. Expected revenue pool: USD 180-230 million
Primary Classification: The market segments by capacity into Low, Medium, and Heavy categories, representing the evolution from compact installations to high-volume production solutions for comprehensive commercial cooking optimization.
Secondary Classification: Product type segmentation divides the market into Steam-Generated and Boilerless systems, reflecting distinct requirements for cooking performance, installation complexity, and maintenance standards.
Tertiary Classification: End use segmentation encompasses Hotels & Restaurants, Commercial Kitchens, Retail Outlets, and Domestic & Institutional facilities, representing diverse operational requirements for menu consistency and cooking automation.
Regional Classification: Geographic distribution covers North America, Europe, Asia Pacific, Latin America, Africa, and the Middle East, with developed foodservice markets leading technology adoption while emerging economies show accelerating growth patterns driven by hospitality expansion programs.
The segmentation structure reveals technology progression from conventional steam-convection ovens toward cloud-connected intelligent cooking systems with enhanced automation and remote management capabilities, while application diversity spans from fine dining restaurants to specialized retail bake-off operations requiring comprehensive cooking solutions.
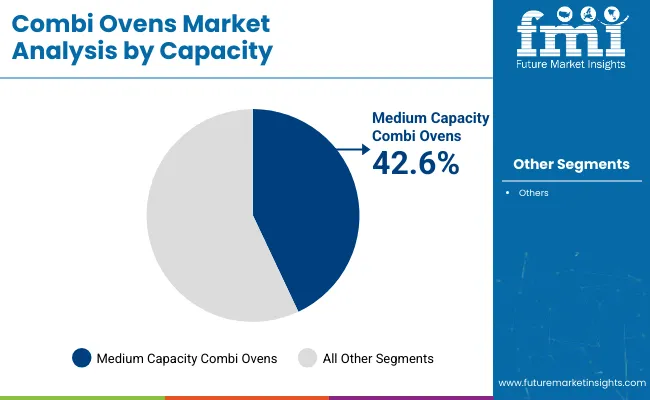
Market Position: Medium capacity combi oven systems command the leading position in the Combi Ovens market with approximately 42.6% market share through advanced versatility features, including optimal production volume, efficient space utilization, and operational flexibility that enable foodservice operators to address diverse menu requirements across multiple service periods.
Value Drivers: The segment benefits from operator preference for balanced capacity systems that provide sufficient production capability for peak service periods, menu variety accommodation, and kitchen space optimization without excessive equipment investment. Advanced cooking features enable multi-mode operation, programmable recipe storage, and integration with existing kitchen workflows, where versatility and reliability represent critical operational requirements.
Competitive Advantages: Medium capacity systems differentiate through proven operational suitability for diverse foodservice formats, optimal investment-to-capacity ratios, and integration with standard kitchen layouts that enhance menu capabilities while maintaining costs suitable for independent restaurants and small chain operations.
Key market characteristics:
Low capacity systems maintain 33.4% market share due to their essential compact footprint and entry-level investment characteristics for small restaurants and retail operations. Heavy capacity equipment captures 24.0% share through high-volume production capability, central kitchen applications, and institutional foodservice requiring large-batch cooking for hospitals, schools, and military facilities.
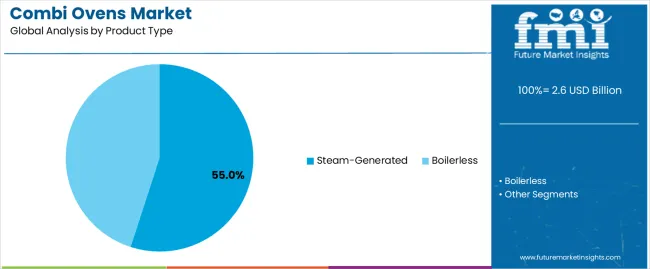
Market Context: Steam-generated applications dominate the Combi Ovens market with approximately 55.0% market share due to widespread adoption of traditional boiler technology and established focus on professional cooking performance, precise humidity control, and culinary quality applications that maximize menu versatility while maintaining chef-preferred cooking characteristics.
Appeal Factors: Professional chefs and foodservice operators prioritize cooking quality, steam injection precision, and integration with traditional culinary techniques that enable authentic cooking results across roasting, baking, and steaming applications. The segment benefits from substantial equipment familiarity and cooking performance reputation that emphasize steam-generated reliability for diverse menu applications from fine dining to banquet operations.
Growth Drivers: Hotel kitchen modernization programs incorporate steam-generated combi ovens as essential equipment for culinary excellence and menu complexity support, while restaurant chain expansions increase demand for proven cooking technology that complies with brand recipe standards and optimizes food quality consistency.
Market Challenges: Higher installation complexity and water treatment requirements may increase implementation costs and maintenance considerations versus boilerless alternatives.
Application dynamics include:
Boilerless combi ovens maintain 45.0% market share through simplified installation, reduced maintenance requirements, and compact footprint advantages. These systems address quick-service operations, retail bake-off applications, and installations with limited water quality or utility infrastructure requiring plug-and-play deployment with minimal technical complexity.
Growth Accelerators: Labor shortage pressures drive primary adoption as combi ovens provide automated cooking programs that enable foodservice operators to maintain menu quality without requiring extensive culinary expertise, supporting operational continuity and quality consistency that address workforce availability challenges and training cost reduction. Menu complexity demand accelerates market expansion as restaurants seek multifunctional equipment that replaces multiple cooking appliances while maintaining space efficiency during kitchen renovation and operational optimization initiatives. Food safety compliance spending increases worldwide, creating sustained demand for HACCP-integrated cooking equipment that complements temperature monitoring, cooking documentation, and traceability processes providing regulatory compliance in commercial foodservice environments.
Growth Inhibitors: Equipment cost barriers vary across independent restaurant segments regarding the procurement of advanced connected combi ovens and automation systems, which may limit market penetration in budget-constrained establishments or regions with lower average check sizes. Technical complexity persists regarding programming interfaces and connectivity setup that may reduce operator adoption in traditional kitchen cultures, affecting equipment utilization and operational confidence. Market fragmentation across multiple cooking specifications and programming standards creates compatibility concerns between different manufacturer systems and multi-brand kitchen infrastructure.
Market Evolution Patterns: Adoption accelerates in hotel operations and restaurant chains where consistency benefits justify premium equipment costs, with geographic concentration in developed markets transitioning toward mainstream adoption in emerging economies driven by hospitality expansion and foodservice professionalization. Technology development focuses on enhanced cloud connectivity, improved auto-cook algorithms, and integration with kitchen management systems that optimize recipe deployment and equipment monitoring. The market could face disruption if alternative cooking technologies or modular kitchen automation significantly change commercial food preparation methods, though the industry's fundamental need for versatile cooking capability continues to make combi ovens essential in professional kitchens.
The combi ovens market demonstrates varied regional dynamics with Growth Leaders including Japan (10.8% CAGR) and India (10.3% CAGR) driving expansion through foodservice automation and hospitality infrastructure development. Emerging Markets encompass China (10.1% CAGR) benefiting from kitchen modernization and retail format evolution. Technology Adopters feature the United States (9.8% CAGR), United Arab Emirates (9.6% CAGR), and Germany (9.3% CAGR), supported by chain remodeling and connected kitchen adoption. Mature Markets include the United Kingdom (9.0% CAGR), where quick-service restaurant growth supports consistent expansion patterns.
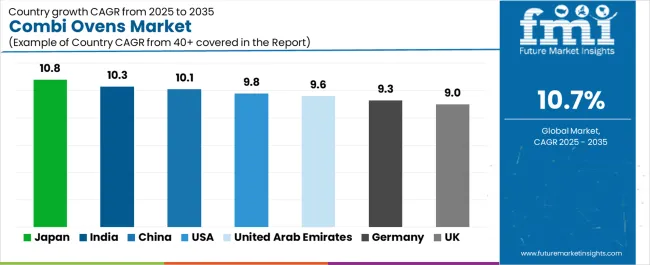
| Country | CAGR (2025-2035) |
|---|---|
| Japan | 10.8% |
| India | 10.3% |
| China | 10.1% |
| United States | 9.8% |
| United Arab Emirates | 9.6% |
| Germany | 9.3% |
| United Kingdom | 9.0% |
Regional synthesis reveals Asia Pacific markets leading adoption through hospitality expansion and convenience foodservice growth, while North American and Middle Eastern countries maintain robust demand supported by chain restaurant remodeling and premium hospitality projects. European markets show strong growth driven by energy efficiency retrofits and connected kitchen compliance requirements.
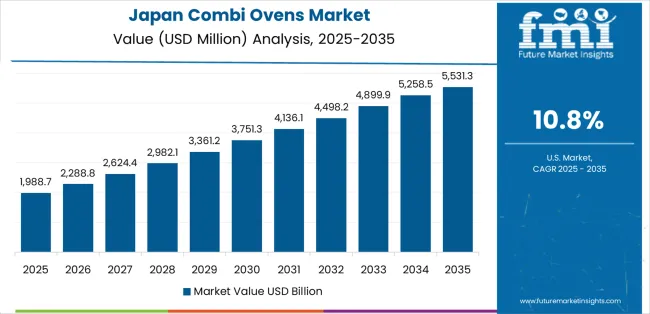
Japan leads growth momentum with a 10.8% CAGR, driven by high penetration of automated back-of-house equipment in dense urban foodservice, strong convenience retail formats, and technology integration across Tokyo, Osaka, Nagoya, and regional cities. Convenience store chain expansion and automated prepared food production drive primary combi oven demand for standardized cooking operations, while hotel infrastructure serving tourism and business travel supports kitchen modernization. Government food safety standards and operator efficiency requirements accelerate equipment upgrades with connected HACCP monitoring capabilities.
The convergence of labor shortage challenges requiring automation, space constraints favoring multifunctional equipment, and quality consistency expectations positions Japan as a key growth market for combi ovens. Convenience retail format evolution including in-store bakery and prepared foods creates sustained equipment demand, while restaurant chain standardization drives recipe-programmed cooking system adoption supporting multi-location consistency and remote management capabilities.
Performance Metrics:
The Indian market emphasizes explosive quick-service restaurant rollout with documented adoption effectiveness in chain expansion and hotel pipeline development through integration with modern kitchen infrastructure and foodservice professionalization. The country leverages growing middle-class dining expenditure and hospitality investment to maintain strong market presence at 10.3% CAGR. Metropolitan areas including Delhi NCR, Mumbai, Bangalore, Hyderabad, and Pune showcase extensive installations where combi ovens integrate with comprehensive kitchen automation platforms and chain operating systems to optimize cooking consistency and labor productivity. Indian foodservice operators prioritize equipment reliability, vendor service support, and operational training that create demand for commercial-grade systems with comprehensive technical assistance meeting rapid expansion requirements.
International hotel brands and quick-service restaurant chains drive substantial equipment procurement through standardized kitchen specifications and multi-unit rollout programs. Mid-market restaurant chains including casual dining and quick-casual formats upgrade from traditional cooking equipment to multifunctional combi systems supporting menu expansion and operational efficiency.
Market Intelligence Brief:
China's expanding foodservice market demonstrates substantial combi oven deployment with documented operational effectiveness in large kitchen estates, retail bake-off operations, and digital foodservice formats through integration with standardized production protocols and supply chain systems. The country leverages manufacturing scale and hospitality growth to maintain robust equipment adoption at 10.1% CAGR. Major cities including Shanghai, Beijing, Guangzhou, Shenzhen, and Chengdu showcase significant installations where combi ovens integrate with comprehensive food production platforms and chain management systems to optimize cooking efficiency and quality control. Chinese foodservice operators prioritize high-volume capability, equipment durability, and competitive pricing that create demand for commercial systems meeting rapid expansion and standardized operation requirements. The market benefits from government food safety regulations, tourism industry development, and domestic equipment manufacturing that support kitchen modernization and technology adoption.
Hotel kitchen renovations and chain restaurant expansion drive sustained combi oven demand for consistent food production. Retail supermarket chains implementing in-store bakery and prepared food programs require automated cooking equipment for standardized production meeting food safety and quality expectations.
Strategic Market Indicators:
The USA market emphasizes advanced connectivity features with documented effectiveness in chain restaurant remodels, ghost kitchen expansion, and electrification mandates through integration with kitchen management systems and energy optimization at 9.8% CAGR. American foodservice operators prioritize equipment reliability, vendor service coverage, and regulatory compliance creating demand for commercial-grade combi ovens with NSF certification and comprehensive warranty programs. Restaurant chain remodeling cycles and kitchen refresh programs drive sustained equipment replacement demand, while ghost kitchen and virtual restaurant growth creates new installation opportunities for compact multifunctional cooking equipment. Electrification mandates in California and other jurisdictions accelerate electric combi oven adoption replacing gas equipment in commercial kitchen upgrades.
Chain restaurant headquarters specifications and multi-unit purchasing programs drive standardized equipment procurement across franchise and corporate locations. Ghost kitchen operators maximize limited kitchen space with versatile cooking equipment supporting multiple virtual restaurant concepts from single production facilities.
Strategic Development Indicators:
The UAE market demonstrates sophisticated adoption at 9.6% CAGR characterized by tourism and hospitality project investment, premium food hall development, and specification shift toward connected water-saving equipment. The Emirati market focuses on luxury hotel installations including Dubai and Abu Dhabi resort properties requiring premium kitchen equipment with advanced automation, international brand specifications, and comprehensive connectivity for multi-outlet food & beverage operations. Premium food hall and dining destination development drives combi oven demand for diverse culinary concepts requiring versatile cooking capability and consistent quality. Water conservation initiatives and sustainability certifications accelerate adoption of water-efficient equipment meeting green building requirements and operational cost optimization.
Major hospitality projects and tourism infrastructure investment create sustained high-specification equipment demand. International hotel operators and celebrity chef restaurants require premium cooking equipment meeting global brand standards and culinary excellence expectations.
Performance Metrics:
Germany maintains steady expansion at 9.3% CAGR through energy efficiency retrofits, bakery retail estate upgrades, and HACCP/connected kitchen compliance across foodservice and retail operations. German foodservice and retail operators emphasize energy performance, regulatory compliance, and total cost of ownership that create demand for efficient combi ovens with comprehensive energy monitoring and optimization features. Bakery retail chains including in-store bake-off operations drive equipment demand for standardized production meeting food quality and energy efficiency requirements. Connected kitchen initiatives and digital HACCP compliance accelerate adoption of IoT-enabled equipment with automated logging and remote monitoring capabilities.
Commercial kitchen renovations and energy efficiency mandates favor modern combi ovens replacing aging equipment with significant energy consumption improvements. Retail bakery chains standardize equipment across locations for consistent product quality and operational efficiency.
Market Characteristics:
The UK market focuses on quick-service restaurant expansion with documented effectiveness in estate refresh programs and compact boilerless unit adoption at 9.0% CAGR. British foodservice emphasizes rapid deployment, operational simplicity, and space efficiency that drive demand for compact combi ovens suitable for urban locations and conversion properties with limited kitchen space. Quick-service restaurant growth outpacing full-service segments creates sustained equipment demand for standardized cooking supporting limited menus and high-volume production. Estate refresh cycles following post-pandemic remodeling periods drive equipment replacement with current technology including connectivity and energy efficiency features.
Chain restaurant expansion in high street locations and retail parks drives combi oven demand for compact efficient cooking supporting service speed and menu consistency. Pub and casual dining operators upgrade kitchen equipment during refurbishment programs improving cooking versatility and labor efficiency.
Strategic Development Indicators:
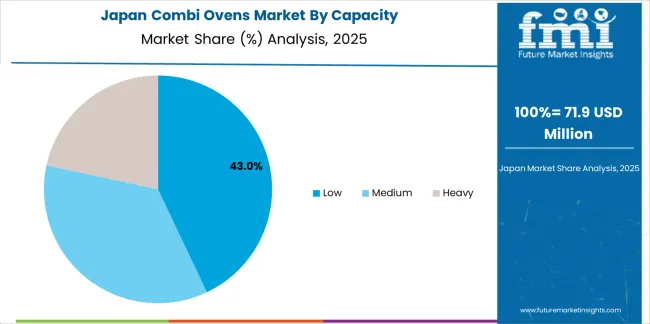
Japan demonstrates advanced market development characterized by automated connected back-of-house equipment integration and comprehensive convenience retail formats that emphasize precision cooking control, space optimization, and IoT connectivity. The Japanese market focuses on dense urban foodservice operations where labor efficiency and compact equipment footprint drive combi oven adoption including automated cooking programs, remote monitoring, and integration with inventory management systems. Equipment procurement emphasizes reliability, precise temperature control, and manufacturer service excellence that align with Japanese operational standards and quality expectations. The market benefits from domestic equipment manufacturers including Fujimak maintaining strong technology development capabilities and comprehensive service networks, while international premium brands appeal to hotel and upscale restaurant segments requiring advanced features and global brand alignment.
Market Development Factors:
South Korea demonstrates emerging market characteristics focused on premium hotel and restaurant installations plus franchise chain expansion reflecting technology sophistication and quality equipment preferences. The Korean market emphasizes advanced cooking automation including touch-screen controls, recipe management systems, and connectivity features that reflect the country's technology leadership and digital integration expectations. Korean foodservice operators and hotel properties prioritize equipment innovation, brand reputation, and comprehensive warranty programs supporting premium positioning and manufacturer service quality. The market benefits from hospitality infrastructure investment supporting international tourism and domestic travel creating hotel kitchen modernization demand, while franchise restaurant expansion drives equipment standardization across multi-unit operations.
Strategic Development Indicators:
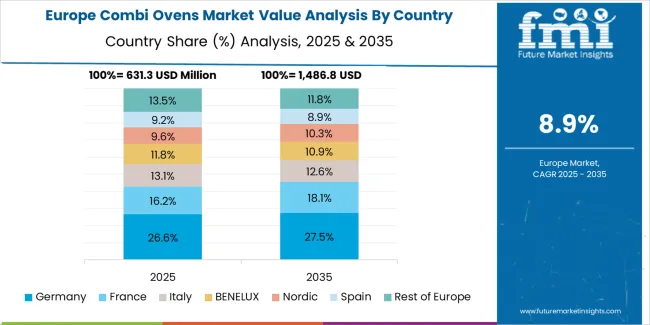
The combi ovens market in Europe is projected to grow from USD 0.8 billion in 2025 to USD 2.2 billion by 2035, registering a CAGR of approximately 9.5% over the forecast period. Germany is expected to maintain its leadership position with a 21.0% market share in 2025 and 2035, supported by energy efficiency retrofits, bakery retail estate upgrades, and HACCP/connected kitchen compliance driving sustained equipment demand.
United Kingdom follows with a 16.0% share in 2025, maintaining stability through 2035, driven by quick-service restaurant growth outpacing full-service formats and estate refresh programs prioritizing compact boilerless units for urban locations. France holds a 14.0% share in 2025 and 2035, supported by hotel kitchen modernization and boulangerie chain equipment standardization. Italy commands a 12.0% share throughout the period aided by hotel and restaurant sector strength plus retail food format evolution. Spain accounts for 9.0% in 2025 and 2035 reflecting hospitality sector recovery and hotel kitchen renovations. The Nordic countries collectively hold 8.0% in 2025 and 2035 with strong institutional catering and food safety compliance driving adoption. Benelux represents 7.0% stable through 2035 with contract catering and retail food operations. Central & Eastern Europe is anticipated to maintain 13.0% share as hospitality investment and international chain expansion drive equipment standardization and modern kitchen development across the region.
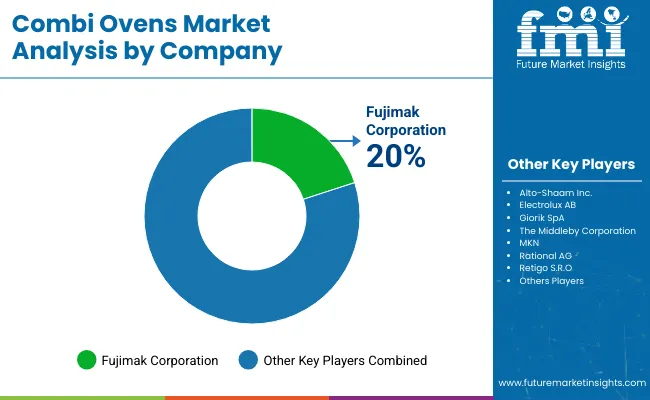
The combi ovens market operates with moderate concentration, featuring approximately 20-30 meaningful participants, where leading companies control roughly 35-40% of the global market share through established foodservice relationships and comprehensive equipment portfolios. Competition emphasizes advanced connectivity capabilities, cooking automation sophistication, and service network quality rather than price-based rivalry.
Market Leaders encompass Rational AG, Electrolux Professional, and UNOX S.p.A., collectively commanding approximately 30-35% market share. These companies maintain competitive advantages through extensive professional cooking expertise, global dealer and service networks, and comprehensive IoT platform capabilities that create customer loyalty and support premium pricing. They leverage decades of combi oven innovation and ongoing software development investments to deliver advanced systems with cloud connectivity and automated cooking intelligence.
Technology Innovators include Welbilt (Convotherm), The Middleby Corporation (Blodgett), and Alto-Shaam, which compete through focused automation development and innovative cooking interfaces. These companies differentiate through rapid technology cycles and specialized features appealing to chain operators seeking standardized production and labor efficiency improvements.
Regional Specialists feature companies with specific market focus including MKN, Retigo, Fujimak, and Giorik, providing tailored solutions for local culinary requirements, compact installations, and specialized applications. Market dynamics favor participants that combine reliable cooking performance with comprehensive connectivity features including remote diagnostics, recipe management, and HACCP logging capabilities.
| Item | Value |
|---|---|
| Quantitative Units | USD 2.6 billion |
| Capacity | Low, Medium, Heavy |
| Product Type | Steam-Generated, Boilerless |
| End Use | Hotels & Restaurants, Commercial Kitchens, Retail Outlets, Domestic & Institutional |
| Regions Covered | North America, Europe, Asia Pacific, Latin America, Africa, Middle East |
| Countries Covered | Japan, India, China, United States, United Arab Emirates, Germany, United Kingdom, and 25+ additional countries |
| Key Companies Profiled | Rational AG, Electrolux Professional, UNOX S.p.A., Welbilt (Convotherm), The Middleby Corporation, Alto-Shaam, MKN, Retigo, Fujimak, Giorik |
| Additional Attributes | Dollar sales by capacity, product type, and end use categories, regional adoption trends across Asia Pacific, North America, and Europe, competitive landscape with commercial cooking equipment manufacturers and foodservice technology suppliers, operator preferences for cooking automation and labor efficiency, integration with cloud platforms and HACCP systems, innovations in connectivity and auto-cook capabilities, and development of energy-efficient solutions with enhanced cooking performance and kitchen optimization capabilities. |
The global combi ovens market is estimated to be valued at USD 2.6 billion in 2025.
The market size for the combi ovens market is projected to reach USD 7.2 billion by 2035.
The combi ovens market is expected to grow at a 10.7% CAGR between 2025 and 2035.
The key product types in combi ovens market are low, medium and heavy.
In terms of product type, steam-generated segment to command 55.0% share in the combi ovens market in 2025.


Full Research Suite comprises of:
Market outlook & trends analysis
Interviews & case studies
Strategic recommendations
Vendor profiles & capabilities analysis
5-year forecasts
8 regions and 60+ country-level data splits
Market segment data splits
12 months of continuous data updates
DELIVERED AS:
PDF EXCEL ONLINE
Combined Charging System Market Size and Share Forecast Outlook 2025 to 2035
Combination Kinase Inhibitor Market Analysis - Size, Share, and Forecast Outlook 2025 to 2035
Combination Antihypertensive Agents Market Analysis - Size, Share, and Forecast Outlook 2025 to 2035
Combined Cycle Gas Turbine Market Size and Share Forecast Outlook 2025 to 2035
Combined Cycle Power Plant Market Size and Share Forecast Outlook 2025 to 2035
Combination Spanner Set Market Size and Share Forecast Outlook 2025 to 2035
Combined Cooling Heat and Power Plant Market Analysis - Size, Share, and Forecast Outlook 2025 to 2035
Combi Boiler Market Growth – Trends & Forecast 2025 to 2035
Combi Cooler Market Growth – Trends & Forecast 2025 to 2035
Combined Heat and Power (CHP) Systems Market Growth - Trends & Forecast 2025 to 2035
Recombinant DNA Market Size and Share Forecast Outlook 2025 to 2035
Recombinant Human Serum Albumin Market Size and Share Forecast Outlook 2025 to 2035
Recombinant Human Oncostatin M Reagent Market Size and Share Forecast Outlook 2025 to 2035
Recombined Milk Market
Recombinant Vaccines Market Analysis – Trends & Future Outlook 2018-2028
PV Combiner Box Market Size and Share Forecast Outlook 2025 to 2035
Fuse Combination Unit Market Growth - Trends, Analysis & Forecast by Type, Current Rating, Application, End-use Industry and Region through 2035
Micro Combined Heat and Power Market Size and Share Forecast Outlook 2025 to 2035
Human Combinatorial Antibody Libraries (HuCAL) Market Analysis - Size, Share, and Forecast Outlook 2025 to 2035
Commercial Combi Oven Market – Versatile Cooking Innovation 2025-2035

Thank you!
You will receive an email from our Business Development Manager. Please be sure to check your SPAM/JUNK folder too.
Chat With
MaRIA