The PV Combiner Box Market is estimated to be valued at USD 139.3 million in 2025 and is projected to reach USD 229.1 million by 2035, registering a compound annual growth rate (CAGR) of 5.1% over the forecast period.
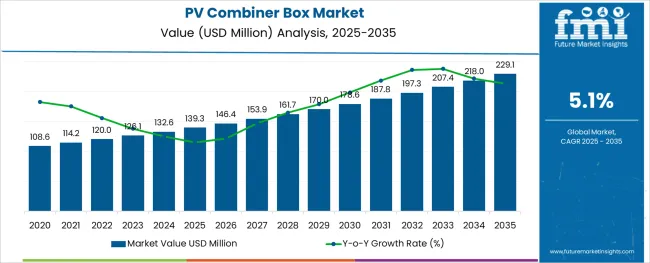
The PV combiner box market is undergoing notable expansion, driven by increasing solar PV installations across residential, commercial, and utility-scale projects. As solar systems become more complex and decentralized, the need for reliable, intelligent, and safety-compliant electrical protection components has intensified.
PV combiner boxes are serving as essential subsystems that aggregate multiple input strings from photovoltaic panels while ensuring system-level overcurrent protection, real-time monitoring, and maintenance flexibility. Regulatory mandates on DC protection and evolving fire safety codes are reinforcing the deployment of higher-grade, smart-enabled combiner boxes with integrated surge protection and remote communication capabilities.
The adoption of digital power electronics and remote asset management in solar arrays is elevating the importance of intelligent combiner systems in enabling predictive maintenance and operational transparency. With expanding solar infrastructure in emerging economies and modernization efforts in mature markets, the demand for next-generation combiner boxes is expected to remain strong across both rooftop and ground-mounted installations.
The market is segmented by Type and Application and region. By Type, the market is divided into DC Smart PV Combiner Box and AC Smart Combiner Box. In terms of Application, the market is classified into Commercial, Residential, and Utilities. Regionally, the market is classified into North America, Latin America, Western Europe, Eastern Europe, Balkan & Baltic Countries, Russia & Belarus, Central Asia, East Asia, South Asia & Pacific, and the Middle East & Africa.
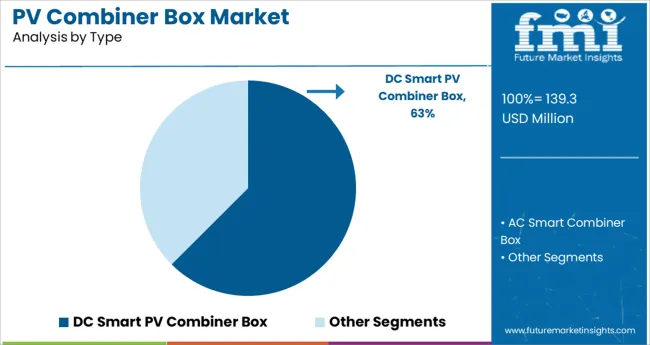
The DC smart PV combiner box segment is projected to contribute 62.5% of total revenue in 2025, making it the leading product type in the market. This leadership is attributed to its integrated digital features such as real-time performance monitoring, remote diagnostics, arc fault detection, and intelligent load balancing.
These advanced functionalities have become critical in modern solar arrays that require continuous system health monitoring and proactive maintenance capabilities. The growing adoption of string-level data analytics and smart inverter ecosystems has further elevated demand for DC smart combiner solutions.
Their ability to support higher current ratings, compact form factors, and modular expansion has made them ideal for utility-scale solar farms and complex commercial installations. Moreover, as cost-competitiveness improves and digital asset management becomes mainstream, DC smart PV combiner boxes are expected to remain the preferred standard across next-generation solar deployments.
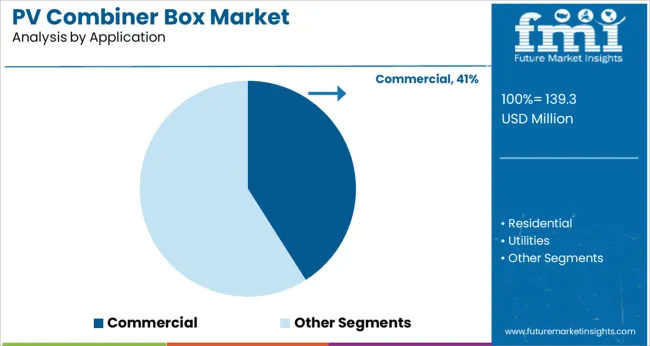
The commercial application segment is expected to command 41.0% of the total revenue share in 2025, establishing it as the dominant use case within the PV combiner box market. This dominance is being supported by the global surge in commercial rooftop solar installations across warehouses, shopping centers, corporate campuses, and institutional buildings.
These installations demand advanced system monitoring, load optimization, and stringent safety compliance, all of which are delivered by combiner boxes equipped with smart protection mechanisms and real-time communication modules. Commercial developers and facility operators are prioritizing energy cost savings, ESG compliance, and grid independence, which has reinforced investment in high-efficiency photovoltaic systems.
The scalability, reliability, and long-term performance offered by PV combiner boxes are essential in ensuring the financial viability and operational safety of commercial solar assets. As commercial energy users expand solar capacity through building-integrated photovoltaics and carport structures, this segment is expected to maintain its leadership in driving combiner box demand.
The rising adoption of PV combiner boxes in large-scale grid-connected PV systems is one of the major factors driving the growth of the market owing to its flexible, efficient, and safety features. Moreover, the rising demand for ground mount and commercial rooftop-based PV combiner boxes is also turning out to be another major factor driving the growth of the PV combiner box market positively. Mechanical and electrical failure at the time of installation is the major challenge faced by most PV combiner box vendors.
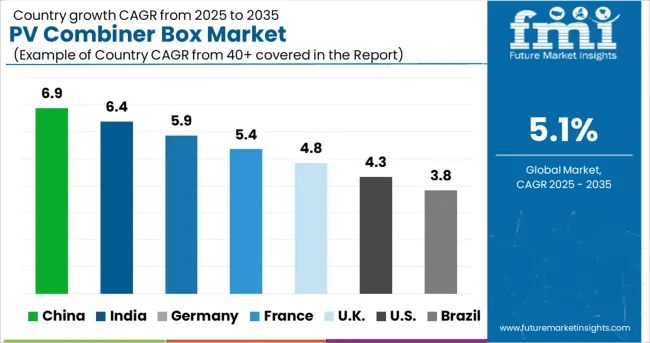
Regionally, the global PV combiner box market can be segmented into North America, Latin America, Western Europe, Eastern Europe, Middle East & Africa (MEA), Asia Pacific excluding Japan (APEJ), and Japan. Among these regions, North America is expected to hold the largest share of the PV combiner box market and is likely to continue to flourish in its trend, owing to significant growth in technological innovations of PV combiner boxes in this region.
North America is anticipated to control a maximum market share of the global PV combiner box in 2025. Among the total market share of the global PV combiner box market, it is also predicted to maintain steady growth throughout the forecasted period.
The European countries, including the UK, Italy, and Germany, have combined to attain a global PV combiner box market share in the forecast period. Increasing demand for renewable energy sources and increasing awareness of the benefits of PV combiner boxes may be responsible for this trend.
There are several factors contributing to this growth, including increased electricity consumption, increased investment in solar power infrastructure, and supportive government policies. Huge investments and business development opportunities have been attracted to this region.
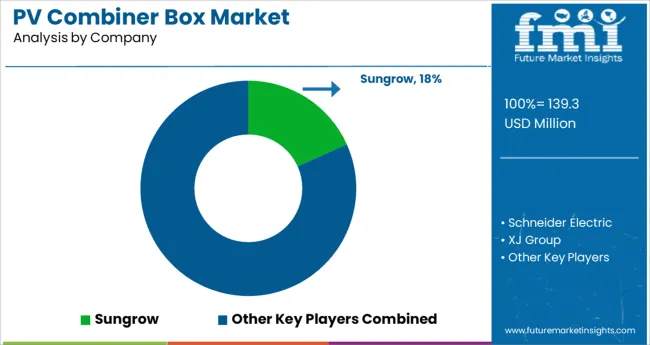
PV combiner boxes have a multifaceted ecosystem that has multiple participants responsible for the market's growth and sustainability. Emerging trends in the PV combiner box market are brought about as a result of the major players' adoption of several growth strategies, including product launches, acquisitions, and collaborations.
In July 2020, Eaton Corporation launched new Crouse-Hinds series 1500V DC combiner box for large-scale solar photovoltaic applications. This combiner box is specifically designed to help customers by minimizing system costs by reducing wiring requirements and installation time.
The prominent player operating in the PV combiner box market includes Schneider Electric, XJ Group, Eaton Corporation, Renovagyand Surpass Sun Electric, CFAT, Wuxi Longmax, Noark, Kingshore, Weidmuller, TOPBAND, Eaton, Jinting Solar, Kebite, TBEA, Huasheng Electric, EAST, Sungrow, FIBOX, Golden Highway, Guanya Power, Temaheng Energy, Tongqu Electric, and others.
| Report Attribute | Details |
|---|---|
| Growth Rate | CAGR of 5.1% from 2025 to 2035 |
| Base Year for Estimation | 2025 |
| Historical Data | 2020 to 2024 |
| Forecast Period | 2025 to 2035 |
| Quantitative Units | Revenue in million and CAGR from 2025 to 2035 |
| Report Coverage | Revenue Forecast, Volume Forecast, Company Ranking, Competitive Landscape, Growth Factors, Trends, and Pricing Analysis |
| Segments Covered | Type, Application, Region |
| Regions Covered | North America; Latin America; Western Europe; Eastern Europe; The Asia Pacific excluding Japan; Japan; The Middle East and Africa |
| Key Countries Profiled | United States of America, Canada, Brazil, Argentina, Germany, United Kingdom, France, Spain, Italy, Nordics, BENELUX, Australia & New Zealand, China, India, GCC Countries, South Africa |
| Key Companies Profiled | Schneider Electric; XJ Group; Eaton Corporation; Renovagyand Surpass Sun Electric; CFAT; Wuxi Longmax; Noark; Kingshore; Weidmuller; TOPBAND; Eaton; Jinting Solar; Kebite; TBEA; Huasheng Electric; EAST; Sungrow; FIBOX; Golden Highway; Guanya Power; Temaheng Energy; Tongqu Electric |
| Customization | Available Upon Request |
The global pv combiner box market is estimated to be valued at USD 139.3 million in 2025.
It is projected to reach USD 229.1 million by 2035.
The market is expected to grow at a 5.1% CAGR between 2025 and 2035.
The key product types are dc smart pv combiner box and ac smart combiner box.
commercial segment is expected to dominate with a 41.0% industry share in 2025.


Full Research Suite comprises of:
Market outlook & trends analysis
Interviews & case studies
Strategic recommendations
Vendor profiles & capabilities analysis
5-year forecasts
8 regions and 60+ country-level data splits
Market segment data splits
12 months of continuous data updates
DELIVERED AS:
PDF EXCEL ONLINE
PVC-M High Impact Resistant Water Supply Pipe Market Size and Share Forecast Outlook 2025 to 2035
PVC UV Stabilizer Market Size and Share Forecast Outlook 2025 to 2035
PVT Collectors Market Size and Share Forecast Outlook 2025 to 2035
PVC Electrical Conduit Market Size and Share Forecast Outlook 2025 to 2035
PVC Cling Film Market Size and Share Forecast Outlook 2025 to 2035
PVC Tapes Market Size and Share Forecast Outlook 2025 to 2035
PVC Footwear Market Analysis by Growth, Trends and Forecast from 2025 to 2035
PVC Packing Straps Market Report – Key Trends & Forecast 2025 to 2035
PV Micro Inverters Market Trends & Forecast 2025 to 2035
PV Inverter Market Analysis by Product, Phase, Connectivity, Nominal Power Output, Nominal Output Voltage, Application, and Region through 2035
PV Module Encapsulant Film Market Analysis by Material Type, Application, Thickness, Weight, End-Use, and Region Forecast through 2035
Market Share Insights of PVC-Free Cap Liner Manufacturers
Leading Providers & Market Share in PVC Tapes Industry
PVDC Coated Film Market Growth and Outlook 2025 to 2035
PVC Cling Wrap Market Trends & Growth Forecast 2024-2034
PVC Blister Packs Market
PVC Container Market
PVC-Free Packaging Market
PVC-free Cap Liners Market
PVDC Food Packaging Market

Thank you!
You will receive an email from our Business Development Manager. Please be sure to check your SPAM/JUNK folder too.
Chat With
MaRIA