Recombinant DNA Market Size and Share Forecast Outlook 2025 to 2035

The Recombinant DNA Market is estimated to be valued at USD 734.4 billion in 2025 and is projected to reach USD 1291.9 billion by 2035, registering a compound annual growth rate (CAGR) of 5.8% over the forecast period.
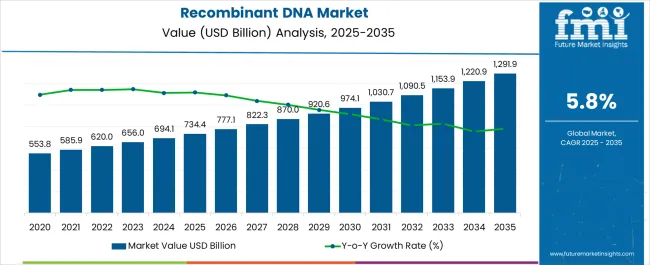
Quick Stats for Recombinant DNA Market

  • Recombinant DNA Market Value (2025): USD 734.4 billion
  • Recombinant DNA Market Forecast Value (2035): USD 1291.9 billion
  • Recombinant DNA Market Forecast CAGR: 5.8%
  • Leading Segment in Recombinant DNA Market in 2025: Pharmaceutical (32.6%)
  • Key Growth Regions in Recombinant DNA Market: North America, Asia-Pacific, Europe
  • Top Key Players in Recombinant DNA Market: Amgen Inc., Eli Lilly & Co., F. Hoffmann-La Roche Ltd. (Genentech), GenScript, Horizon Discovery, Merck KGaA, New England Biolabs, Novartis AG, Novo Nordisk A/S, Pfizer Inc., Sanofi, Syngene International, Thermo Fisher Scientific

Recombinant Dna Market Value Analysis

Recombinant DNA Market Key Takeaways

Metric Value
Recombinant DNA Market Estimated Value in (2025 E) USD 734.4 billion
Recombinant DNA Market Forecast Value in (2035 F) USD 1291.9 billion
Forecast CAGR (2025 to 2035) 5.8%

Why is the Recombinant DNA Market Growing?

The Recombinant DNA market is experiencing significant growth, driven by increasing demand for genetically engineered therapies and biopharmaceutical innovations. Rising prevalence of chronic diseases, infectious conditions, and genetic disorders is driving the need for novel and effective treatments. Advancements in molecular biology, gene editing technologies, and bioengineering techniques are enhancing the development of recombinant DNA products with improved efficacy and safety profiles.

The market is further supported by increasing investments from both public and private sectors in research and development, as well as collaborations between biotechnology firms and academic institutions. Regulatory frameworks supporting the development and commercialization of genetically engineered products are improving clinical adoption. The integration of recombinant DNA technologies in drug development pipelines is enabling targeted therapies and personalized medicine solutions.

Growing awareness about the potential of recombinant DNA applications in healthcare, coupled with technological advancements in large-scale production and quality control, is shaping market dynamics As the biotechnology and pharmaceutical sectors expand globally, recombinant DNA products are expected to maintain strong adoption, positioning the market for sustained growth over the coming decade.

Segmental Analysis

The recombinant dna market is segmented by product type, application, end user, and geographic regions. By product type, recombinant dna market is divided into Pharmaceutical, Vaccines, Recombinant Protein, Therapeutics Agents, Non-Pharmaceutical, Genetically Modified Crops, Biochemical, and Others. In terms of application, recombinant dna market is classified into Healthcare, Food & Beverages, Agriculture, and Others. Based on end user, recombinant dna market is segmented into Biotechnology & Pharmaceutical Industry, Biochemical Industry, Research Laboratories & Academic Institutes, and Others. Regionally, the recombinant dna industry is classified into North America, Latin America, Western Europe, Eastern Europe, Balkan & Baltic Countries, Russia & Belarus, Central Asia, East Asia, South Asia & Pacific, and the Middle East & Africa.
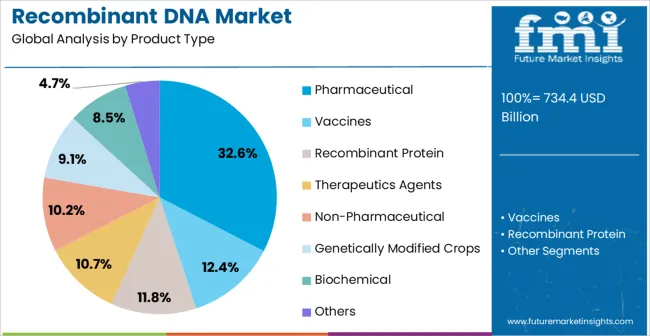
Insights into the Pharmaceutical Product Type Segment

Recombinant Dna Market Analysis By Product Type

The pharmaceutical product type segment is projected to hold 32.6% of the Recombinant DNA market revenue in 2025, establishing it as the leading product type. This dominance is being driven by the increasing adoption of recombinant DNA-based drugs in the treatment of various diseases, including cancer, autoimmune disorders, and infectious conditions. Advanced drug design enabled by recombinant DNA technologies allows for precise targeting of disease pathways, improving therapeutic outcomes while reducing adverse effects.

The ability to scale production for clinical and commercial applications enhances accessibility and cost-effectiveness, reinforcing its adoption. Pharmaceutical companies are leveraging recombinant DNA products to develop next-generation biologics and vaccines, expanding their portfolios and meeting growing healthcare demands.

Continuous advancements in gene expression systems, protein engineering, and purification processes have strengthened reliability and consistency in production, supporting wider implementation As healthcare systems prioritize personalized medicine and biologic therapies, the pharmaceutical segment is expected to maintain its market leadership, driven by ongoing innovation and strong clinical acceptance.
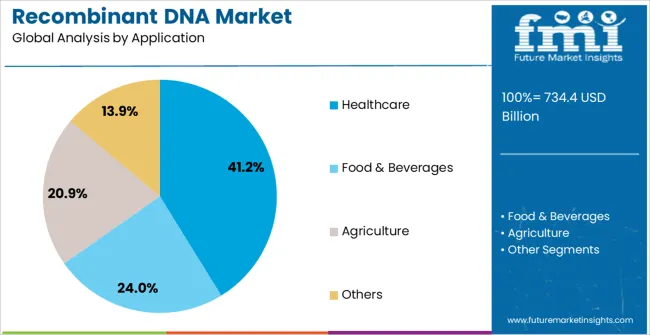
Insights into the Healthcare Application Segment

Recombinant Dna Market Analysis By Application

The healthcare application segment is anticipated to account for 41.2% of the market revenue in 2025, making it the largest application area. Growth is being driven by increasing integration of recombinant DNA technologies in diagnostics, therapeutics, and preventive care. Healthcare providers are leveraging recombinant DNA products to improve treatment accuracy, disease monitoring, and patient outcomes.

Advances in recombinant DNA research enable the development of vaccines, gene therapies, and biologic drugs that can target specific genetic or pathological conditions. Regulatory approvals and clinical validation of recombinant DNA applications are enhancing adoption in hospitals, specialty clinics, and research centers. The ability to personalize treatments and improve efficacy while reducing side effects strengthens the value proposition of recombinant DNA applications in healthcare.

Increasing awareness among healthcare professionals about genetic-based therapies, combined with rising patient demand for advanced treatment options, is further accelerating growth As healthcare infrastructure expands globally and precision medicine becomes more widespread, the healthcare application segment is expected to remain the primary driver of market revenue.
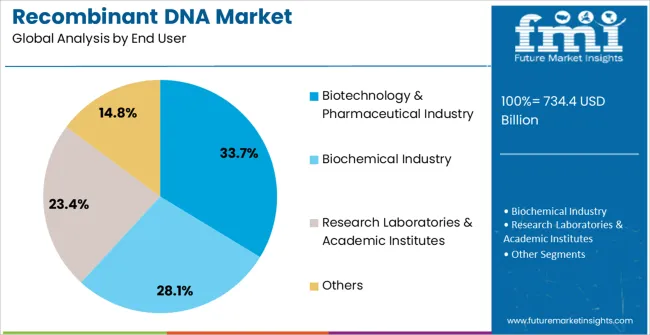
Insights into the Biotechnology and Pharmaceutical Industry End-User Segment

Recombinant Dna Market Analysis By End User

The biotechnology and pharmaceutical industry end-user segment is projected to hold 33.7% of the market revenue in 2025, establishing it as the leading end-user category. Growth is being driven by the increasing use of recombinant DNA technologies in research and development pipelines for novel therapeutics, biologics, and vaccines. Biotechnology and pharmaceutical companies are adopting these technologies to develop scalable, high-quality products while meeting regulatory standards and reducing development timelines.

Investment in advanced laboratory infrastructure, gene editing platforms, and automated production systems is further supporting adoption. The ability to leverage recombinant DNA for drug discovery, preclinical testing, and large-scale production improves operational efficiency and accelerates market entry.

Partnerships and collaborations between biotech firms, academic institutions, and pharmaceutical companies are expanding innovation and commercialization opportunities As demand for targeted therapies, biologics, and personalized medicine rises, the biotechnology and pharmaceutical industry segment is expected to maintain its leading position, driven by ongoing technological advancements and strategic investments in recombinant DNA applications.

Market Overview

Recombinant DNA Market Overview

Recombinant DNA technology or Genetic Engineering is a process in which creation and manipulation of DNA sequences in a specific order resulting in genetically modified organism and product. The recombinant DNA technology is a functional application of biotechnology that expanded to include innovative and expansive sciences such as genomics, applied immunology, development of pharmaceutical therapeutics and diagnostic tools.

There are several biological techniques used to make recombinant DNA. The potential usage of recombinant DNA in conventional and non- conventional application such as medicinal, agricultural and industrial. In medicine, Recombinant DNA has been used to mass-production of insulin, Follistim, human growth hormones, monoclonal antibodies, human albumin, vaccines, and other drugs.

The major recombinant DNA products available in the pharmaceutical market with high market share are insulin, vaccines, and monoclonal antibodies. Industrial applications include useful protein or enzyme production on a large scale The beginning of recombinant DNA technology directed a new platform for the production of a wide range of therapeutic agents in sufficient quantities for human use.

Over the past years, recombinant DNA Products has witnessed tremendous growth in medical field (production of recombinant drugs and therapeutics) and industrial segment (production of Enzyme and biochemicals). The overall global recombinant DNA market expected to shows prominent growth over the forecast period.
Analysis of Recombinant DNA Market By Key Countries

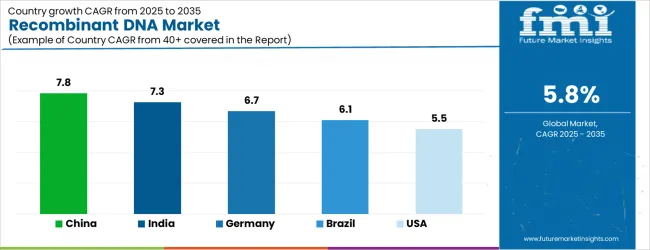
Recombinant Dna Market Cagr Analysis By Country

Country CAGR
China 7.8%
India 7.3%
Germany 6.7%
Brazil 6.1%
USA 5.5%
UK 4.9%
Japan 4.4%

Country-wise Analysis

The Recombinant DNA Market is expected to register a CAGR of 5.8% during the forecast period, exhibiting varied country level momentum. China leads with the highest CAGR of 7.8%, followed by India at 7.3%. Developed markets such as Germany, France, and the UK continue to expand steadily, while the USA is likely to grow at consistent rates. Japan posts the lowest CAGR at 4.4%, yet still underscores a broadly positive trajectory for the global Recombinant DNA Market. In 2024, Germany held a dominant revenue in the Western Europe market and is expected to grow with a CAGR of 6.7%. The USA Recombinant DNA Market is estimated to be valued at USD 263.2 billion in 2025 and is anticipated to reach a valuation of USD 263.2 billion by 2035. Sales are projected to rise at a CAGR of 0.0% over the forecast period between 2025 and 2035. While Japan and South Korea markets are estimated to be valued at USD 39.7 billion and USD 22.0 billion respectively in 2025.
Key Players in the Recombinant DNA Market

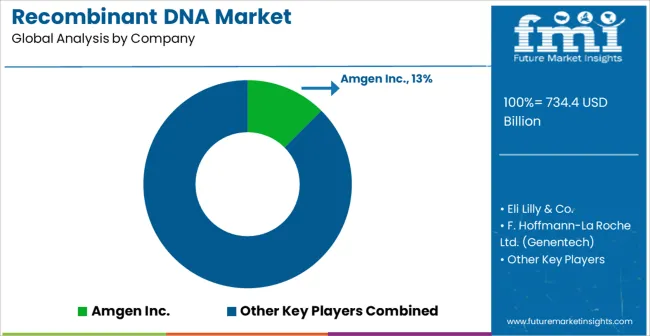
Recombinant Dna Market Analysis By Company

  • Amgen Inc.
  • Eli Lilly & Co.
  • F. Hoffmann-La Roche Ltd. (Genentech)
  • GenScript
  • Horizon Discovery
  • Merck KGaA
  • New England Biolabs
  • Novartis AG
  • Novo Nordisk A/S
  • Pfizer Inc.
  • Sanofi
  • Syngene International
  • Thermo Fisher Scientific

Scope of the Report

Item Value
Quantitative Units USD 734.4 Billion
Product Type Pharmaceutical, Vaccines, Recombinant Protein, Therapeutics Agents, Non-Pharmaceutical, Genetically Modified Crops, Biochemical, and Others
Application Healthcare, Food & Beverages, Agriculture, and Others
End User Biotechnology & Pharmaceutical Industry, Biochemical Industry, Research Laboratories & Academic Institutes, and Others
Regions Covered North America, Europe, Asia-Pacific, Latin America, Middle East & Africa
Country Covered United States, Canada, Germany, France, United Kingdom, China, Japan, India, Brazil, South Africa
Key Companies Profiled Amgen Inc., Eli Lilly & Co., F. Hoffmann-La Roche Ltd. (Genentech), GenScript, Horizon Discovery, Merck KGaA, New England Biolabs, Novartis AG, Novo Nordisk A/S, Pfizer Inc., Sanofi, Syngene International, and Thermo Fisher Scientific

Recombinant DNA Market by Segments

Product Type:

  • Pharmaceutical
  • Vaccines
  • Recombinant Protein
  • Therapeutics Agents
  • Non-Pharmaceutical
  • Genetically Modified Crops
  • Biochemical
  • Others

Application:

  • Healthcare
  • Food & Beverages
  • Agriculture
  • Others

End User:

  • Biotechnology & Pharmaceutical Industry
  • Biochemical Industry
  • Research Laboratories & Academic Institutes
  • Others

Region:

  • North America
    • USA
    • Canada
    • Mexico
  • Latin America
    • Brazil
    • Chile
    • Rest of Latin America
  • Western Europe
    • Germany
    • UK
    • Italy
    • Spain
    • France
    • Nordic
    • BENELUX
    • Rest of Western Europe
  • Eastern Europe
    • Russia
    • Poland
    • Hungary
    • Balkan & Baltic
    • Rest of Eastern Europe
  • East Asia
    • China
    • Japan
    • South Korea
  • South Asia and Pacific
    • India
    • ASEAN
    • Australia & New Zealand
    • Rest of South Asia and Pacific
  • Middle East & Africa
    • Kingdom of Saudi Arabia
    • Other GCC Countries
    • Turkiye
    • South Africa
    • Other African Union
    • Rest of Middle East & Africa

Table of Content

  1. Executive Summary
    • Global Market Outlook
    • Demand-side Trends
    • Supply-side Trends
    • Technology Roadmap Analysis
    • Analysis and Recommendations
  2. Market Overview
    • Market Coverage / Taxonomy
    • Market Definition / Scope / Limitations
  3. Market Background
    • Market Dynamics
      • Drivers
      • Restraints
      • Opportunity
      • Trends
    • Scenario Forecast
      • Demand in Optimistic Scenario
      • Demand in Likely Scenario
      • Demand in Conservative Scenario
    • Opportunity Map Analysis
    • Product Life Cycle Analysis
    • Supply Chain Analysis
    • Investment Feasibility Matrix
    • Value Chain Analysis
    • PESTLE and Porter’s Analysis
    • Regulatory Landscape
    • Regional Parent Market Outlook
    • Production and Consumption Statistics
    • Import and Export Statistics
  4. Global Market Analysis 2020 to 2024 and Forecast, 2025 to 2035
    • Historical Market Size Value (USD Million) Analysis, 2020 to 2024
    • Current and Future Market Size Value (USD Million) Projections, 2025 to 2035
      • Y-o-Y Growth Trend Analysis
      • Absolute $ Opportunity Analysis
  5. Global Market Pricing Analysis 2020 to 2024 and Forecast 2025 to 2035
  6. Global Market Analysis 2020 to 2024 and Forecast 2025 to 2035, By Product Type
    • Introduction / Key Findings
    • Historical Market Size Value (USD Million) Analysis By Product Type , 2020 to 2024
    • Current and Future Market Size Value (USD Million) Analysis and Forecast By Product Type , 2025 to 2035
      • Pharmaceutical
      • Vaccines
      • Recombinant Protein
      • Therapeutics Agents
      • Non-Pharmaceutical
      • Genetically Modified Crops
      • Biochemical
      • Others
    • Y-o-Y Growth Trend Analysis By Product Type , 2020 to 2024
    • Absolute $ Opportunity Analysis By Product Type , 2025 to 2035
  7. Global Market Analysis 2020 to 2024 and Forecast 2025 to 2035, By Application
    • Introduction / Key Findings
    • Historical Market Size Value (USD Million) Analysis By Application, 2020 to 2024
    • Current and Future Market Size Value (USD Million) Analysis and Forecast By Application, 2025 to 2035
      • Healthcare
      • Food & Beverages
      • Agriculture
      • Others
    • Y-o-Y Growth Trend Analysis By Application, 2020 to 2024
    • Absolute $ Opportunity Analysis By Application, 2025 to 2035
  8. Global Market Analysis 2020 to 2024 and Forecast 2025 to 2035, By End User
    • Introduction / Key Findings
    • Historical Market Size Value (USD Million) Analysis By End User, 2020 to 2024
    • Current and Future Market Size Value (USD Million) Analysis and Forecast By End User, 2025 to 2035
      • Biotechnology & Pharmaceutical Industry
      • Biochemical Industry
      • Research Laboratories & Academic Institutes
      • Others
    • Y-o-Y Growth Trend Analysis By End User, 2020 to 2024
    • Absolute $ Opportunity Analysis By End User, 2025 to 2035
  9. Global Market Analysis 2020 to 2024 and Forecast 2025 to 2035, By Region
    • Introduction
    • Historical Market Size Value (USD Million) Analysis By Region, 2020 to 2024
    • Current Market Size Value (USD Million) Analysis and Forecast By Region, 2025 to 2035
      • North America
      • Latin America
      • Western Europe
      • Eastern Europe
      • East Asia
      • South Asia and Pacific
      • Middle East & Africa
    • Market Attractiveness Analysis By Region
  10. North America Market Analysis 2020 to 2024 and Forecast 2025 to 2035, By Country
    • Historical Market Size Value (USD Million) Trend Analysis By Market Taxonomy, 2020 to 2024
    • Market Size Value (USD Million) Forecast By Market Taxonomy, 2025 to 2035
      • By Country
        • USA
        • Canada
        • Mexico
      • By Product Type
      • By Application
      • By End User
    • Market Attractiveness Analysis
      • By Country
      • By Product Type
      • By Application
      • By End User
    • Key Takeaways
  11. Latin America Market Analysis 2020 to 2024 and Forecast 2025 to 2035, By Country
    • Historical Market Size Value (USD Million) Trend Analysis By Market Taxonomy, 2020 to 2024
    • Market Size Value (USD Million) Forecast By Market Taxonomy, 2025 to 2035
      • By Country
        • Brazil
        • Chile
        • Rest of Latin America
      • By Product Type
      • By Application
      • By End User
    • Market Attractiveness Analysis
      • By Country
      • By Product Type
      • By Application
      • By End User
    • Key Takeaways
  12. Western Europe Market Analysis 2020 to 2024 and Forecast 2025 to 2035, By Country
    • Historical Market Size Value (USD Million) Trend Analysis By Market Taxonomy, 2020 to 2024
    • Market Size Value (USD Million) Forecast By Market Taxonomy, 2025 to 2035
      • By Country
        • Germany
        • UK
        • Italy
        • Spain
        • France
        • Nordic
        • BENELUX
        • Rest of Western Europe
      • By Product Type
      • By Application
      • By End User
    • Market Attractiveness Analysis
      • By Country
      • By Product Type
      • By Application
      • By End User
    • Key Takeaways
  13. Eastern Europe Market Analysis 2020 to 2024 and Forecast 2025 to 2035, By Country
    • Historical Market Size Value (USD Million) Trend Analysis By Market Taxonomy, 2020 to 2024
    • Market Size Value (USD Million) Forecast By Market Taxonomy, 2025 to 2035
      • By Country
        • Russia
        • Poland
        • Hungary
        • Balkan & Baltic
        • Rest of Eastern Europe
      • By Product Type
      • By Application
      • By End User
    • Market Attractiveness Analysis
      • By Country
      • By Product Type
      • By Application
      • By End User
    • Key Takeaways
  14. East Asia Market Analysis 2020 to 2024 and Forecast 2025 to 2035, By Country
    • Historical Market Size Value (USD Million) Trend Analysis By Market Taxonomy, 2020 to 2024
    • Market Size Value (USD Million) Forecast By Market Taxonomy, 2025 to 2035
      • By Country
        • China
        • Japan
        • South Korea
      • By Product Type
      • By Application
      • By End User
    • Market Attractiveness Analysis
      • By Country
      • By Product Type
      • By Application
      • By End User
    • Key Takeaways
  15. South Asia and Pacific Market Analysis 2020 to 2024 and Forecast 2025 to 2035, By Country
    • Historical Market Size Value (USD Million) Trend Analysis By Market Taxonomy, 2020 to 2024
    • Market Size Value (USD Million) Forecast By Market Taxonomy, 2025 to 2035
      • By Country
        • India
        • ASEAN
        • Australia & New Zealand
        • Rest of South Asia and Pacific
      • By Product Type
      • By Application
      • By End User
    • Market Attractiveness Analysis
      • By Country
      • By Product Type
      • By Application
      • By End User
    • Key Takeaways
  16. Middle East & Africa Market Analysis 2020 to 2024 and Forecast 2025 to 2035, By Country
    • Historical Market Size Value (USD Million) Trend Analysis By Market Taxonomy, 2020 to 2024
    • Market Size Value (USD Million) Forecast By Market Taxonomy, 2025 to 2035
      • By Country
        • Kingdom of Saudi Arabia
        • Other GCC Countries
        • Turkiye
        • South Africa
        • Other African Union
        • Rest of Middle East & Africa
      • By Product Type
      • By Application
      • By End User
    • Market Attractiveness Analysis
      • By Country
      • By Product Type
      • By Application
      • By End User
    • Key Takeaways
  17. Key Countries Market Analysis
    • USA
      • Pricing Analysis
      • Market Share Analysis, 2024
        • By Product Type
        • By Application
        • By End User
    • Canada
      • Pricing Analysis
      • Market Share Analysis, 2024
        • By Product Type
        • By Application
        • By End User
    • Mexico
      • Pricing Analysis
      • Market Share Analysis, 2024
        • By Product Type
        • By Application
        • By End User
    • Brazil
      • Pricing Analysis
      • Market Share Analysis, 2024
        • By Product Type
        • By Application
        • By End User
    • Chile
      • Pricing Analysis
      • Market Share Analysis, 2024
        • By Product Type
        • By Application
        • By End User
    • Germany
      • Pricing Analysis
      • Market Share Analysis, 2024
        • By Product Type
        • By Application
        • By End User
    • UK
      • Pricing Analysis
      • Market Share Analysis, 2024
        • By Product Type
        • By Application
        • By End User
    • Italy
      • Pricing Analysis
      • Market Share Analysis, 2024
        • By Product Type
        • By Application
        • By End User
    • Spain
      • Pricing Analysis
      • Market Share Analysis, 2024
        • By Product Type
        • By Application
        • By End User
    • France
      • Pricing Analysis
      • Market Share Analysis, 2024
        • By Product Type
        • By Application
        • By End User
    • India
      • Pricing Analysis
      • Market Share Analysis, 2024
        • By Product Type
        • By Application
        • By End User
    • ASEAN
      • Pricing Analysis
      • Market Share Analysis, 2024
        • By Product Type
        • By Application
        • By End User
    • Australia & New Zealand
      • Pricing Analysis
      • Market Share Analysis, 2024
        • By Product Type
        • By Application
        • By End User
    • China
      • Pricing Analysis
      • Market Share Analysis, 2024
        • By Product Type
        • By Application
        • By End User
    • Japan
      • Pricing Analysis
      • Market Share Analysis, 2024
        • By Product Type
        • By Application
        • By End User
    • South Korea
      • Pricing Analysis
      • Market Share Analysis, 2024
        • By Product Type
        • By Application
        • By End User
    • Russia
      • Pricing Analysis
      • Market Share Analysis, 2024
        • By Product Type
        • By Application
        • By End User
    • Poland
      • Pricing Analysis
      • Market Share Analysis, 2024
        • By Product Type
        • By Application
        • By End User
    • Hungary
      • Pricing Analysis
      • Market Share Analysis, 2024
        • By Product Type
        • By Application
        • By End User
    • Kingdom of Saudi Arabia
      • Pricing Analysis
      • Market Share Analysis, 2024
        • By Product Type
        • By Application
        • By End User
    • Turkiye
      • Pricing Analysis
      • Market Share Analysis, 2024
        • By Product Type
        • By Application
        • By End User
    • South Africa
      • Pricing Analysis
      • Market Share Analysis, 2024
        • By Product Type
        • By Application
        • By End User
  18. Market Structure Analysis
    • Competition Dashboard
    • Competition Benchmarking
    • Market Share Analysis of Top Players
      • By Regional
      • By Product Type
      • By Application
      • By End User
  19. Competition Analysis
    • Competition Deep Dive
      • Amgen Inc.
        • Overview
        • Product Portfolio
        • Profitability by Market Segments (Product/Age /Sales Channel/Region)
        • Sales Footprint
        • Strategy Overview
          • Marketing Strategy
          • Product Strategy
          • Channel Strategy
      • Eli Lilly & Co.
      • F. Hoffmann-La Roche Ltd. (Genentech)
      • GenScript
      • Horizon Discovery
      • Merck KGaA
      • New England Biolabs
      • Novartis AG
      • Novo Nordisk A/S
      • Pfizer Inc.
      • Sanofi
      • Syngene International
      • Thermo Fisher Scientific
  20. Assumptions & Acronyms Used
  21. Research Methodology

List of Tables

  • Table 1: Global Market Value (USD Million) Forecast by Region, 2020-2035
  • Table 2: Global Market Value (USD Million) Forecast by Product Type , 2020-2035
  • Table 3: Global Market Value (USD Million) Forecast by Application, 2020-2035
  • Table 4: Global Market Value (USD Million) Forecast by End User, 2020-2035
  • Table 5: North America Market Value (USD Million) Forecast by Country, 2020-2035
  • Table 6: North America Market Value (USD Million) Forecast by Product Type , 2020-2035
  • Table 7: North America Market Value (USD Million) Forecast by Application, 2020-2035
  • Table 8: North America Market Value (USD Million) Forecast by End User, 2020-2035
  • Table 9: Latin America Market Value (USD Million) Forecast by Country, 2020-2035
  • Table 10: Latin America Market Value (USD Million) Forecast by Product Type , 2020-2035
  • Table 11: Latin America Market Value (USD Million) Forecast by Application, 2020-2035
  • Table 12: Latin America Market Value (USD Million) Forecast by End User, 2020-2035
  • Table 13: Western Europe Market Value (USD Million) Forecast by Country, 2020-2035
  • Table 14: Western Europe Market Value (USD Million) Forecast by Product Type , 2020-2035
  • Table 15: Western Europe Market Value (USD Million) Forecast by Application, 2020-2035
  • Table 16: Western Europe Market Value (USD Million) Forecast by End User, 2020-2035
  • Table 17: Eastern Europe Market Value (USD Million) Forecast by Country, 2020-2035
  • Table 18: Eastern Europe Market Value (USD Million) Forecast by Product Type , 2020-2035
  • Table 19: Eastern Europe Market Value (USD Million) Forecast by Application, 2020-2035
  • Table 20: Eastern Europe Market Value (USD Million) Forecast by End User, 2020-2035
  • Table 21: East Asia Market Value (USD Million) Forecast by Country, 2020-2035
  • Table 22: East Asia Market Value (USD Million) Forecast by Product Type , 2020-2035
  • Table 23: East Asia Market Value (USD Million) Forecast by Application, 2020-2035
  • Table 24: East Asia Market Value (USD Million) Forecast by End User, 2020-2035
  • Table 25: South Asia and Pacific Market Value (USD Million) Forecast by Country, 2020-2035
  • Table 26: South Asia and Pacific Market Value (USD Million) Forecast by Product Type , 2020-2035
  • Table 27: South Asia and Pacific Market Value (USD Million) Forecast by Application, 2020-2035
  • Table 28: South Asia and Pacific Market Value (USD Million) Forecast by End User, 2020-2035
  • Table 29: Middle East & Africa Market Value (USD Million) Forecast by Country, 2020-2035
  • Table 30: Middle East & Africa Market Value (USD Million) Forecast by Product Type , 2020-2035
  • Table 31: Middle East & Africa Market Value (USD Million) Forecast by Application, 2020-2035
  • Table 32: Middle East & Africa Market Value (USD Million) Forecast by End User, 2020-2035

List of Figures

  • Figure 1: Global Market Pricing Analysis
  • Figure 2: Global Market Value (USD Million) Forecast 2020-2035
  • Figure 3: Global Market Value Share and BPS Analysis by Product Type , 2025 and 2035
  • Figure 4: Global Market Y-o-Y Growth Comparison by Product Type , 2025-2035
  • Figure 5: Global Market Attractiveness Analysis by Product Type
  • Figure 6: Global Market Value Share and BPS Analysis by Application, 2025 and 2035
  • Figure 7: Global Market Y-o-Y Growth Comparison by Application, 2025-2035
  • Figure 8: Global Market Attractiveness Analysis by Application
  • Figure 9: Global Market Value Share and BPS Analysis by End User, 2025 and 2035
  • Figure 10: Global Market Y-o-Y Growth Comparison by End User, 2025-2035
  • Figure 11: Global Market Attractiveness Analysis by End User
  • Figure 12: Global Market Value (USD Million) Share and BPS Analysis by Region, 2025 and 2035
  • Figure 13: Global Market Y-o-Y Growth Comparison by Region, 2025-2035
  • Figure 14: Global Market Attractiveness Analysis by Region
  • Figure 15: North America Market Incremental Dollar Opportunity, 2025-2035
  • Figure 16: Latin America Market Incremental Dollar Opportunity, 2025-2035
  • Figure 17: Western Europe Market Incremental Dollar Opportunity, 2025-2035
  • Figure 18: Eastern Europe Market Incremental Dollar Opportunity, 2025-2035
  • Figure 19: East Asia Market Incremental Dollar Opportunity, 2025-2035
  • Figure 20: South Asia and Pacific Market Incremental Dollar Opportunity, 2025-2035
  • Figure 21: Middle East & Africa Market Incremental Dollar Opportunity, 2025-2035
  • Figure 22: North America Market Value Share and BPS Analysis by Country, 2025 and 2035
  • Figure 23: North America Market Value Share and BPS Analysis by Product Type , 2025 and 2035
  • Figure 24: North America Market Y-o-Y Growth Comparison by Product Type , 2025-2035
  • Figure 25: North America Market Attractiveness Analysis by Product Type
  • Figure 26: North America Market Value Share and BPS Analysis by Application, 2025 and 2035
  • Figure 27: North America Market Y-o-Y Growth Comparison by Application, 2025-2035
  • Figure 28: North America Market Attractiveness Analysis by Application
  • Figure 29: North America Market Value Share and BPS Analysis by End User, 2025 and 2035
  • Figure 30: North America Market Y-o-Y Growth Comparison by End User, 2025-2035
  • Figure 31: North America Market Attractiveness Analysis by End User
  • Figure 32: Latin America Market Value Share and BPS Analysis by Country, 2025 and 2035
  • Figure 33: Latin America Market Value Share and BPS Analysis by Product Type , 2025 and 2035
  • Figure 34: Latin America Market Y-o-Y Growth Comparison by Product Type , 2025-2035
  • Figure 35: Latin America Market Attractiveness Analysis by Product Type
  • Figure 36: Latin America Market Value Share and BPS Analysis by Application, 2025 and 2035
  • Figure 37: Latin America Market Y-o-Y Growth Comparison by Application, 2025-2035
  • Figure 38: Latin America Market Attractiveness Analysis by Application
  • Figure 39: Latin America Market Value Share and BPS Analysis by End User, 2025 and 2035
  • Figure 40: Latin America Market Y-o-Y Growth Comparison by End User, 2025-2035
  • Figure 41: Latin America Market Attractiveness Analysis by End User
  • Figure 42: Western Europe Market Value Share and BPS Analysis by Country, 2025 and 2035
  • Figure 43: Western Europe Market Value Share and BPS Analysis by Product Type , 2025 and 2035
  • Figure 44: Western Europe Market Y-o-Y Growth Comparison by Product Type , 2025-2035
  • Figure 45: Western Europe Market Attractiveness Analysis by Product Type
  • Figure 46: Western Europe Market Value Share and BPS Analysis by Application, 2025 and 2035
  • Figure 47: Western Europe Market Y-o-Y Growth Comparison by Application, 2025-2035
  • Figure 48: Western Europe Market Attractiveness Analysis by Application
  • Figure 49: Western Europe Market Value Share and BPS Analysis by End User, 2025 and 2035
  • Figure 50: Western Europe Market Y-o-Y Growth Comparison by End User, 2025-2035
  • Figure 51: Western Europe Market Attractiveness Analysis by End User
  • Figure 52: Eastern Europe Market Value Share and BPS Analysis by Country, 2025 and 2035
  • Figure 53: Eastern Europe Market Value Share and BPS Analysis by Product Type , 2025 and 2035
  • Figure 54: Eastern Europe Market Y-o-Y Growth Comparison by Product Type , 2025-2035
  • Figure 55: Eastern Europe Market Attractiveness Analysis by Product Type
  • Figure 56: Eastern Europe Market Value Share and BPS Analysis by Application, 2025 and 2035
  • Figure 57: Eastern Europe Market Y-o-Y Growth Comparison by Application, 2025-2035
  • Figure 58: Eastern Europe Market Attractiveness Analysis by Application
  • Figure 59: Eastern Europe Market Value Share and BPS Analysis by End User, 2025 and 2035
  • Figure 60: Eastern Europe Market Y-o-Y Growth Comparison by End User, 2025-2035
  • Figure 61: Eastern Europe Market Attractiveness Analysis by End User
  • Figure 62: East Asia Market Value Share and BPS Analysis by Country, 2025 and 2035
  • Figure 63: East Asia Market Value Share and BPS Analysis by Product Type , 2025 and 2035
  • Figure 64: East Asia Market Y-o-Y Growth Comparison by Product Type , 2025-2035
  • Figure 65: East Asia Market Attractiveness Analysis by Product Type
  • Figure 66: East Asia Market Value Share and BPS Analysis by Application, 2025 and 2035
  • Figure 67: East Asia Market Y-o-Y Growth Comparison by Application, 2025-2035
  • Figure 68: East Asia Market Attractiveness Analysis by Application
  • Figure 69: East Asia Market Value Share and BPS Analysis by End User, 2025 and 2035
  • Figure 70: East Asia Market Y-o-Y Growth Comparison by End User, 2025-2035
  • Figure 71: East Asia Market Attractiveness Analysis by End User
  • Figure 72: South Asia and Pacific Market Value Share and BPS Analysis by Country, 2025 and 2035
  • Figure 73: South Asia and Pacific Market Value Share and BPS Analysis by Product Type , 2025 and 2035
  • Figure 74: South Asia and Pacific Market Y-o-Y Growth Comparison by Product Type , 2025-2035
  • Figure 75: South Asia and Pacific Market Attractiveness Analysis by Product Type
  • Figure 76: South Asia and Pacific Market Value Share and BPS Analysis by Application, 2025 and 2035
  • Figure 77: South Asia and Pacific Market Y-o-Y Growth Comparison by Application, 2025-2035
  • Figure 78: South Asia and Pacific Market Attractiveness Analysis by Application
  • Figure 79: South Asia and Pacific Market Value Share and BPS Analysis by End User, 2025 and 2035
  • Figure 80: South Asia and Pacific Market Y-o-Y Growth Comparison by End User, 2025-2035
  • Figure 81: South Asia and Pacific Market Attractiveness Analysis by End User
  • Figure 82: Middle East & Africa Market Value Share and BPS Analysis by Country, 2025 and 2035
  • Figure 83: Middle East & Africa Market Value Share and BPS Analysis by Product Type , 2025 and 2035
  • Figure 84: Middle East & Africa Market Y-o-Y Growth Comparison by Product Type , 2025-2035
  • Figure 85: Middle East & Africa Market Attractiveness Analysis by Product Type
  • Figure 86: Middle East & Africa Market Value Share and BPS Analysis by Application, 2025 and 2035
  • Figure 87: Middle East & Africa Market Y-o-Y Growth Comparison by Application, 2025-2035
  • Figure 88: Middle East & Africa Market Attractiveness Analysis by Application
  • Figure 89: Middle East & Africa Market Value Share and BPS Analysis by End User, 2025 and 2035
  • Figure 90: Middle East & Africa Market Y-o-Y Growth Comparison by End User, 2025-2035
  • Figure 91: Middle East & Africa Market Attractiveness Analysis by End User
  • Figure 92: Global Market - Tier Structure Analysis
  • Figure 93: Global Market - Company Share Analysis

Frequently Asked Questions

How big is the recombinant DNA market in 2025?

The global recombinant DNA market is estimated to be valued at USD 734.4 billion in 2025.

What will be the size of recombinant DNA market in 2035?

The market size for the recombinant DNA market is projected to reach USD 1,291.9 billion by 2035.

How much will be the recombinant DNA market growth between 2025 and 2035?

The recombinant DNA market is expected to grow at a 5.8% CAGR between 2025 and 2035.

What are the key product types in the recombinant DNA market?

The key product types in recombinant DNA market are pharmaceutical, vaccines, recombinant protein, therapeutics agents, non-pharmaceutical, genetically modified crops, biochemical and others.

Which application segment to contribute significant share in the recombinant DNA market in 2025?

In terms of application, healthcare segment to command 41.2% share in the recombinant DNA market in 2025.

Explore Similar Insights

Future Market Insights

Recombinant DNA Market

Chat With MaRIA

Chat With

MaRIA

Hi There, I am MaRIA, Your Market Research Intelligence Assistant. How may I help you?