The global luxury packaging market is valued at USD 16,720 million in 2025 and is set to reach USD 30,226.7 million by 2035, which shows a CAGR of 6.1%. The market stands at the forefront of a transformative decade that promises to redefine premium product presentation infrastructure and brand excellence across consumer goods, beverage sectors, and high-end retail applications. The market's journey from USD 16,720 million in 2025 to USD 30,226.7 million by 2035 represents substantial growth, demonstrating the accelerating adoption of sophisticated packaging solutions and premium presentation systems across spirits, cosmetics, jewelry, confectionery, and luxury consumer goods sectors.
According to FMI’s report series on packaging circularity and compliance under EU and US regulatory frameworks, the first half of the decade (2025-2030) will witness the market climbing from USD 16,720 million to approximately USD 21,745 million, adding USD 5,025 million in value, which constitutes 37% of the total forecast growth period. This phase will be characterized by the rapid adoption of artisanal packaging systems, driven by increasing demand for brand differentiation materials and exceptional tactile experiences worldwide. Superior material craftsmanship capabilities and intricate finishing features will become standard expectations rather than premium options.
The latter half (2030-2035) will witness sustained growth from USD 21,745 million to USD 30,226.7 million, representing an addition of USD 8,440 million or 63% of the decade's expansion. This period will be defined by mass market penetration of ultra-premium packaging systems, integration with comprehensive brand storytelling platforms, and seamless compatibility with existing retail infrastructure. The market trajectory signals fundamental shifts in how luxury brands and premium manufacturers approach product presentation solutions, with participants positioned to benefit from sustained demand across multiple application segments.
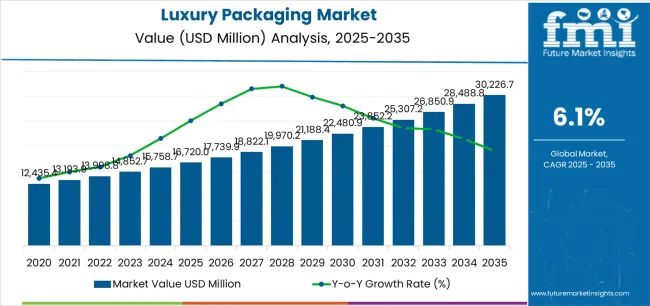
The luxury packaging market demonstrates distinct growth phases with varying market characteristics and competitive dynamics. Between 2025 and 2030, the market progresses through its premium adoption phase, expanding from USD 16,720 million to USD 21,745 million with steady annual increments averaging 5.4% growth. This period showcases the transition from standard packaging solutions to advanced systems with enhanced material quality and integrated brand narrative becoming mainstream features.
The 2025-2030 phase adds USD 5,025 million to market value, representing 37% of total decade expansion. Market maturation factors include standardization of ultra-premium packaging protocols, declining component costs for specialty decoration techniques, and increasing brand awareness of luxury packaging benefits reaching 82-87% effectiveness in high-end retail applications. Competitive landscape evolution during this period features established manufacturers like Ardagh Group S.A. and Owens-Illinois Inc. expanding their prestige packaging portfolios while new entrants focus on specialized artisanal production and enhanced material innovation.
From 2030 to 2035, market dynamics shift toward advanced customization and omnichannel deployment, with growth accelerating from USD 21,745 million to USD 30,226.7 million, adding USD 8,440 million or 63% of total expansion. This phase transition logic centers on universal luxury packaging systems, integration with digital authentication platforms, and deployment across diverse premium scenarios, becoming standard rather than specialized applications. The competitive environment matures with focus shifting from basic material quality to comprehensive sensory experience systems and integration with brand heritage storytelling.
| Metric | Value |
|---|---|
| Market Value (2025) | USD 16,720 million |
| Market Forecast (2035) | USD 30,226.7 million |
| Growth Rate | 6.10% CAGR |
| Leading Technology | Glass & Crystal |
| Primary Application | Spirits & Wine Segment |
The market demonstrates strong fundamentals with glass & crystal systems capturing a dominant share through exceptional visual clarity and reliable material prestige. Spirits and wine applications drive primary demand, supported by increasing brand spending on premium packaging systems and consumer experience management solutions. Geographic expansion remains concentrated in developed markets with established luxury beverage infrastructure, while emerging economies show accelerating adoption rates driven by premium brand expansion and rising affluent consumer segments.
The luxury packaging market represents a compelling intersection of premium material innovation, brand heritage preservation, and consumer sensory management. With robust growth projected from USD 16,720 million in 2025 to USD 30,226.7 million by 2035 at a 6.10% CAGR, this market is driven by increasing brand differentiation requirements, artisanal craftsmanship demand, and consumer expectation for exceptional tactile experiences.
The market's expansion reflects a fundamental shift in how luxury brands and premium manufacturers approach packaging infrastructure. Strong growth opportunities exist across diverse applications, from spirits operations requiring sophisticated bottle design to cosmetics facilities demanding maximum aesthetic impact and material excellence. Geographic expansion is particularly pronounced in Asia-Pacific markets, led by China (7.4% CAGR) and India (7.0% CAGR), while established markets in North America and Europe drive innovation and ultra-premium segment development.
The dominance of glass & crystal systems and spirits applications underscores the importance of proven material prestige and sensory excellence in driving adoption. Production complexity and cost considerations remain key challenges, creating opportunities for companies that can deliver exceptional quality while maintaining operational efficiency.
Market expansion rests on three fundamental shifts driving adoption across beverage and consumer goods sectors. 1. Brand heritage amplification creates compelling competitive advantages through luxury packaging systems that provide immediate prestige perception with exceptional material quality, enabling brands to enhance product value while maintaining customer loyalty and justifying ultra-premium pricing. 2. Affluent consumer expansion accelerates as wealthy demographics worldwide seek authentic luxury experiences that deliver craftsmanship appreciation directly through packaging interaction, enabling premium brand differentiation that aligns with status positioning and quality expectations. 3. Premiumization trend drives adoption from spirits and cosmetics brands requiring sophisticated material solutions that maximize brand storytelling while maintaining exceptional presentation integrity during retail display and consumer ownership.
However, growth faces headwinds from production cost challenges that vary across brand segments regarding artisanal material investments and decoration requirements, potentially limiting deployment flexibility in emerging premium categories. Supply chain complexity also persists regarding specialty material sourcing and skilled craftsman availability that may increase lead times in custom applications with demanding quality standards.
Primary Classification: The market segments by product type into glass & crystal, metal packaging, wood & lacquer, and specialty materials categories, representing the evolution from traditional luxury materials to advanced artisanal substrates for comprehensive premium packaging operations.
Secondary Breakdown: Application segmentation divides the market into spirits & wine, cosmetics & fragrances, jewelry & timepieces, confectionery & gourmet foods, tobacco products, and others sectors, reflecting distinct requirements for material prestige, protection integration, and brand heritage communication.
Regional Classification: Geographic distribution covers North America, Europe, Asia Pacific, Latin America, and the Middle East & Africa, with developed markets leading craftsmanship innovation while emerging economies show accelerating growth patterns driven by luxury consumption expansion programs.
The segmentation structure reveals technology progression from standard premium materials toward integrated multi-sensory platforms with enhanced decoration and artisanal production capabilities, while application diversity spans from spirits operations to jewelry facilities requiring precise material selection and heritage presentation solutions.
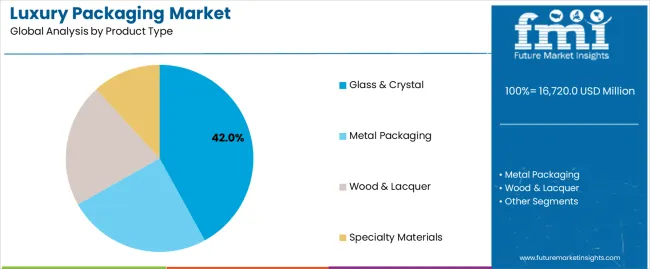
Glass & crystal segment is estimated to account for 42% of the luxury packaging market share in 2025. The segment's leading position stems from its fundamental role as a critical component in premium beverage applications and its extensive use across multiple luxury goods sectors. Glass & crystal's dominance is attributed to its superior visual clarity, including light refraction properties, weight perception, and tactile quality capabilities that make it indispensable for high-end packaging operations.
Market Position: Glass & crystal systems command the leading position in the luxury packaging market through advanced material features, including comprehensive decoration compatibility, structural elegance, and reliable heritage association that enable brands to deploy sophisticated presentation solutions across diverse retail environments.
Value Drivers: The segment benefits from brand preference for proven prestige materials that provide exceptional sensory impact without requiring synthetic alternatives. Reliable production processes enable deployment in spirits packaging, fragrance presentation, and retail applications where material authenticity and visual brilliance represent critical brand requirements.
Competitive Advantages: Glass & crystal systems differentiate through excellent decoration receptivity, proven luxury perception, and compatibility with artisanal production techniques that enhance brand heritage while maintaining ultra-premium operational profiles suitable for diverse luxury applications.
Key market characteristics:
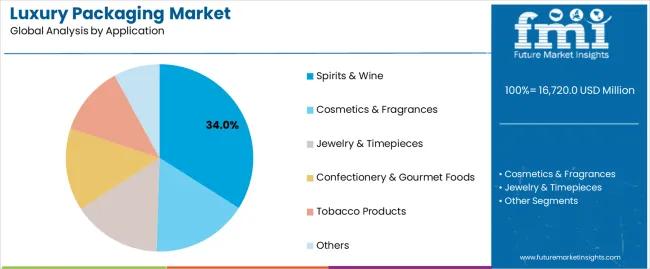
Spirits & wine segment is projected to hold 34% of the luxury packaging market share in 2025. The segment's market leadership is driven by the extensive use of luxury packaging in premium beverage bottling, limited edition releases, collector series, and brand launches, where packaging serves as both a protective container and heritage statement. The spirits industry's consistent investment in prestige packaging materials supports the segment's dominant position.
Market Context: Spirits applications dominate the market due to widespread adoption of luxury material systems and increasing focus on bottle design excellence, brand differentiation, and retail presence applications that enhance prestige perception while maintaining product protection.
Appeal Factors: Beverage brands prioritize packaging material quality, artisanal production, and integration with brand heritage strategies that enable coordinated deployment across multiple distribution channels. The segment benefits from substantial marketing investments and collector market dynamics that emphasize premium presentation for retail and auction operations.
Growth Drivers: Brand repositioning programs incorporate luxury packaging as standard material for ultra-premium spirits and limited edition collections. At the same time, beverage industry initiatives are increasing demand for distinctive packaging that complies with authenticity standards and enhances consumer appreciation.
Market Challenges: Production lead times and minimum order quantities may limit deployment flexibility in smaller distilleries or experimental release scenarios.
Application dynamics include:
Growth Accelerators: Premium brand differentiation drives primary adoption as luxury packaging systems provide exceptional material prestige that enables product positioning without excessive marketing costs, supporting brand equity and consumer loyalty that require authentic craftsmanship experiences. Affluent consumer growth accelerates market expansion as high-net-worth individuals seek genuine luxury materials that maintain heritage aesthetics during ownership while enhancing collection value through exceptional presentation experiences. Marketing investment increases worldwide, creating sustained demand for sophisticated packaging systems that complement ultra-premium products and provide competitive advantages in crowded prestige environments.
Growth Inhibitors: Artisanal production challenges vary across brand segments regarding skilled labor investments and decoration requirements, which may limit market penetration and profit margins in emerging premium categories with moderate pricing flexibility. Material sourcing complexity persists regarding specialty substrate availability and quality consistency that may increase lead times in custom applications with demanding aesthetic standards. Market fragmentation across multiple luxury traditions and regional preferences creates compatibility concerns between different packaging suppliers and existing brand heritage infrastructure.
Market Evolution Patterns: Adoption accelerates in spirits and fragrance sectors where material authenticity justifies production costs, with geographic concentration in developed markets transitioning toward mainstream adoption in emerging economies driven by luxury consumption growth and premium brand expansion. Technology development focuses on enhanced artisanal techniques, improved material innovation, and integration with authentication platforms that optimize brand heritage and consumer verification. The market could face disruption if alternative premium materials or production innovations significantly challenge traditional luxury material advantages in prestige applications.
The luxury packaging market demonstrates varied regional dynamics with Growth Leaders including China (7.4% CAGR) and India (7.0% CAGR) driving expansion through luxury consumption growth and affluent demographics development. Steady Performers encompass the USA (6.7% CAGR), France (5.9% CAGR), and Japan (5.5% CAGR), benefiting from established heritage brands and premium packaging adoption.
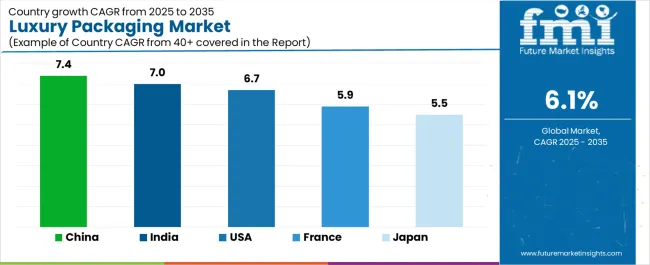
| Country | CAGR (2025-2035) |
|---|---|
| China | 7.4% |
| India | 7.0% |
| USA | 6.7% |
| France | 5.9% |
| Japan | 5.5% |
Regional synthesis reveals Asia-Pacific markets leading growth through luxury consumption expansion and affluent demographics development, while European countries maintain steady expansion supported by heritage luxury brands and artisanal production requirements. North American markets show strong growth driven by premium spirits applications and ultra-premium product launches.
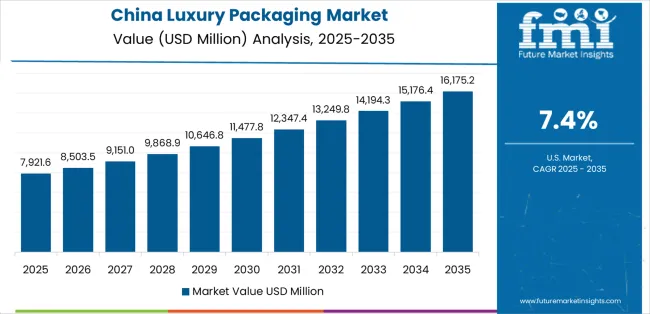
China establishes regional leadership through explosive luxury consumption expansion and comprehensive affluent demographics development, integrating advanced luxury packaging systems as standard components in prestige spirits and premium product applications. The country's 7.4% CAGR through 2035 reflects government initiatives promoting domestic consumption upgrading and imported luxury product demand that mandate the use of premium packaging systems in high-end retail operations. Growth concentrates in major urban centers, including Shanghai, Beijing, and Guangzhou, where luxury retail expansion showcases integrated prestige packaging systems that appeal to domestic consumers seeking sophisticated brand experiences and international quality standards.
Chinese luxury consumption patterns are driving innovative packaging requirements that combine international material excellence with cultural aesthetic preferences, including ceremonial presentation systems and gift-worthy decoration capabilities.
Strategic Market Indicators:
The Indian market emphasizes celebration and ceremonial applications, including rapid luxury consumption development and comprehensive affluent demographics growth that increasingly incorporates luxury packaging for premium product presentation and gift-worthy packaging applications. The country is projected to show a 7.0% CAGR through 2035, driven by massive middle-class expansion under economic development programs and commercial demand for distinctive, high-quality packaging systems. Indian luxury facilities prioritize material excellence with luxury packaging delivering memorable experiences through artisanal craftsmanship and cultural design integration capabilities.
Technology deployment channels include major retail chains, specialized importers, and brand distribution programs that support premium packaging for luxury applications.
Performance Metrics:
The UAS market emphasizes advanced luxury packaging features, including innovative material combinations and integration with comprehensive brand storytelling platforms that manage product presentation, collector appeal, and heritage communication applications through unified packaging systems. The country is projected to show a 6.7% CAGR through 2035, driven by craft spirits revolution under premium beverage launches and commercial demand for distinctive, memorable packaging systems. American luxury brands prioritize material authenticity with packaging delivering exceptional presentation through innovative decoration techniques and artisanal production methods.
Technology deployment channels include major packaging suppliers, specialized luxury bottle manufacturers, and brand procurement programs that support custom development for premium retail operations.
Performance Metrics:
In Cognac, Champagne, and Paris, French luxury brands and premium beverage producers are implementing advanced luxury packaging systems to enhance brand heritage capabilities and support tradition preservation that aligns with artisanal craftsmanship requirements and authenticity protocols. The French market demonstrates sustained growth with a 5.9% CAGR through 2035, driven by heritage brand modernization programs and premium packaging investments that emphasize sophisticated material systems for spirits and fragrance applications. French luxury facilities are prioritizing packaging systems that provide exceptional material prestige while maintaining compliance with appellation standards and minimizing production inconsistencies, particularly important in heritage cognac and prestige champagne operations.
Market expansion benefits from protected designation programs that mandate premium packaging in brand specifications, creating sustained demand across France's spirits and luxury goods sectors, where material quality and artisanal production represent critical requirements.
Strategic Market Indicators:
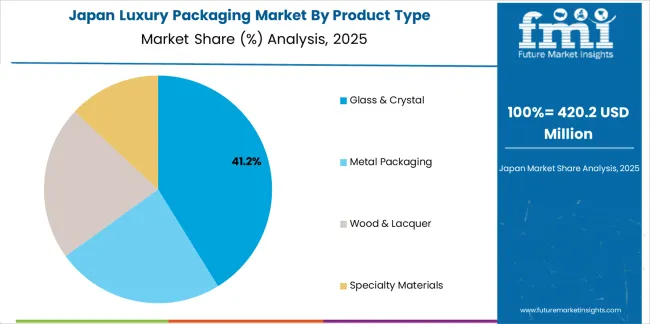
Japan's sophisticated luxury market demonstrates meticulous packaging deployment, growing at 5.5% CAGR, with documented operational excellence in whisky packaging and premium gift applications through integration with existing retail systems and quality control infrastructure. The country leverages manufacturing expertise in precision craftsmanship and attention to detail to maintain market leadership. Luxury centers, including Tokyo, Osaka, and Kyoto, showcase premium installations where packaging systems integrate with comprehensive brand platforms and presentation protocols to optimize product prestige and consumer appreciation.
Japanese luxury brands prioritize material perfection and aesthetic harmony in packaging development, creating demand for flawless systems with advanced features, including precise production tolerances and integration with ceremonial presentation protocols. The market benefits from established luxury infrastructure and willingness to invest in premium packaging technologies that provide superior brand perception and cultural alignment.
Market Intelligence Brief:
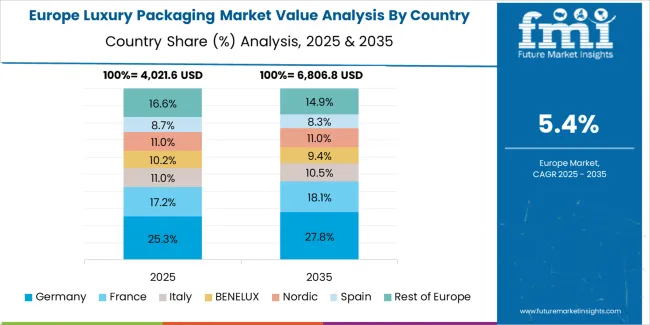
The luxury packaging market in Europe is projected to grow from USD 4,985 million in 2025 to USD 8,346 million by 2035, registering a CAGR of 5.3% over the forecast period. France is expected to maintain its leadership position with a 38.2% market share in 2025, declining slightly to 37.9% by 2035, supported by its heritage spirits brands and major luxury centers, including Paris and Cognac.
Italy follows with a 24.5% share in 2025, projected to reach 24.8% by 2035, driven by comprehensive perfume packaging and fashion presentation initiatives. The United Kingdom holds a 16.7% share in 2025, expected to maintain 16.9% by 2035 through established prestige spirits sectors and premium beverage adoption. Germany commands a 11.4% share, while Spain accounts for 7.3% in 2025. The Rest of Europe region is anticipated to gain momentum, expanding its collective share from 1.9% to 2.3% by 2035, attributed to increasing luxury adoption in Nordic countries and emerging Eastern European premium beverage facilities implementing sophisticated packaging programs.
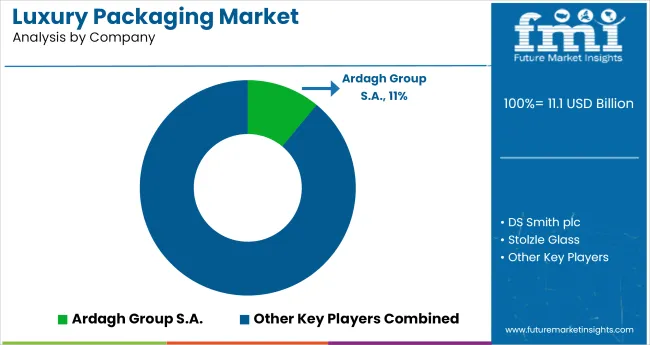
The luxury packaging market operates with moderate concentration, featuring approximately 22-30 participants, where leading companies control roughly 45-52% of the global market share through established luxury brand relationships and comprehensive artisanal production capabilities. Competition emphasizes material innovation, craftsmanship quality, and customization flexibility rather than price-based rivalry.
Market leaders encompass Ardagh Group S.A., Owens-Illinois Inc., and Gerresheimer AG, which maintain competitive advantages through extensive material expertise, global production networks, and comprehensive decoration engineering capabilities that create brand loyalty and support premium pricing. These companies leverage decades of luxury packaging experience and ongoing innovation investments to develop advanced systems with exceptional material quality and artisanal features.
Specialty challengers include Verallia, Saverglass, and Pochet Group, which compete through specialized luxury packaging focus and innovative decoration solutions that appeal to premium brands seeking distinctive material capabilities and rapid prototype flexibility. These companies differentiate through hand-crafted production emphasis and specialized spirits application focus.
Market dynamics favor participants that combine reliable material quality with advanced customization support, including design consultation and artisanal production capabilities. Competitive pressure intensifies as traditional packaging manufacturers expand into luxury systems. At the same time, specialized prestige packaging companies challenge established players through innovative decoration solutions and cost-effective artisanal production targeting emerging luxury segments.
| Item | Value |
|---|---|
| Quantitative Units | USD 16,720 million |
| Product Type | Glass & Crystal, Metal Packaging, Wood & Lacquer, Specialty Materials |
| Application | Spirits & Wine, Cosmetics & Fragrances, Jewelry & Timepieces, Confectionery & Gourmet Foods, Tobacco Products, Others |
| Regions Covered | North America, Europe, Asia Pacific, Latin America, Middle East & Africa |
| Countries Covered | USA, France, Japan, China, India, and 25+ additional countries |
| Key Companies Profiled | Ardagh Group S.A., Owens-Illinois Inc., Gerresheimer AG, Verallia, Saverglass, Pochet Group |
| Additional Attributes | Dollar sales by product type and application categories, regional adoption trends across North America, Europe, and Asia-Pacific, competitive landscape with luxury packaging manufacturers and artisanal suppliers, brand preferences for material quality and craftsmanship excellence, integration with authentication platforms and heritage systems, innovations in decoration technology and material development, and advancement of premium production solutions with enhanced prestige and artisanal capabilities |
The global luxury packaging market is estimated to be valued at USD 16,720.0 million in 2025.
The market size for the luxury packaging market is projected to reach USD 30,226.7 million by 2035.
The luxury packaging market is expected to grow at a 6.1% CAGR between 2025 and 2035.
The key product types in luxury packaging market are glass & crystal, metal packaging, wood & lacquer and specialty materials.
In terms of application, spirits & wine segment to command 34.0% share in the luxury packaging market in 2025.


Full Research Suite comprises of:
Market outlook & trends analysis
Interviews & case studies
Strategic recommendations
Vendor profiles & capabilities analysis
5-year forecasts
8 regions and 60+ country-level data splits
Market segment data splits
12 months of continuous data updates
DELIVERED AS:
PDF EXCEL ONLINE
Market Share Insights for Luxury Packaging Providers
Europe Luxury Packaging Market Size and Share Forecast Outlook 2025 to 2035
Luxury Travel Market Forecast and Outlook 2025 to 2035
Luxury Wood Doors For Residential Interiors Market Size and Share Forecast Outlook 2025 to 2035
Luxury Rigid Box Market Size and Share Forecast Outlook 2025 to 2035
Luxury Hotel Market Size and Share Forecast Outlook 2025 to 2035
Luxury Electric Vehicle (EV) Market Size and Share Forecast Outlook 2025 to 2035
Luxury Vinyl Tile Flooring Market Size and Share Forecast Outlook 2025 to 2035
Luxury Car Market Size and Share Forecast Outlook 2025 to 2035
Luxury Mattress Market Size and Share Forecast Outlook 2025 to 2035
Luxury Fine Jewellery Market Analysis - Size, Share, and Forecast 2025 to 2035
Luxury SUV Market Size and Share Forecast Outlook 2025 to 2035
Luxury Plumbing Fixtures Market Size and Share Forecast Outlook 2025 to 2035
Luxury Coaches Market Size and Share Forecast Outlook 2025 to 2035
Luxury Interior Fabric Industry Analysis in North America and Europe Growth, Trends and Forecast from 2025 to 2035
Luxury Footwear Market Outlook – Size, Share & Innovations 2025 to 2035
Luxury Furniture Market Insights - Demand, Size, and Industry Trends 2025 to 2035
Competitive Overview of Luxury Yacht Market Share & Providers
Luxury Yacht Industry Analysis by Type, by Size, by Application , by Ownership, and by Region- Forecast for 2025 to 2035
Luxury Handbag Market Analysis by Product Type, Material Type, and Region Through 2035

Thank you!
You will receive an email from our Business Development Manager. Please be sure to check your SPAM/JUNK folder too.
Chat With
MaRIA