The Accounting Software market is witnessing significant growth driven by the increasing need for automation, efficiency, and accuracy in financial management across organizations of all sizes. The future outlook for this market is shaped by rapid adoption of cloud-based solutions, integration of artificial intelligence and machine learning, and increasing demand for real-time financial reporting and analytics.
Organizations are prioritizing digital transformation to streamline accounting processes, reduce manual errors, and enhance decision-making capabilities. The market is further supported by regulatory compliance requirements, which necessitate accurate and timely reporting, as well as the growing adoption of software that provides multi-functional capabilities beyond basic accounting, including budgeting, forecasting, and tax management.
The transition from traditional desktop-based accounting systems to SaaS-based platforms enables remote accessibility, scalability, and improved data security As businesses continue to embrace digital finance solutions and focus on operational efficiency, the Accounting Software market is expected to experience sustained growth, driven by technological advancements, increased automation, and the need for more integrated and agile financial systems.
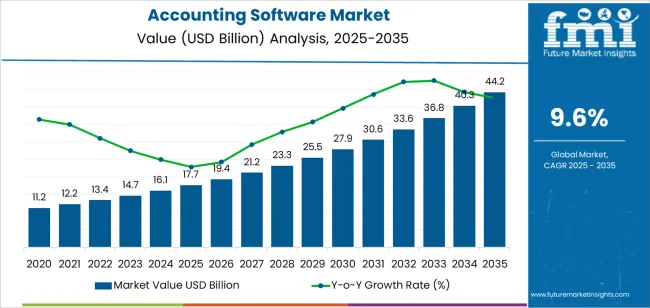
| Metric | Value |
|---|---|
| Accounting Software Market Estimated Value in (2025 E) | USD 17.7 billion |
| Accounting Software Market Forecast Value in (2035 F) | USD 44.2 billion |
| Forecast CAGR (2025 to 2035) | 9.6% |
The market is segmented by Solution, Deployment, and Industry and region. By Solution, the market is divided into Integrated Enterprise Accounting Platform/Suite and Standalone Software/Modules. In terms of Deployment, the market is classified into SaaS-Based (Cloud) and On-Premises. Based on Industry, the market is segmented into Finance, Manufacturing & Resources, Distribution Services, Services, Public Sector, and Infrastructure. Regionally, the market is classified into North America, Latin America, Western Europe, Eastern Europe, Balkan & Baltic Countries, Russia & Belarus, Central Asia, East Asia, South Asia & Pacific, and the Middle East & Africa.
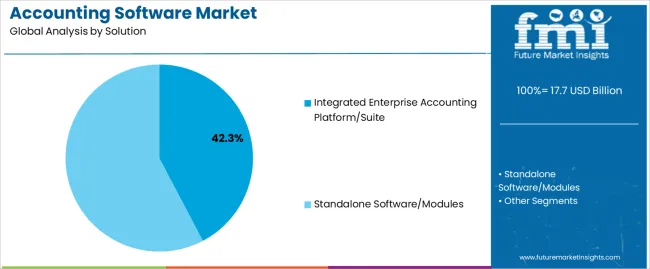
The integrated enterprise accounting platform or suite solution is projected to hold 42.30% of the Accounting Software market revenue share in 2025, making it the leading solution segment. This dominance is driven by the ability of integrated platforms to centralize accounting, financial reporting, and operational management within a single system, reducing redundancy and improving workflow efficiency.
The segment has benefited from advancements in automation, AI-based analytics, and real-time data processing, which enable organizations to make timely and informed financial decisions. Scalability and customization options offered by integrated platforms allow businesses to tailor the software according to their size, industry requirements, and regulatory obligations.
Additionally, the convergence of multiple accounting functions into one suite reduces operational complexity and ensures consistency across financial processes Widespread adoption of enterprise accounting suites is further reinforced by the growing need for centralized control over multi-entity organizations, enabling better compliance, transparency, and productivity.
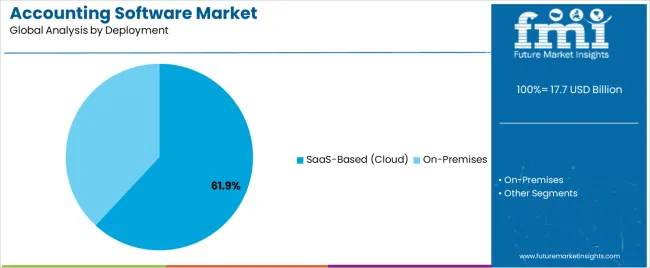
The SaaS-based or cloud deployment segment is expected to capture 61.90% of the Accounting Software market revenue share in 2025, making it the dominant deployment type. This growth is fueled by the increasing demand for remote accessibility, flexible scalability, and cost-effective subscription-based models.
Cloud-based deployment allows organizations to access accounting systems from any location, facilitating collaboration and real-time financial monitoring. The segment has been supported by improvements in data security, cloud infrastructure, and integration capabilities with other business applications, which enhance operational efficiency and reduce IT maintenance costs.
Adoption of cloud-based solutions is further accelerated by digital transformation initiatives and the growing preference for automated, centralized, and software-driven accounting workflows The scalability and flexibility of SaaS platforms make them particularly attractive for small and medium-sized enterprises, as well as large organizations seeking to modernize legacy systems, thus sustaining the segment’s leading position in the market.
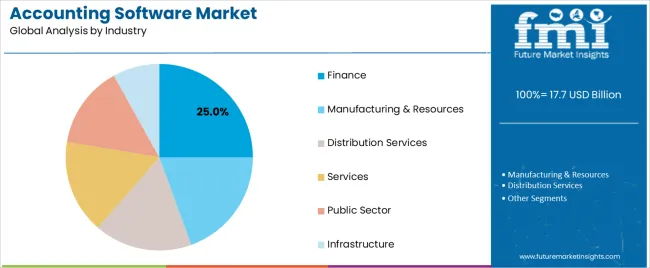
The finance industry segment is anticipated to account for 25.00% of the Accounting Software market revenue in 2025, making it the leading end-use industry. This growth is driven by the critical need for efficient financial management, regulatory compliance, and accurate reporting in banking, investment, and corporate finance organizations.
The segment has benefited from the adoption of advanced analytics, automation, and integrated accounting platforms that streamline financial operations, reduce errors, and provide real-time insights for decision-making. Additionally, finance organizations require robust software to manage complex transactions, multi-currency operations, and risk assessment, which has accelerated the uptake of sophisticated accounting solutions.
The ongoing trend toward digital finance transformation, coupled with the need for secure, scalable, and cloud-enabled accounting systems, continues to strengthen the adoption of software solutions in the finance sector This combination of regulatory demands, operational complexity, and technological advancement has established the finance industry as the dominant end-use segment in the Accounting Software market.
The below table showcases the growth during the first half (H1) over the 2025 to 2035 period which is 9.2%. The other half (H2) shows the growth of 9.8% which presents the market representation over the period.
| Particular | Value CAGR |
|---|---|
| H1 | 9.2% (2025 to 2035) |
| H2 | 9.8% (2025 to 2035) |
| H1 | 9.5% (2025 to 2035) |
| H2 | 9.9% (2025 to 2035) |
Moving into the further period, from H1 2025 to H2 2035, the CAGR is expected to rise to 9.5% in the first half and grow relatively at 9.9% in the second half. In the first half (H1) the market showcased an increase of 30 BPS while in the second half (H2), the market witnessed an increase of 10 BPS.
Integration Capabilities of the Accounting Software is Driving the Market Demand
Accounting software enables organizations to run more efficiently and make more informed business choices. Accounting software is being connected with ERP, payroll, and other corporate software and applications to provide an integrated software platform for data centralization and cross-team collaboration. This is one of the reasons why the accounting software market is one of the fastest expanding segments for small businesses.
This offers enormous advantages from workflow improvement perspective. For example, it eliminates redundant data entry and ensures data consistency and accuracy. Accounting software can integrate with CRM systems to automatically feed sales data. This allows finance departments to focus on invoices, payments, pricing and revenue without having to transfer data from one system to another.
The other advantage of integration is that it gives visibility into key business activities by consolidating data into one screen. Businesses can see financial KPIs, customer data, inventory levels, employee hours and much more with one click. With this 360-degree view of business activities executives and managers can make quicker and better operational and strategic decisions.
Systems that work together automate many back office functions. When a sales rep adds a new customer to the CRM database for example, the accounting software can automatically create a new customer account in the general ledger and start billing that customer.
This eliminates keying, reduces errors and allows businesses to collect revenue quicker. Integration results in enormous efficiency and cost savings improvements. Integration of accounting software with other systems allows businesses to leverage their data, automate workflows and enhance collaboration.
High demand for real-time financial insights is propelling the market to an era of rapid evolution and innovation.
In rapid industry, stakeholders need real-time data so they can make informed decisions quickly. Accounting software gives firms real-time access to financial information, providing them to respond rapidly to market changes, new possibilities, and potential difficulties.
With firms growing and expanding on a daily basis, the demand for real-time financial data increases. For example, now-a-days country wise multinational companies want to see reports of their cash flow in real-time due to fluctuations in the share market.
Accounting software helps them in doing so with its real-time reporting thus allowing them to take quick decisions no matter wherever they are. Also the emergence of cloud technology has played a great part in this role as well. Now anyone can view their financial status from their mobile or laptop with an internet connection. This almost makes everyone sitting on a round table making every decision way easier.
On the other hand, these businesses also have to follow rules and regulations all over the globe. These always changing regulations are quite complex. But accounting software can keep up with the changes and make sure everything's above board, saving companies from fines and other disasters.
Data Security Concerns in the Accounting Software Might Hinder the Market Growth
One of the most significant difficulties facing the accounting software business is data security, as the financial data handled by accounting software is sensitive. Organizations now are more educated than ever about cyber-attacks, data theft, and illegal access to financial data.
Furthermore, accounting software saves incredibly sensitive information such as bank transactions, payroll information, and tax reports, making it an ideal target for hackers to exploit. The loss of this critical information, reduction in company’s worth and potential legal complications on account of theft / breach results into resistance in companies adopting new age accounting software with the technology curve.
Tight security is one of the most challenging and expensive to provide. Advanced encryption methods, two-factor authentications, and regular security audits demand heavy investment and consume time to maintain. SMEs, which constitute a significant part of the market, might struggle to bear the brunt of the expenses.
Data protection laws such as GDPR in European Nations or CCPA in California have added another layer to the problem. Companies must ensure that the accounting software they opt to process their financial data must comply with the strict data protection regulations which is a task in itself and even more difficult for companies operating in multiple geographies.
Blockchain Technology Presents an Attractive Opportunity in the Accounting Software Market
Blockchain technology has the potential to build an immutable database of transactions, so once recorded, the data cannot be modified. This level of transparency ensures that all transactions are traceable and verifiable, decreasing the risk of fraud and errors. Audits in accounting can be simplified and more accurate as a result of recorded transactions.
On the other hand, blockchain has tremendous possibilities for automating and streamlining the auditing process. All transactions are recorded on the distributed database, making it extremely transparent and eternal. As a result, auditors are not required to spend time investigating each and every transaction, reducing audit time and expense while also ensuring compliance with key standards at the appropriate time.
Recording and authenticating transactions in real time Blockchain enables businesses to record and verify each transaction in real time, allowing them to maintain their accounting records up to date. This allows for improved financial reporting while also providing accurate and timely information about the company's financial situation. It also promotes optimism and agility in financial managing of the business.
The global accounting software industry witnessed a CAGR of 7.4% during the historical period between 2020 and 2025. The industry grew at a decent rate as it reached a value of USD 14,870.9 million in 2025 from USD 11,172.1 million in 2020.
During the pandemic, the industry increased steadily as numerous enterprises had to switch to remote work environments, requiring the use of digital solutions. This shift drove the need for cloud-based accounting software, which allows organizations to retain continuity and manage their accounts remotely.
On the other hand, the market is predictable to grow at a CAGR of 9.6% during the estimated period between 2025 and 2035. The market is likely to grow speedily as it has a potential to reach a value of USD 40,043.0 million in 2035 from USD 16,119.4 million in 2025.
After Covid-19, hybrid and remote work patterns became more prevalent, raising demand for accounting tools that can be used from anywhere. On the other side, the financial constraints set by the pandemic have heightened the company's focus on cost efficiency. Businesses are looking for strategies that reduce operational expenses while enhancing worker efficiency.
Tier 1 companies includes companies that are performing as market leader in the accounting software market. These companies are providing wide range of solutions and have a very large customer base in the concerned market. The companies in this tier consists about 45%-50% of global market. The companies in the bracket includes such as Infor, SAP, Oracle and others.
Tier 2 companies consists of those mid-sized players that have the market share around 15%-20% globally. These companies might not provide a very broad portfolio of the Accounting Software offerings but have a very respectable share in the market.
These companies often focus on making partnerships and collaborations in order to maximize their customer portfolio meanwhile this also keeps them in loop about any innovation and product launches. Although, these companies themselves also try to launch the new products in order to broaden their solution portfolio. The companies in the tier are Sage Group, Xero and others
Tier 3 companies are the companies which are still trying to achieve stability in the market or these companies might be established recently. These companies hold around 30%-35% share in the market. These companies are primarily focuses on partnerships and their product portfolio. The companies in the tier include Wave Financial, Odoo and others.
The section below includes the industry analysis of accounting software market over the countries in North America, Latin America, East Asia, South Asia & Pacific, Western Europe, Eastern Europe and Middle East & Africa. The analysis includes the country wise analysis of their growth. The USA in North America is expected to hold the market share around 82.5% in the year 2035. Meanwhile, India is expected to grow at a high CAGR of 8.9% over the forecasted period
| Countries | Value CAGR (2025 to 2035) |
|---|---|
| USA | 8.9% |
| Brazil | 7.4% |
| India | 14.7% |
| Germany | 9.2% |
| China | 13.3% |
Germany’s Accounting Software market is poised to showcase a CAGR of 9.2% between 2025 and 2035. The country holds the significant amount of Western Europe market share and is expect to grow further.
The country’s solid economy and thriving business sector have recently created demand for accounting software. Its businesses are growing domestically as well as globally and thus, need effective financial management solutions to automate processes, ensure compliance with regulations and laws and also assist in implementing optimal decisions.
Furthermore, German government and regulators have taken steps that strongly encourage digitalization, and thus are driving accounting software adoption among SMEs and large enterprises.
Along with policies such as Digital Agenda 2025 and Industry 4.0, German enterprises are driving digital transformations to increase productivity, competitiveness and innovation. This push for digitalization has led to investments in modern accounting software that offers automation, real-time reporting and connectivity.
The accounting software market in the United States is anticipated to grow at an 8.9% CAGR during the forecasted period. The country's fundamental culture of innovation and early adoption of technology stimulates industrial demand. The United States has consistently been a leading technology adopter, especially in the software and financial sectors. Furthermore, the access of venture capital funding and a startup-friendly ecosystem are driving innovation in this sector.
However, the country's regulatory landscape remains complex, with regulations for financial reporting, tax compliance, and data privacy upgrading on an ongoing basis. As such, accounting software vendors in country are constantly developing solutions that not only help meet regulatory needs but also offer flexibility and scalability.
The transforming business landscape is driving the adoption of digital financial solutions in the country. The India accounting software market will continue to grow at a CAGR of 14.7% as industries across India utilize accounting software.
With greater technological advances, companies are transitioning from manual, paper-based procedures to automated and cloud-based solutions that offer real-time insights, scalability, and connectivity from anywhere and at any time. The smartphone revolution coupled with internet connectivity has democratized accounting software access especially among small and medium enterprises (SMEs) and startup’s.
The section contains information about the leading segments in the industry. By solution, the Integrated Enterprise Accounting Platform/Suite segment is expected to grow at a CAGR of 10.7% till 2035. On the other hand, the SaaS-based (Cloud) among deployment segment is projected to grow at 10.2% CAGR throughout 2035. Among the industries, Finance segment is estimated to grow at CAGR of 11.7% over 2025 to 2035.
| Solution | Integrated Enterprise Accounting Platform |
|---|---|
| Value Share (2035) | 42.3% |
The integrated enterprise accounting platform segment is expected to possess around 42.3% market share in the year 2035. These types of platform provide a collection of accounting software as well as other solutions. These solutions cover various aspects of financial management including general ledger, account payable as well as payroll, account management and recording.
These platforms also enable better visibility and control over financial performance as these solutions provide centralized access to real-time data and analytics. The segment is expected to grow at a CAGR of 10.7% over the anticipating period.
| Deployment | SaaS-based (Cloud) |
|---|---|
| Value Share (2035) | 61.9% |
The SaaS-based (Cloud) segment is expected to raise at a CAGR of 10.2% during 2025 to 2035. The cloud-based solution eliminated the need for industries to invest in costly hardware infrastructure and IT resources.
Software solutions offer the flexibility to retained by the service providers in the cloud, which allows industries to access it through the internet. The SaaS-based (Cloud) segment is expected to hold around 61.9% market share in the year 2035.
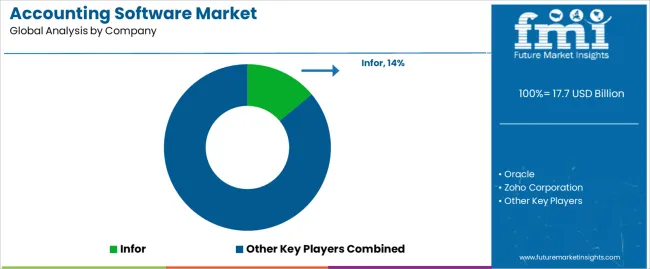
Key players operating in the accounting software market are focusing on investing in research and development in order to innovate new technologies. The businesses are also expanding their global reach for tapping the market that has yet to be dominated by other vendors.
Recent Industry Developments in Accounting Software Market
In terms of solution, the industry is segmented into integrated enterprise accounting platform/suite and standalone software/modules.
In terms of deployment, the industry is segregated into SaaS-based (Cloud) and On-Premises.
The industry is classified by finance, manufacturing & resources, distribution services, services, public sector and infrastructure
Key countries of North America, Latin America, East Asia, South Asia & Pacific, Western Europe, Eastern Europe and Middle East and Africa (MEA) have been covered in the report.
The global accounting software market is estimated to be valued at USD 17.7 billion in 2025.
The market size for the accounting software market is projected to reach USD 44.2 billion by 2035.
The accounting software market is expected to grow at a 9.6% CAGR between 2025 and 2035.
The key product types in accounting software market are integrated enterprise accounting platform/suite and standalone software/modules.
In terms of deployment, saas-based (cloud) segment to command 61.9% share in the accounting software market in 2025.


Full Research Suite comprises of:
Market outlook & trends analysis
Interviews & case studies
Strategic recommendations
Vendor profiles & capabilities analysis
5-year forecasts
8 regions and 60+ country-level data splits
Market segment data splits
12 months of continuous data updates
DELIVERED AS:
PDF EXCEL ONLINE
Construction Accounting Software Market Size and Share Forecast Outlook 2025 to 2035
Hydrocarbon Accounting Solution Market by Service Type, by End User & Region Forecast till 2035
Analyzing Hydrocarbon Accounting Solution Market Share & Industry Leaders
Europe Hydrocarbons Accounting Solution Market Insights – Demand & Growth 2025 to 2035
Software Defined Vehicle Market Size and Share Forecast Outlook 2025 to 2035
Software Defined Networking (SDN) And Network Function Virtualization (NFV) Market Size and Share Forecast Outlook 2025 to 2035
Software Defined Perimeter (SDP) Market Size and Share Forecast Outlook 2025 to 2035
Software-Defined Wide Area Network SD-WAN Market Size and Share Forecast Outlook 2025 to 2035
Software Defined Radio (SDR) Market Size and Share Forecast Outlook 2025 to 2035
Software License Management (SLM) Market Size and Share Forecast Outlook 2025 to 2035
Software-Defined Networking SDN Market Size and Share Forecast Outlook 2025 to 2035
Software-Defined Anything (SDx) Market Size and Share Forecast Outlook 2025 to 2035
Software-Defined Data Center Market Size and Share Forecast Outlook 2025 to 2035
Software Containers Market Size and Share Forecast Outlook 2025 to 2035
Software Defined Application And Infrastructure Market Size and Share Forecast Outlook 2025 to 2035
Software Defined Networking Market Size and Share Forecast Outlook 2025 to 2035
Software-Defined Camera (SDC) Market Size and Share Forecast Outlook 2025 to 2035
Examining Market Share Trends in the Software Distribution Industry
Software Distribution Market Analysis by Deployment Type, by Organization Size and by Industry Vertical Through 2035
Software-Defined WAN Market - Growth & Forecast through 2034

Thank you!
You will receive an email from our Business Development Manager. Please be sure to check your SPAM/JUNK folder too.
Chat With
MaRIA