Acoustic Wave Filters Market
Market Insights on Acoustic Wave Filters covering sales outlook, demand forecast & up-to-date key trends
Acoustic Wave Filters Market By Type (SAW Filter, BAW Filter), Material (Quartz, Lithium Niobate, Lithium Tantalate, Langasite), Application (Consumer Electronics, Telecommunications, Automotive, Aerospace & Defense, Healthcare, Industrial) & Region - Forecast to 2021 - 2031
Acoustic Wave Filters Market Snapshot
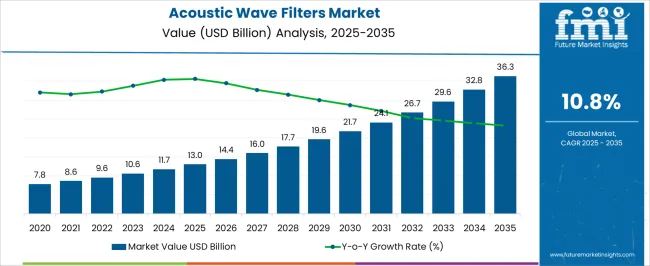
The acoustic wave filter market revenue will total US$ 8.9 billion by 2021, as per a Future Market Insights (FMI) analysis. Registering growth at 10.6% CAGR between 2021 and 2031, the market’s valuation is expected to surpass US$ 24.5 billion by 2031.
Lithium tantalate will remain highly sought-after among material used. The study forecasts, the demand for acoustic wave filters made from lithium tantalate to rise at 13.4% CAGR
Let us know your requirement to get
100% FREE customization
Key Points Covered in Acoustic Wave Filters Market Study
- Market estimates and forecast 2016-2031
- Key drivers and restraints impacting market growth
- Segment-wise, Country-wise, and Region-wise Analysis
- Competition Mapping and Benchmarking
- Market Share Analysis
- Key Product Innovations and Regulatory Climate
- COVID-19 Impact on Acoustic Wave Filters sales and how to Navigate
- Recommendation on Key Winning Strategies
2016-2020 Acoustic Wave Filters Demand Outlook Compared to 2021-2031 Forecast
Increasing penetration of smartphones and advancements in the automotive industry are likely to drive the acoustic wave filters market in the coming years. The demand will rise at 10.6% CAGR between 2021 and 2031 in comparison to the 9.8% CAGR registered during 2016-2020.
Businesses are increasingly compelled to manage mobile devices, apps, and a variety of voice and collaboration tools for teams to connect across geographies, platforms, and devices. Moreover, a significant increase in the number of smartphone users around the world will encourage consumers to adopt 5G-enabled services.
This includes autonomous driving, ultra-HD video, augmented reality, virtual reality, and artificial intelligence. These factors are anticipated to fuel demand for LTE advanced and 5G technologies, which will boost growth of the acoustic wave filter market.
How is Increasing Demand for RF Acoustic Wave Filters Impacting Market Growth?
Adoption of wireless, optical, and other high-speed and high-frequency products has increased the demand for BAW filters that are optimized for performance, cost, and practical development complexity. The demand for RF acoustic wave filters is on the rise owing to easy integration of myriad applications such as broadcast receiver to select desired channel frequencies.
These filters are used with radio receivers to filter out unwanted bands. RF filters sort out the signal frequencies and also reduce the interference of the external signals that affect the quality or performance of communication systems.
A significant increase in the number of mobile devices in various countries around the world is expected to facilitate growth of the bulk acoustic wave filter market. As smartphone penetration is increasing day-by-day, the adoption of radio frequency (RF) filters such as bulk acoustic filter is increasing in smartphones.
Bulk acoustic wave filters are used for toughest interference and it also delivers high speed and greater bandwidth by utilizing a wider spectrum.
Find your sweet spots for generating winning opportunities in this market.
Talk to AnalystWhat is the Impact of COVID-19 Crisis on Acoustic Wave Filter Production?
The COVID-19 pandemic tightened its noose around the world since early 2020. An increasing number of Chief Financial Officers (CFOs) in the U.S. have agreed that COVID-19 has the potential to significantly impact their business.
The technology sector has been severely affected by the unprecedented outbreak, which compelled organizations to reconsider their business strategies for the post-pandemic world. RF filter manufacturers have also shown negative trends in response to the impact of COVID-19.
Companies are monitoring the situation to ensure operations in supply chains and access to alternative logistical routes wherever possible. The estimated sales of acoustic wave filters have dropped by 10% to 15% during the course of pandemic in Q1-Q2 2020.
Country-wise Insights
How are Acoustic Wave Filter Manufacturers Faring in the U.S.?
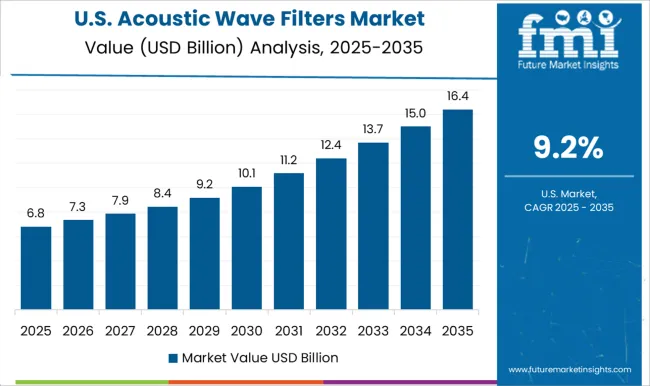
The U.S. is predicted to remain one of the most attractive markets during the forecast period, according to Future Market Insights. According to the study, the U.S. is expected to account for over 89% of the North America market through 2031.
The U.S. exhibited growing demand for interface standards such as Wi-Fi and LTE for a range of services in wireless charging capabilities, voice control, blind spot awareness, and self-driving vehicles.
The rise in adoption of RF filter technology by aviation customers, such as Airbus and Boeing, along with increasing adoption from the U.S. Department of Defense, in RADAR systems, electronic surveillance, GPS, navigation, and ATC (Air Traffic Control) is propelling the demand for acoustic wave filters market in U.S.
In April 2021, Akoustis Technologies, Inc., which has a significant presence in the U.S., announced innovation of nine new patents covering BAW Filter devices and methods for 5G, WiFi 6, WiFi 6E and C-V2X. In addition to its patent portfolio, Akoustis’ IP includes the ownership of valuable trade secrets associated with manufacturing its proprietary XBAW high-band RF filter products and single-crystal piezoelectric materials. Such developments have been ongoing in the country, thus augmenting the acoustic wave filters demand in the U.S.
Why is the Demand for Acoustic Wave Filters Increasing in Indonesia?
Demand in the Indonesia market is expected to rise at nearly 15.3% CAGR over the forecast period. Over the coming decade, the consumer electronics industry in Indonesia is expected to continue growing strongly. Moreover, the adoption of wireless technologies has experienced remarkable growth and development.
Increasing penetration of smartphone devices has increased the demand for RF filters in the country. As per the report, Indonesia is recognized as a primary market, and is expected to continue exhibiting high demand for acoustic wave filters through the forecast period.
How is India Contributing Towards Acoustic Wave Filters Sales?
By 2031, India will account for over 54% of share in the South Africa and Pacific market. India is one of the fastest growing economies and is expected to offer favorable market conditions for acoustic wave filters vendors.
The country is witnessing accelerated growth with rapidly increasing connectivity due to digital transformation and a growing demand for wireless systems. The major factor contributing to the high growth rate is increasing adoption of smartphones in India.
The country has many established SMEs, which are growing at an exponential rate to cater to the large customer base. In recent years, the country has experienced increasing demand for RF filters in applications such as electronic surveillance, GPS, navigation, smartphones to transit, filters, and receiver paths for 3G and 4G technologies.

An unified Market Research Subscription Platform, built for today’s disparate research needs.
Category-wise Insights
Which is the Preferred Acoustic Wave Filters Type?
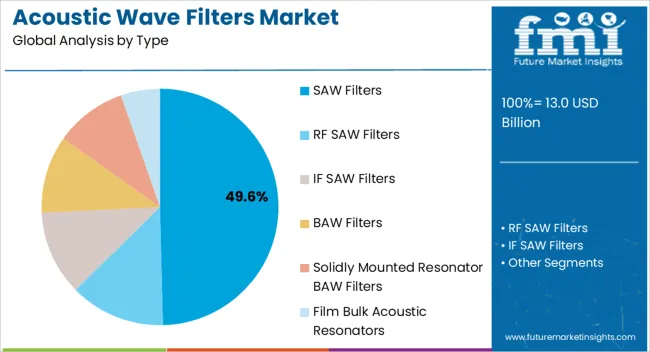
Revenues from the bulk acoustic wave (BAW) filter segment grew at a robust 10.0% year over year in 2021. Demand for BAW filters increased 1.5% between 2020 and 2021, giving the combined market, year-over-year growth of 8.4% in 2021, according to Future Market Insights.
Based on filter type, BAW filters are expected to grow at 12.5% CAGR, accounting for a market share of 58.4% in 2031. BAW filters provide low insertion properties that makes it extremely efficient at dissipating heat at high power levels.
BAW filters also save board space by making filters smaller so that filters are easily integrated into RF front-end (RFFE) modules, which supports 5G requirements. The growing adoption of BAW filters in communication technologies like LTE networks and 5G technology, and Internet of Things (IoT) augments the demand of BAW filters segment, which is also set to assist market growth during 2021-2031.
How is the Preferred Material for Acoustic Wave Filters?
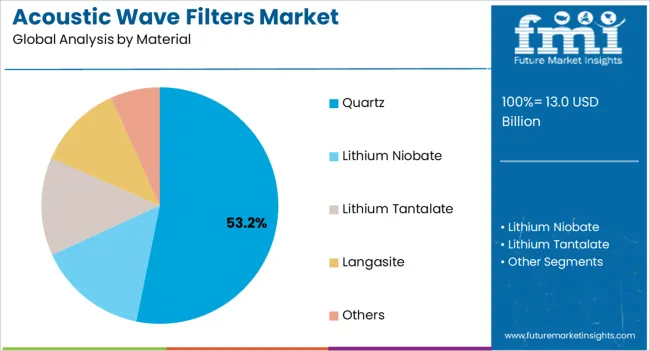
In the acoustic wave filter market, lithium niobate and lithium tantalate segments cumulatively accounted for US$ 6,127.0 Mn in 2021, according to the analysis conducted by Future Market Insights.
The lithium tantalate segment is estimated to grow the fastest with a CAGR of 13.4% during the forecast period 2021-31. Lithium Niobate is dominating the global acoustic wave filters market with a share of 43.4% by the end of 2021.
The growing demand for high-speed Internet for small and large-scale applications, and Internet of Things (IoT) technology making its debut in consumers’ space will support developments.
A perpetual rise in the demand for communication networks with broad bandwidths will uphold the demand for lithium niobate crystals. The rollout of 5G networks in turn, holds the key to higher sales for the landscape.
Why Do Telecommunication Applications Hold Major Share in Global Market?
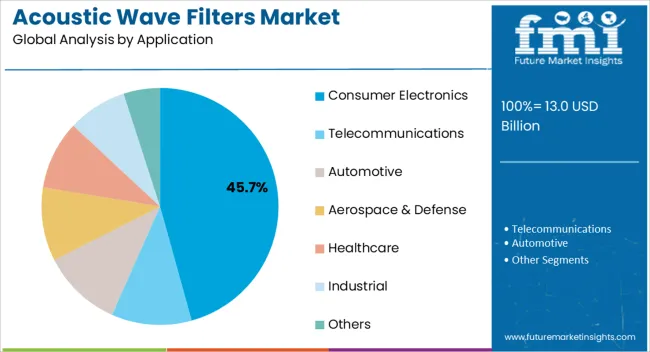
The telecommunications sector is expected to contribute maximum revenue share of more than 33.5% in the global demand for acoustic wave filters in 2021. Acoustic wave filters are majorly used in mobile devices/smartphones.
SAW/BAW filters are used in smartphones to transmit, filter, and receive paths for 3G, 4G, and also for 2G up to 15 bands, in addition to supporting Bluetooth, Wi-Fi, and other wireless communications. As the penetration of smartphones increases across the globe, the demand for acoustic wave filters is also expected to increase in the telecommunication sector.
Competitive Landscape
According to FMI’s analysis, Qualcomm, Murata, Qorvo, Skyworks, Taiyo Yuden, and Broadcom are identified as key players in the acoustic wave filters landscape. Companies manufacturing acoustic wave filters are aiming at product innovation and strategic partnerships with other manufacturers to expand their product manufacturing capabilities to address the demand of an expanding customer pool.
- For instance, in June 2021, Resonant announced Upgraded WaveX Design Software for Acoustic Wave Filter Development, Specifically Enhanced for 5G, Wi-Fi, and Ultra-wideband RF Filters. WaveX is the upgraded version of Resonant’s legacy Infinite Synthesized Networks (ISN) design software. The new platform delivers full 3D finite element modeling simulation capability to design RF filters, and leverages a hybrid multi-cloud, large-memory GPU-powered implementation.
- In February 2021, Qualcomm and TDK announced the launch of a joint venture. The joint venture will enable Qualcomm’s RFFE business unit to deliver RF front-end (RFFE) modules and RF filters into fully integrated systems for mobile devices and fast-growing business segments, such as Internet of Things (IoT), automotive applications, and connected computing.
Manufacturers are also focusing on mergers and acquisitions to maintain their global presence.
- In March 2021, Resonant acquired GVR Trade SA (GVR). With this acquisition, Resonant expanded its Enhanced ISN capabilities.
Scope of Report
Attribute |
Details |
Forecast Period |
2021-2031 |
Historical Data Available for |
2016-2020 |
Market Analysis |
USD Million for Value |
Key Countries Covered |
US, Canada, Germany, U.K., France, Italy, Spain, Russia, China, Japan, South Korea, India, ASEAN, Australia & New Zealand, GCC Countries, Turkey, and South Africa |
Key Segments Covered |
Type, Material, Application, and Region |
Key Companies Profiled |
|
Report Coverage |
Market Forecast, Company Share Analysis, Competition Intelligence, DROT Analysis, Market Dynamics and Challenges, and Strategic Growth Initiatives |
Customization & Pricing |
Available upon Request |
Acoustic Wave Filters Market by Category
By Type:
- SAW Filter
- RF SAW Filters
- IF SAW Filters
- BAW Filter
- Solidly Mounted Resonator BAW Filters
- Film Bulk Acoustic Resonators
By Material:
- Quartz
- Lithium Niobate
- Lithium Tantalate
- Langasite
- Others
By Application:
- Consumer Electronics
- Telecommunications
- Automotive
- Aerospace & Defense
- Healthcare
- Industrial
- Others
By Region:
- North America
- Latin America
- Europe
- East Asia
- South Asia & Pacific
- Middle East and Africa (MEA)
Frequently Asked Questions
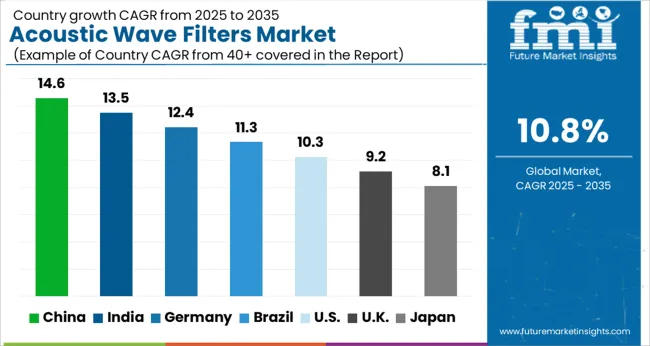
South Asia and Pacific is projected to grow at the highest CAGR of 14.6% during the forecast period owing to increasing penetration of smartphones in countries such as India, Indonesia, and Thailand.
Acoustic wave filters market is expected to rise at 10.6% CAGR between 2021 and 2031.
The leading companies in acoustic wave filters market are Qorvo, Murata, and Qualcomm. As per Future Market Insights, 47% of the market share is currently covered by the top 15 players.
The telecommunications sector is expected to dominate the market with a revenue of US$ 8.4 Bn by 2031, owing to increasing commercialization of 5G technology across the globe.
The acoustic wave filters market will surpass ~US$ 8.2 Bn in 2021, and is estimated to grow at a steady pace through the forecast period.
The market in last 5 years (2016 – 2020) grew at an impressive CAGR of 9.8%.
Key trends in the market include focus on digital transformation, growing demand for wireless communication systems, and growing adoption of SAW/BAW filters for antenna routing and tuning for 5G networks.
Increasing adoption of acoustic wave filters in aerospace and defense applications, coupled with increasing demand in consumer electronics are spurring the growth of acoustic wave filters.
The top 5 countries driving demand for acoustic wave filters include Indonesia, India, the U.S., Australia and New Zealand, and Malaysia.
North America will emerge as one of the most attractive markets during the forecast period. According to the study, the U.S. is expected to account for 89% of the North America market through 2031.
Japan and South Korea markets were valued at US$ 1,034.3 Mn and US$ 300.4 Mn in 2020, and is projected to register CAGR of 9.5% and 6.3% respectively between 2021 and 2031.
1. Executive Summary
1.1. Global Market Outlook
1.2. Demand Side Trends
1.3. Supply Side Trends
1.4. Analysis and Recommendations
2. Market Overview
2.1. Market Coverage / Taxonomy
2.2. Market Definition / Scope / Limitations
2.3. Inclusions and Exclusions
3. Key Market Trends
3.1. Key Trends Impacting the Market
3.2. Development Trends/ Manufacturing trends
4. Key Success Factors
4.1. Product Adoption Analysis
4.2. Value Chain Analysis
5. Market Background
5.1. Macro-Economic Factors
5.1.1. Global GDP Growth Outlook
5.1.2. Per Capita Healthcare Expenditure Outlook
5.2. Forecast Factors - Relevance & Impact
5.2.1. Increasing use of cosmetics
5.2.2. Cost of manufacturing
5.2.3. Number of players
5.2.4. Adoption of cosmetics
5.3. Market Dynamics
5.3.1. Drivers
5.3.2. Restraints
5.3.3. Opportunity Analysis
6. COVID19 – Impact Analysis
6.1. Current COVID19 Statistics and Probable Future Impact
6.2. Current GDP Projection and Probable Impact
6.3. Current Economic Projection as compared to 2008 Economic analysis
6.4. COVID19 and Impact Analysis
6.4.1. Revenue By Application
6.4.2. Revenue By Form
6.4.3. Revenue By Region
6.5. Recovery Scenario – Short term, Midterm and Long Term Impact
7. Global CDMO/CMO Market (Size in US$ Mn) Analysis 2015-2019 and Forecast, 2020-2030
7.1. Historical Market Value (US$ Mn) Analysis, 2015-2019
7.2. Current and Future Market Value (US$ Mn) Projections, 2020-2030
7.2.1. Y-o-Y Growth Trend Analysis
7.2.2. Absolute $ Opportunity Analysis
8. Global CDMO/CMO Market Analysis 2015-2019 and Forecast 2020-2030, By Service
8.1. Introduction / Key Findings
8.2. Historical Market Size (US$ Mn) Analysis By Service , 2015-2019
8.3. Current and Future Market Size (US$ Mn) Analysis and Forecast By Service , 2020-2030
8.3.1. Contract Development
8.3.1.1. Formulation development
8.3.1.2. Pilot studies
8.3.2. Contract Manufacturing
8.3.2.1. Bulk preparation & scale up
8.3.2.2. Safety Testing
8.3.2.3. Filling & Packaging
8.3.2.3.1. close jar
8.3.2.3.2. bottles
8.3.2.3.3. tubes
8.3.2.3.4. roll ons
8.3.2.3.5. Others
8.4. Market Attractiveness Analysis By Service
9. Global CDMO/CMO Market Analysis 2015-2019 and Forecast 2020-2030, by Product Type
9.1. Introduction / Key Findings
9.2. Historical Market Size (US$ Mn) By Product Type, 2015-2019
9.3. Current and Future Market Size (US$ Mn) Analysis and Forecast By Product Type, 2020-2030
9.3.1. Hair Products
9.3.2. Skin Products
9.3.3. Lip Products
9.3.4. Eye Products
9.3.5. Body hygiene
9.3.6. Oral hygiene
9.4. Market Attractiveness Analysis By Product Type
10. Global CDMO/CMO Market Analysis 2015-2019 and Forecast 2020-2030, by Form
10.1. Introduction / Key Findings
10.2. Historical Market Size (US$ Mn) Analysis By Form, 2015-2019
10.3. Current and Future Market Size (US$ Mn) Analysis and Forecast By Form, 2020-2030
10.3.1. Solid forms
10.3.2. Lotions
10.3.3. Creams
10.3.4. Gels
10.3.5. Powders
10.3.6. Others
10.4. Market Attractiveness Analysis By Form
11. Global CDMO/CMO Market Analysis 2015-2019 and Forecast 2020-2030, by Region
11.1. Introduction
11.2. Historical Market Size (US$ Mn) Analysis By Region, 2015 - 2019
11.3. Current Market Size (US$ Mn) Analysis and Forecast By Region, 2020 - 2030
11.3.1. North America
11.3.2. Latin America
11.3.3. Europe
11.3.4. East Asia
11.3.5. South Asia
11.3.6. Oceania
11.3.7. Middle East and Africa (MEA)
11.4. Market Attractiveness Analysis By Region
12. North America CDMO/CMO Market Analysis 2015-2019 and Forecast 2020-2030
12.1. Introduction
12.2. Historical Market Size (US$ Mn) Analysis By Market Taxonomy, 2015-2019
12.3. Market Size (US$ Mn) Forecast By Market Taxonomy, 2020-2030
12.3.1. By Country
12.3.1.1. U.S.
12.3.1.2. Canada
12.3.2. By Service
12.3.3. By Product Type
12.3.4. By Form
12.4. Market Attractiveness Analysis
12.5. Key Market Participants - Intensity Mapping
12.6. Drivers and Restraints - Impact Analysis
13. Latin America CDMO/CMO Market Analysis 2015-2019 and Forecast 2020-2030
13.1. Introduction
13.2. Historical Market Size (US$ Mn) Analysis By Market Taxonomy, 2015-2019
13.3. Market Size (US$ Mn) Forecast By Market Taxonomy, 2020-2030
13.3.1. By Country
13.3.1.1. Brazil
13.3.1.2. Mexico
13.3.1.3. Argentina
13.3.1.4. Rest of Latin America
13.3.2. By Service
13.3.3. By Product Type
13.3.4. By Form
13.4. Market Attractiveness Analysis
13.5. Key Market Participants - Intensity Mapping
13.6. Drivers and Restraints - Impact Analysis
14. Europe CDMO/CMO Market Analysis 2015-2019 and Forecast 2020-2030
14.1. Introduction
14.2. Historical Market Size (US$ Mn) Analysis By Market Taxonomy, 2015-2019
14.3. Market Size (US$ Mn) Forecast By Market Taxonomy, 2020-2030
14.3.1. By Country
14.3.1.1. Germany
14.3.1.2. Italy
14.3.1.3. France
14.3.1.4. U.K.
14.3.1.5. Spain
14.3.1.6. BENELUX
14.3.1.7. Russia
14.3.1.8. Rest of Europe
14.3.2. By Service
14.3.3. By Product Type
14.3.4. By Form
14.4. Market Attractiveness Analysis
14.5. Key Market Participants - Intensity Mapping
14.6. Drivers and Restraints - Impact Analysis
15. South Asia CDMO/CMO Market Analysis 2015-2019 and Forecast 2020-2030
15.1. Introduction
15.2. Historical Market Size (US$ Mn) Analysis By Market Taxonomy, 2015-2019
15.3. Market Size (US$ Mn) Forecast By Market Taxonomy, 2020-2030
15.3.1. By Country
15.3.1.1. India
15.3.1.2. Thailand
15.3.1.3. Indonesia
15.3.1.4. Malaysia
15.3.1.5. Rest of South Asia
15.3.2. By Service
15.3.3. By Product Type
15.3.4. By Form
15.4. Market Attractiveness Analysis
15.5. Key Market Participants - Intensity Mapping
15.6. Drivers and Restraints - Impact Analysis
16. East Asia CDMO/CMO Market Analysis 2015-2019 and Forecast 2020-2030
16.1. Introduction
16.2. Historical Market Size (US$ Mn) Analysis By Market Taxonomy, 2015-2019
16.3. Market Size (US$ Mn) Forecast By Market Taxonomy, 2020-2030
16.3.1. By Country
16.3.1.1. China
16.3.1.2. Japan
16.3.1.3. South Korea
16.3.2. By Service
16.3.3. By Product Type
16.3.4. By Form
16.4. Market Attractiveness Analysis
16.5. Key Market Participants - Intensity Mapping
16.6. Drivers and Restraints - Impact Analysis
17. Oceania CDMO/CMO Market Analysis 2015-2019 and Forecast 2020-2030
17.1. Introduction
17.2. Historical Market Size (US$ Mn) Analysis By Market Taxonomy, 2015-2019
17.3. Market Size (US$ Mn) Forecast By Market Taxonomy, 2020-2030
17.3.1. By Country
17.3.1.1. Australia
17.3.1.2. New Zealand
17.3.2. By Service
17.3.3. By Product Type
17.3.4. By Form
17.4. Market Attractiveness Analysis
17.5. Key Market Participants - Intensity Mapping
17.6. Drivers and Restraints - Impact Analysis
18. Middle East and Africa CDMO/CMO Market Analysis 2015-2019 and Forecast 2020-2030
18.1. Introduction
18.2. Historical Market Size (US$ Mn) Analysis By Market Taxonomy, 2015-2019
18.3. Market Size (US$ Mn) Forecast By Market Taxonomy, 2020-2030
18.3.1. By Country
18.3.1.1. GCC Countries
18.3.1.2. Turkey
18.3.1.3. South Africa
18.3.1.4. Rest of Middle East and Africa
18.3.2. By Service
18.3.3. By Product Type
18.3.4. By Form
18.4. Market Attractiveness Analysis
18.5. Key Market Participants - Intensity Mapping
18.6. Drivers and Restraints - Impact Analysis
19. Key and Emerging Countries CDMO/CMO Market Analysis 2015-2019 and Forecast 2020-2030
19.1. Introduction
19.1.1. Market Value Proportion Analysis, By Key Countries
19.1.2. Global Vs. Country Growth Comparison
19.2. U.S. CDMO/CMO Market Analysis
19.2.1. By Service
19.2.2. By Product Type
19.2.3. By Form
19.3. Canada CDMO/CMO Market Analysis
19.3.1. By Service
19.3.2. By Product Type
19.3.3. By Form
19.4. Brazil CDMO/CMO Market Analysis
19.4.1. By Service
19.4.2. By Product Type
19.4.3. By Form
19.5. Mexico CDMO/CMO Market Analysis
19.5.1. By Service
19.5.2. By Product Type
19.5.3. By Form
19.6. Argentina CDMO/CMO Market Analysis
19.6.1. By Service
19.6.2. By Product Type
19.6.3. By Form
19.7. Germany CDMO/CMO Market Analysis
19.7.1. By Service
19.7.2. By Product Type
19.7.3. By Form
19.8. France CDMO/CMO Market Analysis
19.8.1. By Service
19.8.2. By Product Type
19.8.3. By Form
19.9. U.K. CDMO/CMO Market Analysis
19.9.1. By Service
19.9.2. By Product Type
19.9.3. By Form
19.10. Spain CDMO/CMO Market Analysis
19.10.1. By Service
19.10.2. By Product Type
19.10.3. By Form
19.11. BENELUX CDMO/CMO Market Analysis
19.11.1. By Service
19.11.2. By Product Type
19.11.3. By Form
19.12. Russia CDMO/CMO Market Analysis
19.12.1. By Service
19.12.2. By Product Type
19.12.3. By Form
19.13. India CDMO/CMO Market Analysis
19.13.1. By Service
19.13.2. By Product Type
19.13.3. By Form
19.14. Thailand CDMO/CMO Market Analysis
19.14.1. By Service
19.14.2. By Product Type
19.14.3. By Form
19.15. Indonesia CDMO/CMO Market Analysis
19.15.1. By Service
19.15.2. By Product Type
19.15.3. By Form
19.16. Malaysia CDMO/CMO Market Analysis
19.16.1. By Service
19.16.2. By Product Type
19.16.3. By Form
19.17. China CDMO/CMO Market Analysis
19.17.1. By Service
19.17.2. By Product Type
19.17.3. By Form
19.18. Japan CDMO/CMO Market Analysis
19.18.1. By Service
19.18.2. By Product Type
19.18.3. By Form
19.19. South Korea CDMO/CMO Market Analysis
19.19.1. By Service
19.19.2. By Product Type
19.19.3. By Form
19.20. Australia CDMO/CMO Market Analysis
19.20.1. By Service
19.20.2. By Product Type
19.20.3. By Form
19.21. New Zealand CDMO/CMO Market Analysis
19.21.1. By Service
19.21.2. By Product Type
19.21.3. By Form
19.22. GCC Countries CDMO/CMO Market Analysis
19.22.1. By Service
19.22.2. By Product Type
19.22.3. By Form
19.23. North Africa CDMO/CMO Market Analysis
19.23.1. By Service
19.23.2. By Product Type
19.23.3. By Form
19.24. South Africa CDMO/CMO Market Analysis
19.24.1. By Service
19.24.2. By Product Type
19.24.3. By Form
19.25. Turkey CDMO/CMO Market Analysis
19.25.1. By Service
19.25.2. By Product Type
19.25.3. By Form
20. Market Structure Analysis
20.1. Market Analysis by Tier of Companies
20.2. Market Concentration
20.3. Market Share Analysis of Top Players
20.4. Market Presence Analysis
20.4.1. By Regional footprint of Players
20.4.2. Product foot print by Players
20.4.3. Channel Foot Print by Players
21. Competition Analysis
21.1. Competition Dashboard
21.2. Competition Deep Dive
21.2.1. Global Players
21.2.1.1. Swiss American CDMO
21.2.1.1.1. Overview
21.2.1.1.2. Product Portfolio
21.2.1.1.3. Profitability by Market Segments (Product/Channel/Region)
21.2.1.1.4. Sales Footprint
21.2.1.1.5. Strategy Overview
21.2.1.1.5.1. Marketing Strategy
21.2.1.1.5.2. Product Strategy
21.2.1.1.5.3. Channel Strategy
21.2.1.2. Pierre Fabre Group
21.2.1.2.1. Overview
21.2.1.2.2. Product Portfolio
21.2.1.2.3. Profitability by Market Segments (Product/Channel/Region)
21.2.1.2.4. Sales Footprint
21.2.1.2.5. Strategy Overview
21.2.1.2.5.1. Marketing Strategy
21.2.1.2.5.2. Product Strategy
21.2.1.2.5.3. Channel Strategy
21.2.1.3. Zymo Cosmetics
21.2.1.3.1. Overview
21.2.1.3.2. Product Portfolio
21.2.1.3.3. Profitability by Market Segments (Product/Channel/Region)
21.2.1.3.4. Sales Footprint
21.2.1.3.5. Strategy Overview
21.2.1.3.5.1. Marketing Strategy
21.2.1.3.5.2. Product Strategy
21.2.1.3.5.3. Channel Strategy
21.2.1.4. Fareva
21.2.1.4.1. Overview
21.2.1.4.2. Product Portfolio
21.2.1.4.3. Profitability by Market Segments (Product/Channel/Region)
21.2.1.4.4. Sales Footprint
21.2.1.4.5. Strategy Overview
21.2.1.4.5.1. Marketing Strategy
21.2.1.4.5.2. Product Strategy
21.2.1.4.5.3. Channel Strategy
21.2.1.5. Biofarma Srl C.F
21.2.1.5.1. Overview
21.2.1.5.2. Product Portfolio
21.2.1.5.3. Profitability by Market Segments (Product/Channel/Region)
21.2.1.5.4. Sales Footprint
21.2.1.5.5. Strategy Overview
21.2.1.5.5.1. Marketing Strategy
21.2.1.5.5.2. Product Strategy
21.2.1.5.5.3. Channel Strategy
21.2.1.6. Chemineau
21.2.1.6.1. Overview
21.2.1.6.2. Product Portfolio
21.2.1.6.3. Profitability by Market Segments (Product/Channel/Region)
21.2.1.6.4. Sales Footprint
21.2.1.6.5. Strategy Overview
21.2.1.6.5.1. Marketing Strategy
21.2.1.6.5.2. Product Strategy
21.2.1.6.5.3. Channel Strategy
21.2.1.7. C.O.C. Farmaceutici Srl
21.2.1.7.1. Overview
21.2.1.7.2. Product Portfolio
21.2.1.7.3. Profitability by Market Segments (Product/Channel/Region)
21.2.1.7.4. Sales Footprint
21.2.1.7.5. Strategy Overview
21.2.1.7.5.1. Marketing Strategy
21.2.1.7.5.2. Product Strategy
21.2.1.7.5.3. Channel Strategy
21.2.1.8. PARAGON NORDIC
21.2.1.8.1. Overview
21.2.1.8.2. Product Portfolio
21.2.1.8.3. Profitability by Market Segments (Product/Channel/Region)
21.2.1.8.4. Sales Footprint
21.2.1.8.5. Strategy Overview
21.2.1.8.5.1. Marketing Strategy
21.2.1.8.5.2. Product Strategy
21.2.1.8.5.3. Channel Strategy
21.2.1.9. Cosmetic Solutions
21.2.1.9.1. Overview
21.2.1.9.2. Product Portfolio
21.2.1.9.3. Profitability by Market Segments (Product/Channel/Region)
21.2.1.9.4. Sales Footprint
21.2.1.9.5. Strategy Overview
21.2.1.9.5.1. Marketing Strategy
21.2.1.9.5.2. Product Strategy
21.2.1.9.5.3. Channel Strategy
21.2.1.10. Asia-Pacific Players
21.2.1.10.1. Overview
21.2.1.10.2. Product Portfolio
21.2.1.10.3. Profitability by Market Segments (Product/Channel/Region)
21.2.1.10.4. Sales Footprint
21.2.1.10.5. Strategy Overview
21.2.1.10.5.1. Marketing Strategy
21.2.1.10.5.2. Product Strategy
21.2.1.10.5.3. Channel Strategy
21.2.1.11. Kolmar
21.2.1.11.1. Overview
21.2.1.11.2. Product Portfolio
21.2.1.11.3. Profitability by Market Segments (Product/Channel/Region)
21.2.1.11.4. Sales Footprint
21.2.1.11.5. Strategy Overview
21.2.1.11.5.1. Marketing Strategy
21.2.1.11.5.2. Product Strategy
21.2.1.11.5.3. Channel Strategy
21.2.1.12. Lonza
21.2.1.12.1. Overview
21.2.1.12.2. Product Portfolio
21.2.1.12.3. Profitability by Market Segments (Product/Channel/Region)
21.2.1.12.4. Sales Footprint
21.2.1.12.5. Strategy Overview
21.2.1.12.5.1. Marketing Strategy
21.2.1.12.5.2. Product Strategy
21.2.1.12.5.3. Channel Strategy
21.2.1.13. Cho Chuang Industrial Co., Ltd.
21.2.1.13.1. Overview
21.2.1.13.2. Product Portfolio
21.2.1.13.3. Profitability by Market Segments (Product/Channel/Region)
21.2.1.13.4. Sales Footprint
21.2.1.13.5. Strategy Overview
21.2.1.13.5.1. Marketing Strategy
21.2.1.13.5.2. Product Strategy
21.2.1.13.5.3. Channel Strategy
21.2.1.14. Vive Cosmetics
21.2.1.14.1. Overview
21.2.1.14.2. Product Portfolio
21.2.1.14.3. Profitability by Market Segments (Product/Channel/Region)
21.2.1.14.4. Sales Footprint
21.2.1.14.5. Strategy Overview
21.2.1.14.5.1. Marketing Strategy
21.2.1.14.5.2. Product Strategy
21.2.1.14.5.3. Channel Strategy
21.2.1.15. Ori BioNature Sdn Bhd
21.2.1.15.1. Overview
21.2.1.15.2. Product Portfolio
21.2.1.15.3. Profitability by Market Segments (Product/Channel/Region)
21.2.1.15.4. Sales Footprint
21.2.1.15.5. Strategy Overview
21.2.1.15.5.1. Marketing Strategy
21.2.1.15.5.2. Product Strategy
21.2.1.15.5.3. Channel Strategy
21.2.1.16. Zoic Cosmetics
21.2.1.16.1. Overview
21.2.1.16.2. Product Portfolio
21.2.1.16.3. Profitability by Market Segments (Product/Channel/Region)
21.2.1.16.4. Sales Footprint
21.2.1.16.5. Strategy Overview
21.2.1.16.5.1. Marketing Strategy
21.2.1.16.5.2. Product Strategy
21.2.1.16.5.3. Channel Strategy
21.2.1.17. Samriddhi Life Sciences
21.2.1.17.1. Overview
21.2.1.17.2. Product Portfolio
21.2.1.17.3. Profitability by Market Segments (Product/Channel/Region)
21.2.1.17.4. Sales Footprint
21.2.1.17.5. Strategy Overview
21.2.1.17.5.1. Marketing Strategy
21.2.1.17.5.2. Product Strategy
21.2.1.17.5.3. Channel Strategy
21.2.1.18. Natrocare
21.2.1.18.1. Overview
21.2.1.18.2. Product Portfolio
21.2.1.18.3. Profitability by Market Segments (Product/Channel/Region)
21.2.1.18.4. Sales Footprint
21.2.1.18.5. Strategy Overview
21.2.1.18.5.1. Marketing Strategy
21.2.1.18.5.2. Product Strategy
21.2.1.18.5.3. Channel Strategy
22. Assumptions and Acronyms Used
23. Research Methodology
Let us know your requirement to get
100% FREE customization
Table 01: Global CMO/CDMO Market Value (US$ Mn) Analysis and Opportunity Assessment 2015–2030, By Service
Table 02: Global CMO/CDMO Market Value (US$ Mn) Analysis and Opportunity Assessment 2015–2030, By Product Type
Table 03: Global CMO/CDMO Market Value (US$ Mn) Analysis and Opportunity Assessment 2015–2030, By Form
Table 04: Global CMO/CDMO Market Value (US$ Mn) Analysis and Opportunity Assessment 2015–2030, By Region
Table 05: North America CMO/CDMO Market Value (US$ Mn) Analysis 2015-2019 and Forecast 2020–2030, By Country
Table 06: North America CMO/CDMO Market Value (US$ Mn) Analysis and Opportunity Assessment 2015–2030, By Service
Table 07: North America CMO/CDMO Market Value (US$ Mn) Analysis and Opportunity Assessment 2015–2030, By Product Type
Table 08: North America CMO/CDMO Market Value (US$ Mn) Analysis and Opportunity Assessment 2015–2030, By Form
Table 09: Latin America CMO/CDMO Market Value (US$ Mn) Analysis 2015-2019 and Forecast 2020–2030, By Country
Table 10: Latin America CMO/CDMO Market Value (US$ Mn) Analysis and Opportunity Assessment 2015–2030, By Service
Table 11: Latin America CMO/CDMO Market Value (US$ Mn) Analysis and Opportunity Assessment 2015–2030, By Product Type
Table 12: Latin America CMO/CDMO Market Value (US$ Mn) Analysis and Opportunity Assessment 2015–2030, By Form
Table 13: Europe CMO/CDMO Market Value (US$ Mn) Analysis 2015-2019 and Forecast 2020–2030, By Country
Table 14: Europe CMO/CDMO Market Value (US$ Mn) Analysis and Opportunity Assessment 2015–2030, By Service
Table 15: Europe CMO/CDMO Market Value (US$ Mn) Analysis and Opportunity Assessment 2015–2030, By Product Type
Table 16: Europe CMO/CDMO Market Value (US$ Mn) Analysis and Opportunity Assessment 2015–2030, By Form
Table 17: South Asia CMO/CDMO Market Value (US$ Mn) Analysis 2015-2019 and Forecast 2020–2030, By Country
Table 18: South Asia CMO/CDMO Market Value (US$ Mn) Analysis and Opportunity Assessment 2015–2030, By Service
Table 19: South Asia CMO/CDMO Market Value (US$ Mn) Analysis and Opportunity Assessment 2015–2030, By Product Type
Table 20: South Asia CMO/CDMO Market Value (US$ Mn) Analysis and Opportunity Assessment 2015–2030, By Form
Table 21: East Asia CMO/CDMO Market Value (US$ Mn) Analysis 2015-2019 and Forecast 2020–2030, By Country
Table 22: East Asia CMO/CDMO Market Value (US$ Mn) Analysis and Opportunity Assessment 2015–2030, By Service
Table 23: East Asia CMO/CDMO Market Value (US$ Mn) Analysis and Opportunity Assessment 2015–2030, By Product Type
Table 24: East Asia CMO/CDMO Market Value (US$ Mn) Analysis and Opportunity Assessment 2015–2030, By Form
Table 25: Oceania CMO/CDMO Market Value (US$ Mn) Analysis 2015-2019 and Forecast 2020–2030, By Country
Table 26: Oceania CMO/CDMO Market Value (US$ Mn) Analysis and Opportunity Assessment 2015–2030, By Service
Table 27: Oceania CMO/CDMO Market Value (US$ Mn) Analysis and Opportunity Assessment 2015–2030, By Product Type
Table 28: Oceania CMO/CDMO Market Value (US$ Mn) Analysis and Opportunity Assessment 2015–2030, By Form
Table 29: Middle East and Africa CMO/CDMO Market Value (US$ Mn) Analysis 2015-2019 and Forecast 2020–2030, By Country
Table 30: Middle East and Africa CMO/CDMO Market Value (US$ Mn) Analysis and Opportunity Assessment 2015–2030, By Service
Table 31: Middle East and Africa CMO/CDMO Market Value (US$ Mn) Analysis and Opportunity Assessment 2015–2030, By Product Type
Table 32: Middle East and Africa CMO/CDMO Market Value (US$ Mn) Analysis and Opportunity Assessment 2015–2030, By Form
Find your sweet spots for generating winning opportunities in this market.
Talk to AnalystFigure 01: Global CMO/CDMO Market Value Analysis (US$ Mn), 2015-2019
Figure 02: Global CMO/CDMO Market Value Forecast (US$ Mn), 2020-2030
Figure 03: Global CMO/CDMO Market Absolute $ Opportunity, 2020 - 2030
Figure 04: Global CMO/CDMO Market Share Analysis (%),By Service, 2020-2030
Figure 05: Global CMO/CDMO Market Y-o-Y Analysis (%), By Service, 2020-2030
Figure 06: Global CMO/CDMO Market Attractiveness Analysis by Service, 2020-2030
Figure 07: Global CMO/CDMO Market Share Analysis (%), By Product Type, 2020-2030
Figure 08: Global CMO/CDMO Market Y-o-Y Analysis (%), By Product Type, 2020-2030
Figure 09: Global CMO/CDMO Market Attractiveness Analysis By Product Type, 2020-2030
Figure 10: Global CMO/CDMO Market Share Analysis (%), By Form, 2020-2030
Figure 11: Global CMO/CDMO Market Y-o-Y Analysis (%), By Form, 2020-2030
Figure 12: Global CMO/CDMO Market Attractiveness Analysis By Form, 2020-2030
Figure 13: Global CMO/CDMO Market Share Analysis (%), By Region, 2020-2030
Figure 14: Global CMO/CDMO Market Y-o-Y Analysis (%), By Region, 2020-2030
Figure 15: Global CMO/CDMO Market Attractiveness Analysis by Region, 2020-2030
Figure 16: North America CMO/CDMO Market Value Share, By Service, 2020 (E)
Figure 17: North America CMO/CDMO Market Value Share, By Product Type, 2020 (E)
Figure 18: North America CMO/CDMO Market Value Share, By Form, 2020 (E)
Figure 19: North America CMO/CDMO Market Value Share, By Country, 2020 (E)
Figure 20: North America CMO/CDMO Market Value Analysis (US$ Mn), 2015-2019
Figure 21: North America CMO/CDMO Market Value Forecast (US$ Mn), 2020-2030
Figure 22: North America CMO/CDMO Market Attractiveness Analysis By Service , 2020-2030
Figure 23: North America CMO/CDMO Market Attractiveness Analysis By Product Type, 2020-2030
Figure 24: North America CMO/CDMO Market Attractiveness Analysis By Form, 2020-2030
Figure 25: North America CMO/CDMO Market Attractiveness Analysis by Country, 2020-2030
Figure 26: Latin America CMO/CDMO Market Value Share, By Service, 2020 (E)
Figure 27: Latin America CMO/CDMO Market Value Share, By Product Type, 2020 (E)
Figure 28: Latin America CMO/CDMO Market Value Share, By Form, 2020 (E)
Figure 29: Latin America CMO/CDMO Market Value Share, By Country, 2020 (E)
Figure 30: Latin America CMO/CDMO Market Value Analysis (US$ Mn), 2015-2019
Figure 31: Latin America CMO/CDMO Market Value Forecast (US$ Mn), 2020-2030
Figure 32: Latin America CMO/CDMO Market Attractiveness Analysis By Service , 2020-2030
Figure 33: Latin America CMO/CDMO Market Attractiveness Analysis By Product Type, 2020-2030
Figure 34: Latin America CMO/CDMO Market Attractiveness Analysis By Form, 2020-2030
Figure 35: Latin America CMO/CDMO Market Attractiveness Analysis by Country, 2020-2030
Figure 36: Europe CMO/CDMO Market Value Share, By Service, 2020 (E)
Figure 37: Europe CMO/CDMO Market Value Share, By Product Type, 2020 (E)
Figure 38: Europe CMO/CDMO Market Value Share, By Form, 2020 (E)
Figure 39: Europe CMO/CDMO Market Value Share, By Country, 2020 (E)
Figure 40: Europe CMO/CDMO Market Value Analysis (US$ Mn), 2015-2019
Figure 41: Europe CMO/CDMO Market Value Forecast (US$ Mn), 2020-2030
Figure 42: Europe CMO/CDMO Market Attractiveness Analysis By Service , 2020-2030
Figure 43: Europe CMO/CDMO Market Attractiveness Analysis By Product Type, 2020-2030
Figure 44: Europe CMO/CDMO Market Attractiveness Analysis By Form, 2020-2030
Figure 45: Europe CMO/CDMO Market Attractiveness Analysis by Country, 2020-2030
Figure 46: South Asia CMO/CDMO Market Value Share, By Service, 2020 (E)
Figure 47: South Asia CMO/CDMO Market Value Share, By Product Type, 2020 (E)
Figure 48: South Asia CMO/CDMO Market Value Share, By Form, 2020 (E)
Figure 49: South Asia CMO/CDMO Market Value Share, By Country, 2020 (E)
Figure 50: South Asia CMO/CDMO Market Value Analysis (US$ Mn), 2015-2019
Figure 51: South Asia CMO/CDMO Market Value Forecast (US$ Mn), 2020-2030
Figure 52: South Asia CMO/CDMO Market Attractiveness Analysis By Service , 2020-2030
Figure 53: South Asia CMO/CDMO Market Attractiveness Analysis By Product Type, 2020-2030
Figure 54: South Asia CMO/CDMO Market Attractiveness Analysis By Form, 2020-2030
Figure 55: South Asia CMO/CDMO Market Attractiveness Analysis by Country, 2020-2030
Figure 56: East Asia CMO/CDMO Market Value Share, By Service, 2020 (E)
Figure 57: East Asia CMO/CDMO Market Value Share, By Product Type, 2020 (E)
Figure 58: East Asia CMO/CDMO Market Value Share, By Form, 2020 (E)
Figure 59: East Asia CMO/CDMO Market Value Share, By Country, 2020 (E)
Figure 60: East Asia CMO/CDMO Market Value Analysis (US$ Mn), 2015-2019
Figure 61: East Asia CMO/CDMO Market Value Forecast (US$ Mn), 2020-2030
Figure 62: East Asia CMO/CDMO Market Attractiveness Analysis By Service , 2020-2030
Figure 63: East Asia CMO/CDMO Market Attractiveness Analysis By Product Type, 2020-2030
Figure 64: East Asia CMO/CDMO Market Attractiveness Analysis By Form, 2020-2030
Figure 65: East Asia CMO/CDMO Market Attractiveness Analysis by Country, 2020-2030
Figure 66: Oceania CMO/CDMO Market Value Share, By Service, 2020 (E)
Figure 67: Oceania CMO/CDMO Market Value Share, By Product Type, 2020 (E)
Figure 68: Oceania CMO/CDMO Market Value Share, By Form, 2020 (E)
Figure 69: Oceania CMO/CDMO Market Value Share, By Country, 2020 (E)
Figure 70: Oceania CMO/CDMO Market Value Analysis (US$ Mn), 2015-2019
Figure 71: Oceania CMO/CDMO Market Value Forecast (US$ Mn), 2020-2030
Figure 72: Oceania CMO/CDMO Market Attractiveness Analysis By Service , 2020-2030
Figure 73: Oceania CMO/CDMO Market Attractiveness Analysis By Product Type, 2020-2030
Figure 75: Oceania CMO/CDMO Market Attractiveness Analysis by Country, 2020-2030
Figure 76: Middle East and Africa CMO/CDMO Market Value Share, By Service, 2020 (E)
Figure 77: Middle East and Africa CMO/CDMO Market Value Share, By Product Type, 2020 (E)
Figure 78: Middle East and Africa CMO/CDMO Market Value Share, By Form, 2020 (E)
Figure 79: Middle East and Africa CMO/CDMO Market Value Share, By Country, 2020 (E)
Figure 80: Middle East and Africa CMO/CDMO Market Value Analysis (US$ Mn), 2015-2019
Figure 81: Middle East and Africa CMO/CDMO Market Value Forecast (US$ Mn), 2020-2030
Figure 82: Middle East and Africa CMO/CDMO Market Attractiveness Analysis By Service , 2020-2030
Figure 83: Middle East and Africa CMO/CDMO Market Attractiveness Analysis By Product Type, 2020-2030
Figure 84: Middle East and Africa CMO/CDMO Market Attractiveness Analysis By Form, 2020-2030
Figure 85: MEA CMO/CDMO Market Attractiveness Analysis by Country, 2020-2030
Figure 86: Global CMO/CDMO Market Value Proportion Analysis, By Countries, 2020
Figure 87: CMO/CDMO Market, Global Vs. Country Growth Y-o-Y (%) Comparison, 2020-2030
Figure 88: U.S CMO/CDMO Market Share Analysis (%), By Service, 2020 & 2030
Figure 89: U.S CMO/CDMO Market Share Analysis (%), Product Type, 2020 & 2030
Figure 90: U.S CMO/CDMO Market Share Analysis (%), By Form, 2020 & 2030
Figure 91: Global Vs. U.S Growth Comparison
Figure 92: Canada CMO/CDMO Market Share Analysis (%), By Service, 2020 & 2030
Figure 93: Canada CMO/CDMO Market Share Analysis (%), Product Type, 2020 & 2030
Figure 94: Canada CMO/CDMO Market Share Analysis (%), By Form, 2020 &2030
Figure 95: Global Vs. Canada Growth Comparison
Figure 96: Brazil CMO/CDMO Market Share Analysis (%), By Service, 2020 & 2030
Figure 97: Brazil CMO/CDMO Market Share Analysis (%), Product Type, 2020 & 2030
Figure 98: Brazil CMO/CDMO Market Share Analysis (%), By Form, 2020 &2030
Figure 99: Global Vs. Brazil Growth Comparison
Figure 100: Mexico CMO/CDMO Market Share Analysis (%), By Service, 2020 & 2030
Figure 101: Mexico CMO/CDMO Market Share Analysis (%), Product Type, 2020 & 2030
Figure 102: Mexico CMO/CDMO Market Share Analysis (%), By Form, 2020 &2030
Figure 103: Global Vs. Mexico Growth Comparison
Figure 104: Argentina CMO/CDMO Market Share Analysis (%), By Service, 2020 & 2030
Figure 105: Argentina CMO/CDMO Market Share Analysis (%), Product Type, 2020 & 2030
Figure 106: Argentina CMO/CDMO Market Share Analysis (%), By Form, 2020 &2030
Figure 107: Global Vs. Argentina Growth Comparison
Figure 108: Germany CMO/CDMO Market Share Analysis (%), By Service, 2020 & 2030
Figure 109: Germany CMO/CDMO Market Share Analysis (%), Product Type, 2020 & 2030
Figure 110: Germany CMO/CDMO Market Share Analysis (%), By Form, 2020 &2030
Figure 111: Global Vs. Germany Growth Comparison
Figure 112: France CMO/CDMO Market Share Analysis (%), By Service, 2020 & 2030
Figure 113: France CMO/CDMO Market Share Analysis (%), Product Type, 2020 & 2030
Figure 114: France CMO/CDMO Market Share Analysis (%), By Form, 2020 &2030
Figure 115: Global Vs. France Growth Comparison
Figure 116: U.K CMO/CDMO Market Share Analysis (%), By Service, 2020 & 2030
Figure 117: U.K CMO/CDMO Market Share Analysis (%), Product Type, 2020 & 2030
Figure 118: U.K CMO/CDMO Market Share Analysis (%), By Form, 2020 &2030
Figure 119: Global Vs. U.K Growth Comparison
Figure 120: Spain CMO/CDMO Market Share Analysis (%), By Service, 2020 & 2030
Figure 121: Spain CMO/CDMO Market Share Analysis (%), Product Type, 2020 & 2030
Figure 122: Spain CMO/CDMO Market Share Analysis (%), By Form, 2020 &2030
Figure 123: Global Vs. Spain Growth Comparison
Figure 124: BENELUX CMO/CDMO Market Share Analysis (%), By Service, 2020 & 2030
Figure 125: BENELUX CMO/CDMO Market Share Analysis (%), Product Type, 2020 & 2030
Figure 126: BENELUX CMO/CDMO Market Share Analysis (%), By Form, 2020 &2030
Figure 127: Global Vs. BENELUX Growth Comparison
Figure 128: Russia CMO/CDMO Market Share Analysis (%), By Service, 2020 & 2030
Figure 129: Russia CMO/CDMO Market Share Analysis (%), Product Type, 2020 & 2030
Figure 130: Russia CMO/CDMO Market Share Analysis (%), By Form, 2020 &2030
Figure 131: Global Vs. Russia Growth Comparison
Figure 132: India CMO/CDMO Market Share Analysis (%), By Service, 2020 & 2030
Figure 133: India CMO/CDMO Market Share Analysis (%), Product Type, 2020 & 2030
Figure 134: India CMO/CDMO Market Share Analysis (%), By Form, 2020 &2030
Figure 135: Global Vs. India Growth Comparison
Figure 136: Thailand CMO/CDMO Market Share Analysis (%), By Service, 2020 & 2030
Figure 137: Thailand CMO/CDMO Market Share Analysis (%), Product Type, 2020 & 2030
Figure 138: Thailand CMO/CDMO Market Share Analysis (%), By Form, 2020 &2030
Figure 139: Global Vs. Thailand Growth Comparison
Figure 140: Indonesia CMO/CDMO Market Share Analysis (%), By Service, 2020 & 2030
Figure 141: Indonesia CMO/CDMO Market Share Analysis (%), Product Type, 2020 & 2030
Figure 142: Indonesia CMO/CDMO Market Share Analysis (%), By Form, 2020 &2030
Figure 143: Global Vs. Indonesia Growth Comparison
Figure 144: Malaysia CMO/CDMO Market Share Analysis (%), By Service, 2020 & 2030
Figure 145: Malaysia CMO/CDMO Market Share Analysis (%), Product Type, 2020 & 2030
Figure 146: Malaysia CMO/CDMO Market Share Analysis (%), By Form, 2020 &2030
Figure 147: Global Vs. Malaysia Growth Comparison
Figure 148: China CMO/CDMO Market Share Analysis (%), By Service, 2020 & 2030
Figure 149: China CMO/CDMO Market Share Analysis (%), Product Type, 2020 & 2030
Figure 150: China CMO/CDMO Market Share Analysis (%), By Form, 2020 &2030
Figure 151: Global Vs. China Growth Comparison
Figure 152: Japan CMO/CDMO Market Share Analysis (%), By Service, 2020 & 2030
Figure 153: Japan CMO/CDMO Market Share Analysis (%), Product Type, 2020 & 2030
Figure 154: Japan CMO/CDMO Market Share Analysis (%), By Form, 2020 &2030
Figure 155: Global Vs. Japan Growth Comparison
Figure 156: South Korea CMO/CDMO Market Share Analysis (%), By Service, 2020 & 2030
Figure 157: South Korea CMO/CDMO Market Share Analysis (%), Product Type, 2020 & 2030
Figure 158: South Korea CMO/CDMO Market Share Analysis (%), By Form, 2020 &2030
Figure 159: Global Vs. South Korea Growth Comparison
Figure 160: Australia CMO/CDMO Market Share Analysis (%), By Service, 2020 & 2030
Figure 161: Australia CMO/CDMO Market Share Analysis (%), Product Type, 2020 & 2030
Figure 162: Australia CMO/CDMO Market Share Analysis (%), By Form, 2020 &2030
Figure 163: Global Vs. Australia Growth Comparison
Figure 164: New Zealand CMO/CDMO Market Share Analysis (%), By Service, 2020 & 2030
Figure 165: New Zealand CMO/CDMO Market Share Analysis (%), Product Type, 2020 & 2030
Figure 166: New Zealand CMO/CDMO Market Share Analysis (%), By Form, 2020 &2030
Figure 167: Global Vs. New Zealand Growth Comparison
Figure 168: GCC Countries CMO/CDMO Market Share Analysis (%), By Service, 2020 & 2030
Figure 169: GCC Countries CMO/CDMO Market Share Analysis (%), Product Type, 2020 & 2030
Figure 170: GCC Countries CMO/CDMO Market Share Analysis (%), By Form, 2020 &2030
Figure 171: Global Vs. GCC Countries Growth Comparison
Figure 172: North Africa CMO/CDMO Market Share Analysis (%), By Service, 2020 & 2030
Figure 173: North Africa CMO/CDMO Market Share Analysis (%), Product Type, 2020 & 2030
Figure 174: North Africa CMO/CDMO Market Share Analysis (%), By Form, 2020 &2030
Figure 175: Global Vs. North Africa Growth Comparison
Figure 176: South Africa CMO/CDMO Market Share Analysis (%), By Service, 2020 & 2030
Figure 177: South Africa CMO/CDMO Market Share Analysis (%), Product Type, 2020 & 2030
Figure 178: South Africa CMO/CDMO Market Share Analysis (%), By Form, 2020 &2030
Figure 179: Global Vs. South Africa Growth Comparison
Figure 180: Turkey CMO/CDMO Market Share Analysis (%), By Service, 2020 & 2030
Figure 181: Turkey CMO/CDMO Market Share Analysis (%), Product Type, 2020 & 2030
Figure 182: Turkey CMO/CDMO Market Share Analysis (%), By Form, 2020 &2030
Figure 183: Global Vs. Turkey Growth Comparison
Need specific information?
Request CustomizationExplore Technology Insights
View Reports