

- Market Size (2026)
- USD 2860.6 Mn
- Forecast (2036)
- USD 5841.2 Mn
- CAGR (2026 to 2036)
- 7.4%
How big is the Aerospace Plastic Components Market in 2026?
USD 2,860.6 million in 2026 and USD 5,841.2 million by 2036 at a 7.4% CAGR.
Sales of aerospace plastic components are estimated to rise at 7.4% CAGR through 2036, increasing valuation from USD 2,860.6 million in 2026 to USD 5,841.2 million by 2036. Aircraft utilization pressure is raising attention on polymers that reduce weight and simplify repeatable part production. FAA’s 2026 aerospace forecast states that the cargo carrier large jet aircraft fleet is forecast to increase from 894 aircraft in 2025 to 1,598 aircraft in 2046. The fleet outlook keeps approval-ready polymer parts inside supplier planning for cabin and airframe programs.
India and China are expected to prioritize application engineering and channel access as fleet growth and local aerospace programs increase part qualification work. United States accounts are projected to emphasize tested polymer grades, traceability and authorized supplier routes because FAA approval cycles remain strict. Tier suppliers are likely to gain advantage when replacement support reduces part delay across expanding and regulated fleets.
OEM engineering teams and tier suppliers are expected to purchase aerospace plastic components to shorten qualification work for brackets, seals and interiors. Material engineers compare PEEK, PEKK and PEI grades against flame-smoke-toxicity rules and aircraft-fluid exposure before broader part approval. The adoption case is reinforced by aerospace avionics systems that rely on lighter housings and connector assemblies inside space-limited cabins. Direct OEM programs are projected to favor suppliers that combine material traceability and drawing-level support before repeated production release.
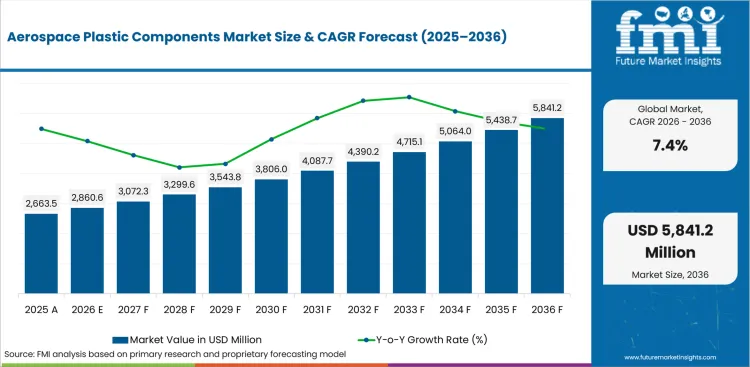
| Metric | Value |
|---|---|
| 2025 Market Size | USD 2,663.5 million |
| 2026 Market Size | USD 2,860.6 million |
| 2036 Market Size | USD 5,841.2 million |
| Forecast CAGR (2026-2036) | 7.4% |
| Sales Channel Focus | Direct OEM |
| Direct OEM Share (2026) | 47.2% |
| Aircraft Type Focus | Commercial Aircraft |
| Commercial Aircraft Share (2026) | 40.9% |
| Component Type Focus | Interior Components |
| Interior Components Share (2026) | 38.0% |
| Fastest-growing Country | India |
| India CAGR by 2036 | 9.1% |
Summary of the Aerospace Plastic Components Market
| Market Signal | Commercial Impact |
|---|---|
| Demand and Growth Drivers | OEM qualification pressure is expected to push spending toward plastic parts that reduce weight and rework. Documentation needs are projected to make engineering teams test evidence before repeat approvals.
|
| Product and Segment View | Direct OEM and commercial aircraft segments are expected to lead their parent categories in 2026. Interior components are forecast to remain visible due to cabin replacement and fit-control requirements.
|
| Geography and Growth Outlook | India and China are projected to form the higher-growth tier due to fleet expansion and local program scale. The United States and Europe are expected to grow under documentation-heavy adoption cycles.
|
| Competitive Landscape | Competition is moderately concentrated around certified polymer portfolios and aerospace program access. Sourcing screens are expected to center on qualification evidence and technical support continuity.
|
| Analyst Perspective | Aerospace plastic components are expected to gain share where they reduce release work rather than merely replacing metal. Engineering teams need material choices that survive flame, fluid, tolerance and traceability review across line-fit, retrofit and MRO routes.
- Nikhil Kaitwade, Principal Analyst at Future Market Insights |
Source: FMI's proprietary forecasting model and primary research
How is the Aerospace Plastic Components Market Segmented?
The aerospace plastic components industry is segmented by component type, material, aircraft type, manufacturing process, sales channel, and region.
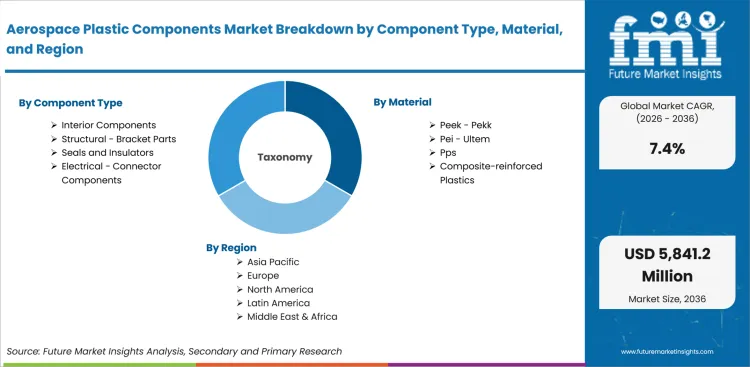
The aerospace plastic components market is segmented by component type, material, aircraft type, manufacturing process, sales channel, and region. By component type, it covers interior components, structural / bracket parts, seals and insulators, and electrical / connector components. By material, it covers PEEK / PEKK, PEI / Ultem, PPS, and composite-reinforced plastics. By aircraft type, it covers commercial aircraft, business jets, defense aircraft, and space / UAV platforms. By manufacturing process, it covers injection molding, machining, thermoforming, and additive manufacturing. By sales channel, it covers tier supplier, direct OEM, and MRO / replacement. Regional coverage includes North America, Latin America, Europe, East Asia, South Asia and Pacific, and Middle East and Africa.
How does direct OEM shape purchasing within the sales channel category?
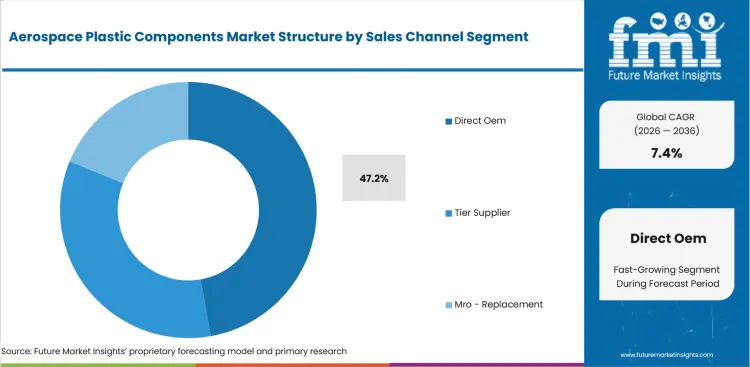
Aircraft program sourcing favors channel routes that preserve drawing control and part history throughout approval. CAAC reported 209 design approvals and 36 production approvals in 2024, which shows how certificate workload keeps documentation close to sourcing. Direct OEM sourcing helps engineering teams trace grade selection, tool ownership and revision updates before repeated component release.
- By sales channel, direct OEM is projected to account for 47.2% share in 2026 driven by control over qualification files and engineering-change release. CAAC recorded 57 approvals for aviation fuel and chemical products in 2024, which keeps material documentation inside aerospace purchasing reviews.
- Direct OEM demand is expected to grow among aircraft program teams owing to service ownership and release-control discipline. Accounts comparing aerospace electrical inserts also need suppliers that respond to design changes before cabins or connector assemblies move into larger production lots.
What supports commercial aircraft demand within the aircraft type category?
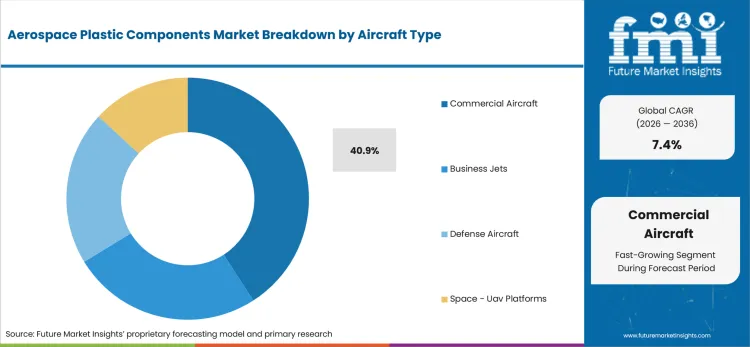
Commercial aircraft programs use plastic components differently from business jets due to higher cabin repetition and larger retrofit populations. ICAO reported 37.4 million scheduled service departures in 2024, which keeps airframe utilization and replacement planning visible. Commercial accounts therefore test interior plastics for repeatability, part marking and service availability before suppliers receive wider approval.
- In 2026, commercial aircraft is estimated to lead aircraft type demand with 40.9% share owing to cabin refurbishment volume and narrow-body fleet needs. FAA reported 29.0 million general aviation hours flown in 2024, which signals heavier aircraft utilization and more structured parts planning.
- Airframe sourcing teams are increasingly purchasing plastic components led by weight control and replacement consistency expectations. Supplier reports that connect polymer grade behavior to cabin inspection routines help technical teams reduce repeated approval work before broader line-fit or retrofit use.
How do interiors teams evaluate components within the component type category?
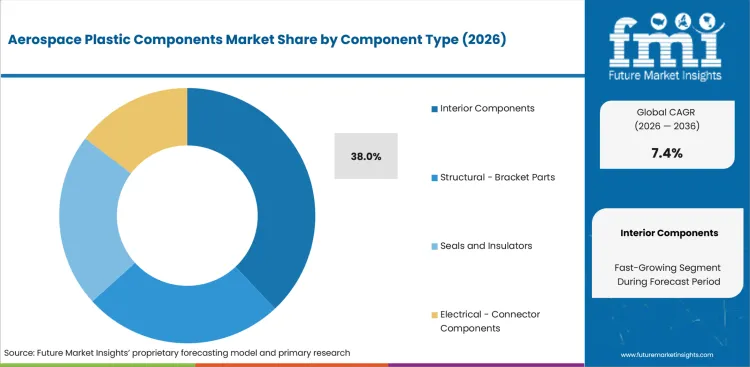
Cabin interiors create a visible approval challenge due to lower weight needs and flame-rated performance. UK CAA reported 81 million passengers through UK airports between April and June 2025, which keeps high-cycle cabin use inside refurbishment planning. Interior component suppliers therefore need test files that support color consistency, surface durability and regulated fire performance.
- Interior components are forecast to represent 38.0% of component type demand in 2026 attributable to cabin refresh cycles and flame-smoke-toxicity screening. UK CAA also reported 75% on-time flights in the same quarter, which reinforces the value of replacement parts that avoid maintenance delay.
- Interior integrators are anticipated to favor molded and machined plastic parts due to weight targets and cabin appearance checks. They need suppliers that document surface finish behavior and part traceability before seating, sidewall or lighting assemblies enter recurring refurbishment work.
What drives PEEK / PEKK selection within the material category?
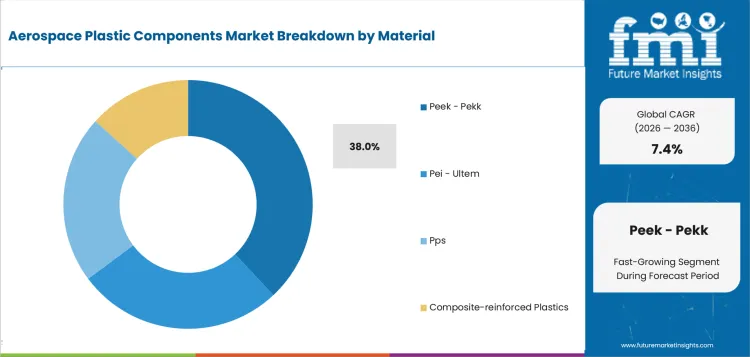
Aviation polymer selection begins with heat resistance and fluid exposure before cost enters the discussion. Syensqo stated in February 2026 that its aviation thermoplastic portfolio includes KetaSpire PEEK and Novaspire PEKK, which keeps qualification at the material family level. PEEK and PEKK grades are reviewed closely for brackets, films and composite tapes that need stable behavior in aircraft operating environments.
- By material, PEEK / PEKK is likely to capture 38.0% share in 2026 supported by high-temperature performance and aircraft-fluid resistance. Victrex describes PEEK and PAEK aerospace polymers for chemical resistance to aviation fluids, which connects material choice to long-life part qualification.
- Demand for PEEK / PEKK is expected to grow among material engineers attributable to flame-rated interiors and bracket replacement needs. Engineers comparing aromatic ketone polymer demand are expected to favor suppliers that provide processing windows and allowables before program approval.
How is injection molding positioned within the manufacturing process category?
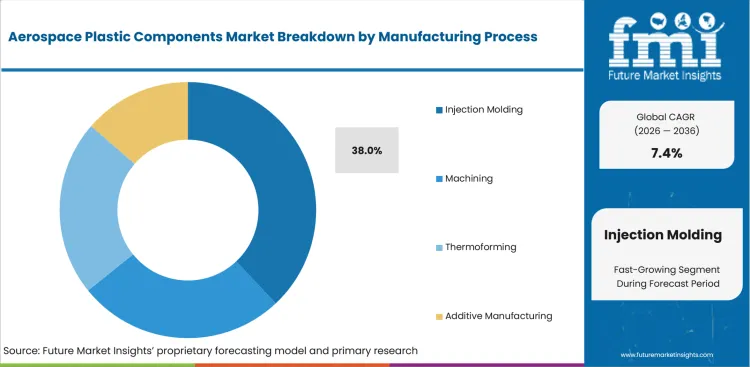
High-volume interior and connector parts create a process decision before material pricing is reviewed. GAMA valued aircraft deliveries at USD 31.2 billion in 2024, which keeps repeatable manufacturing inputs tied to production-ready material availability. Injection molding remains useful where repeat part geometry and cycle discipline decide whether an aerospace plastic component passes qualification.
- The manufacturing process category is forecast to be led by injection molding at 38.0% share in 2026 due to repeatable geometry and scalable part output. SABIC stated in May 2024 that ULTEM 9085 resin supports injection-molded passenger service units, which keeps molding evidence inside cabin plastic reviews.
- Purchase activity for injection-molded parts is anticipated to rise driven by interior fasteners and connector housings that need repeatable tolerances. Teams reviewing bulk molding compound applications also compare molding consistency before switching from machined parts in repeatable production programs.
What are the drivers, restraints, and opportunities in the Aerospace Plastic Components Market?
Near-term purchases are being shaped by lightweight qualification needs, certification and tooling constraints, and retrofit channel access outlined below.
- Driver: Aircraft OEMs are expected to purchase qualified plastic components to reduce weight and repeat engineering release effort.
- Restraint: Adoption is anticipated to slow where qualification evidence remains incomplete and tooling payback is unclear.
- Opportunity: Retrofit and MRO programs are projected to open access for suppliers that document replacement reliability.
Aircraft manufacturers are expected to raise interest in plastics that remove weight without adding certification uncertainty. GAMA released the 2024 aircraft shipment report in February 2025 and valued preliminary aircraft deliveries at USD 31.2 billion. The value keeps components tied to production-ready material availability and supplier accountability. OEM engineering teams need that combination before approving polymer-based alternatives inside existing aircraft platforms.
Qualification teams are likely to delay part substitution if test evidence does not match the aircraft use case. FAA certification rules keep applicants responsible for showing compliance before type approval and production release. Documentation gaps are therefore expected to extend sampling cycles and increase internal review cost. Smaller component suppliers face greater strain because tooling investment must be recovered before larger recurring orders start.
Retrofit channels are projected to convert part-approval barriers into a more structured access route. Ensinger expanded thermoplastic composites capacity in June 2024 using a high-performance double-belt press.
Which country CAGRs are profiled in the Aerospace Plastic Components Market?
.webp "Top Country Growth Comparison Aerospace Plastic Components Market Cagr (2026 2036)")
| Country | CAGR |
|---|---|
| United States | 7.1% |
| China | 8.5% |
| India | 9.1% |
| Germany | 6.5% |
| United Kingdom | 6.7% |
| Japan | 6.5% |
| South Korea | 7.5% |
| Rest of World | 7.8% |
Source: FMI's proprietary forecasting model and primary research
How do country-level CAGRs compare in the Aerospace Plastic Components Market?
Country CAGRs indicate two adoption tracks for aerospace plastic components. India at 9.1% and China at 8.5% are projected to rise under fleet expansion and local aerospace investment. Rest of World at 7.8% and South Korea at 7.5% are likely to reflect hub expansion and installation support. The United States at 7.1% is expected to move under qualification-led supplier rotation. The United Kingdom at 6.7% is forecast to remain service-led. Germany at 6.5% and Japan at 6.5% are expected to remain documentation-heavy accounts.
- By 2036, the United States is projected to grow at 7.1% CAGR supported by aircraft delivery recovery and certification discipline. The FAA reported USA-manufactured general aviation aircraft deliveries of 2,316 units in 2025. The figure raises demand for polymer parts that combine lower weight and qualified processing behavior across new aircraft and replacement programs. Sourcing teams are expected to check tooling readiness before releasing repeat orders into production schedules. Local OEMs and tier suppliers remain cautious due to traceability and FAA-facing paperwork. Victrex and SABIC are positioned to gain traction where programs require high-temperature polymer evidence and domestic engineering support.
- China's aerospace plastic components outlook is anticipated to advance at 8.5% CAGR over the assessment period propelled by fleet growth and domestic route scale. CAAC reported that registered transport aircraft reached 4,394 in 2024. The fleet base increases demand for interiors, brackets and connector parts that support high-cycle use across passenger aircraft. Regional distributors are expected to hold inventory depth before OEMs approve broader part substitution across programs. Local procurement is shaped by certificate workload and production localization owing to supplier response needs during technical review. Syensqo and Toray Advanced Composites are positioned to receive closer attention where aerospace programs need PEKK tapes and composite material qualification.
- Aerospace plastic component demand in India is forecast to rise at 9.1% CAGR over the forecast period driven by aircraft deliveries and airport buildout. PIB reported outstanding deliveries of 1,640 aircraft for Indian carriers in May 2026. The delivery pipeline is expected to pull cabin plastics, connector housings and bracket parts into deeper supplier qualification. Local adoption is constrained by price discipline and service access due to the need for fast engineering support. Suppliers with documented lightweight parts and India-facing logistics are expected to receive stronger consideration in airline and MRO accounts.
- Germany is estimated to post 6.5% CAGR over the forecast period shaped by quality review discipline and aerospace production controls. Destatis reported 97,324,895 boarding air passengers at German airports in 2025. Passenger recovery keeps interior refurbishment and spare-part planning visible for airlines and component maintenance teams. German engineering accounts often require material traceability and process validation before commercial negotiations expand. Röchling and Ensinger are well placed where teams prefer regional service and semi-finished shape access.
- The United Kingdom sector is projected to record 6.7% CAGR during the assessment period influenced by service accountability and aircraft interiors work. UK Civil Aviation Authority reported 81 million passengers through UK airports between April and June 2025. High passenger throughput increases attention on cabin durability and quick replacement access across airline maintenance plans. MRO teams are expected to favor suppliers that answer technical questions before aircraft downtime widens. Local purchasing is shaped by imported material routes and regulatory accountability under UK CAA oversight.
- Japan's plastic component demand is predicted to advance at 6.5% CAGR through 2036 strengthened by airspace capacity planning and cautious supplier approval. MLIT's CARATS2040 plan used approximately 2 million aircraft as Japan's annual aircraft handling capacity in 2024. The capacity baseline connects polymer components to maintenance reliability and air traffic continuity. Japanese OEM and airline accounts often test suppliers over longer cycles before approving material substitution. Toray Advanced Composites gains relevance where domestic engineering teams need composite material familiarity and local support.
- In South Korea, aerospace plastic component demand is estimated to expand at 7.5% CAGR through 2036 attributable to hub expansion and compact supply chains. Incheon International Airport Corporation reported annual capacity of 106 million passengers after its Phase 4 expansion. The capacity raises demand for durable cabin parts and connector assemblies across airline maintenance and airport-linked service ecosystems.
- Aerospace plastic component sales in Rest of World are forecast to expand at 7.8% CAGR by 2036 supported by uneven fleet growth and import-led sourcing. ICAO reported 4.7 billion passengers carried on scheduled services in 2024. The global traffic base keeps replacement plastics relevant in markets that lack deep local aerospace material supply. Regional sourcing teams are expected to compare service access before moving beyond small trial orders. Adoption is constrained by customs lead times and limited technical support outside established production hubs.
Who are the notable companies in the Aerospace Plastic Components Market?
Victrex, Syensqo, SABIC, Toray Advanced Composites, Ensinger, Röchling, Saint-Gobain, Collins Aerospace, Safran, and TE Connectivity are the notable companies shaping this market.
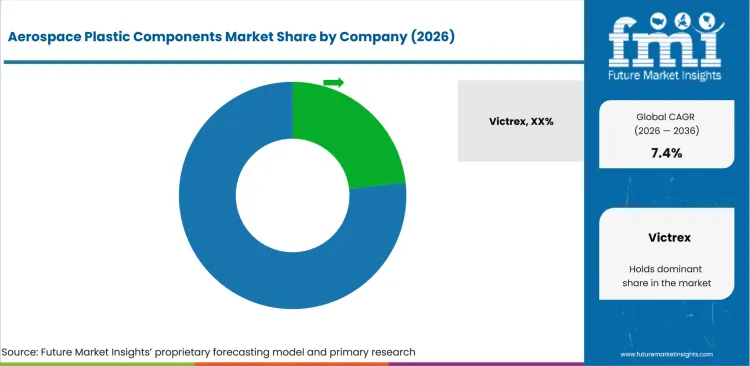
Competition is moderately concentrated at the material qualification layer and more fragmented at machining and replacement levels. Multinational polymer groups hold advantages in test files, global supply and aircraft-program references. Regional specialists compete where machining response and small-batch support decide account access. Competition centers on flame-smoke-toxicity evidence, tolerance stability and channel continuity. Accounts comparing wear grade PEEK polymers are expected to favor suppliers that combine grade documentation and application support before repeat orders.
- Material qualification separates Victrex and Syensqo from suppliers that only offer commodity engineering plastics. Victrex supports aerospace programs through PEEK and PAEK materials used for chemical resistance and lower-density parts. Syensqo adds qualification depth through KetaSpire PEEK, Novaspire PEKK and APC thermoplastic composites.
- Heat-resistant resin choice brings SABIC into specifications that need molded performance and aircraft-fluid resistance. ULTEM resin offers dimensional stability and resistance around aircraft fluids. The company therefore fits applications such as housings, interiors and composite toughening. Sourcing teams are expected to test SABIC against suppliers that provide narrower aerospace processing support.
- Machined-part sourcing gives Ensinger, Röchling and Saint-Gobain a different competitive role. These suppliers support accounts that need semi-finished shapes, precision machining and local conversion before volume expands.
- Systems integration favors Collins Aerospace, Safran and TE Connectivity in applications linked to cabins and electrical assemblies. These companies do not compete only as raw material providers in this specialized component category. Their advantage comes from program access and component-level familiarity inside aircraft systems.
Competitive Benchmarking: Aerospace Plastic Components Market
| Company | Aerospace polymer fit | Machining and process reach | Program access | Service reach |
|---|---|---|---|---|
| Victrex | High | Strong | Medium | Global |
| Syensqo | High | Strong | Strong | Global |
| SABIC | High | Medium | Strong | Global |
| Toray Advanced Composites | Strong | Medium | High | Global |
| Ensinger | Strong | High | Medium | Regional |
| Röchling | Strong | High | Medium | Regional |
| Saint-Gobain | Medium | Strong | Medium | Global |
| Collins Aerospace | Medium | High | Strong | Global |
| Safran | Medium | High | Strong | Global |
| TE Connectivity | Strong | Medium | High | Global |
Source: Future Market Insights competitive analysis, 2026. Ratings reflect relative portfolio relevance and workflow fit. Service capability and geographic reach shape the remaining comparison.
Key Developments in the Aerospace Plastic Components Market
- In August 2025, Victrex secured multiple industry awards for its LMPAEK polymer technology. The material family was developed to simplify processing across PAEK applications while providing OEMs with an additional option for components requiring high-temperature performance.
- In May 2026, SABIC introduced the ULTEM™ SU3102P reactive oligomer for lightweight aerospace composite applications. The material was positioned for use in both primary and secondary aircraft structures, including wings, fuselage frames, and interior components.
- In February 2025, Toray Group announced its JEC World 2025 exhibition showcasing next-generation composite technologies. The exhibit featured TORAYCA carbon fiber, towpreg materials, thermoset composite systems, and Cetex thermoplastic composites.
Key Players in the Aerospace Plastic Components Market
High-performance polymer and composite material suppliers
- Victrex
- Syensqo
- SABIC
- Toray Advanced Composites
Machined plastic component and semi-finished shape suppliers
- Ensinger
- Röchling
- Saint-Gobain
Aerospace systems and connector suppliers
- Collins Aerospace
- Safran
- TE Connectivity
Aerospace Plastic Components Market - Report Scope
| Coverage field | Report scope |
|---|---|
| Market breakdown | Aerospace Plastic Components Market Breakdown By Component Type, Material, Aircraft Type, Manufacturing Process, Sales Channel, and Region |
| Market Definition | Aerospace plastic components are qualified polymer or composite parts used in aircraft interiors, brackets, seals, insulators and electrical housings by OEMs, tier suppliers and MRO teams. |
| Regions Covered | North America, Latin America, Europe, East Asia, South Asia and Pacific, and Middle East and Africa |
| Countries Covered | United States, China, India, Germany, United Kingdom, Japan, South Korea, and 30+ countries |
| Key Companies Profiled | Victrex, Syensqo, SABIC, Toray Advanced Composites, Ensinger, Röchling, Saint-Gobain, Collins Aerospace, Safran, and TE Connectivity |
| Forecast Period | 2026 to 2036 |
| Approach | Hybrid bottom-up and top-down methodology using component qualification rates, polymer grade adoption, aircraft platform demand, sales channel mix and country-level fleet indicators |
Source: Future Market Insights - analysis driven by proprietary forecasting models and primary research
Aerospace Plastic Components Market - Research Methodology
| Method | Approach |
|---|---|
| Primary Research | FMI analysts interviewed OEM engineering teams, tier supplier heads, aerospace material specialists and MRO component planners. Interviews focused on part qualification time, grade traceability, flame-smoke-toxicity evidence, tooling economics and service support after approval. Respondents also reviewed how direct OEM purchases differ from tier supplier and replacement channels during aircraft program decisions. The findings were reconciled against segment shares before forecast modeling. |
| Desk Research | Desk research reviewed FAA aviation forecasts, CAAC annual reports, civil aviation regulator releases, national statistics offices, official airport authority data and company product pages. Product relevance was checked against aerospace polymer grades, interior flammability needs, aircraft-fluid resistance, machinable shape availability and connector or cabin component use. Sources outside aviation materials or aircraft parts were excluded from the final company review. |
| Market Sizing and Forecasting | Market sizing combined 2026 value baselines, 2036 forecast outputs, segment share allocation and country CAGR assumptions. The model used bottom-up demand from component type, material grade, aircraft type, manufacturing process and sales channel data. Top-down checks compared country values against fleet activity, airport expansion signals and supplier portfolio relevance. Forecast assumptions were adjusted for direct OEM qualification behavior and MRO replacement cycles. |
| Data Validation | Data validation checked forecast outputs against country totals, segment shares, official aviation activity, supplier portfolio reviews and evidence from company product disclosures. Company portfolios were reviewed to avoid counting adjacent chemical, composite or systems products without aerospace plastic component relevance. |
Source: Future Market Insights (FMI) analysis, based on proprietary forecasting model and primary research
Aerospace Plastic Components Market by Segments
Aerospace Plastic Components Market segmented by Component Type:
- Interior Components
- Structural / Bracket Parts
- Seals and Insulators
- Electrical / Connector Components
Aerospace Plastic Components Market segmented by Material:
- PEEK / PEKK
- PEI / Ultem
- PPS
- Composite-reinforced Plastics
Aerospace Plastic Components Market segmented by Aircraft Type:
- Commercial Aircraft
- Business Jets
- Defense Aircraft
- Space / UAV Platforms
Aerospace Plastic Components Market segmented by Manufacturing Process:
- Injection Molding
- Machining
- Thermoforming
- Additive Manufacturing
Aerospace Plastic Components Market segmented by Sales Channel:
- Tier Supplier
- Direct OEM
- MRO / Replacement
Aerospace Plastic Components Market by Region:
- North America
- United States
- Canada
- Latin America
- Brazil
- Mexico
- Europe
- Germany
- United Kingdom
- France
- Italy
- Spain
- East Asia
- China
- Japan
- South Korea
- South Asia and Pacific
- India
- ASEAN
- Australia and New Zealand
- Middle East and Africa
- Gulf Cooperation Council
- South Africa
- Rest of Middle East and Africa
Research Sources and Bibliography
- Federal Aviation Administration. (2026, May). FAA Aerospace Forecast Fiscal Years 2026-2046. Federal Aviation Administration.
- Civil Aviation Administration of China. (2025, December). Statistical Bulletin of Civil Aviation Industry Development in 2024. Civil Aviation Administration of China.
- Press Information Bureau. (2026, May). India aircraft leasing & financing summit 2.0. Government of India.
- German Federal Statistical Office. (2026). Boarding air passengers at German Airports. Destatis.
- UK Civil Aviation Authority. (2025, August). UK Aviation Growth Continues with Record Passenger Numbers. UK Civil Aviation Authority.
- Ministry of Land, Infrastructure, Transport and Tourism. (2026, April). Collaborative Actions for Renovation of Air Traffic Systems 2040. Government of Japan.
- Incheon International Airport Corporation. (2024, December). Phase 4 Construction Projects. Incheon International Airport Corporation.
- International Civil Aviation Organization. (2025). Annual Report 2024 - The World of Air Transport in 2024. International Civil Aviation Organization.
- General Aviation Manufacturers Association. (2025, February). GAMA Releases 2024 Aircraft Shipment and Billing Report. General Aviation Manufacturers Association.
- Victrex. (2025, August). VICTREX LMPAEK™ Polymer: Award-Winning Next-Generation PAEK Material Technology. Victrex.
- Syensqo. (2026, February). Thermoplastic Composites - Our markets. Syensqo.
- SABIC. (2026, May). SABIC launches ULTEM™ reactive oligomer for tough, lightweight aerospace composites. SABIC.
- Toray Advanced Composites. (2025, February). Toray Group to Exhibit Next Generation Composite Technologies at JEC World 2025. Toray Advanced Composites.
- Ensinger. (2024, June). Ensinger expands its production capacity for thermoplastic composites. Ensinger.
- SABIC. (2024, May). SABIC’s versatile ULTEM™ resins, on display at AIX 2024, help enable lightweight and durable aircraft interiors. SABIC.
- Victrex. (2026). PEEK for Aerospace Applications. Victrex.
This bibliography is provided for reader reference and uses primary government, standards-body, official trade body, and company sources.
This Report Answers
- What are the estimated values of the Aerospace Plastic Components Market in 2026 and 2036?
- What CAGR is expected for the Aerospace Plastic Components Market from 2026 to 2036?
- Which segments shape demand across component type, material, aircraft type, manufacturing process and sales channel categories?
- Which qualification and service pressures support aerospace plastic component purchase activity?
- How do country CAGRs differ across the United States, China, India, Germany, the United Kingdom, Japan and South Korea?
- Which companies compete across polymer qualification, machining reach, program access and service reach?
- How does FMI validate forecasts using a hybrid bottom-up and top-down model?
- What factors should OEM engineering teams and tier supplier procurement teams address before broader sourcing commitment?
- How do claims review, documentation depth and aviation qualification requirements affect supplier selection?
Frequently Asked Questions
What is driving growth in the Aerospace Plastic Components Market?
Growth is being driven by lightweight part substitution and qualified polymer use in interiors, brackets, seals and electrical components. OEMs seek materials that reduce weight and repeat release effort.
Who are the key players in the Aerospace Plastic Components Market?
Key players include Victrex, Solvay, SABIC, Ensinger, Drake Plastics, Toray, Röchling, Quadrant and Celanese. Competition centers on polymer qualification, machining reach and program support.
What is a significant restraint in the Aerospace Plastic Components Market?
A significant restraint is long qualification cycles and uncertain tooling payback. Incomplete application evidence can delay movement from trial orders to repeat supply.
Why should executives track the Aerospace Plastic Components Market?
Executives should track this market because plastics influence aircraft weight, replacement planning and qualification cost. Supplier selection affects whether material substitution reduces engineering work or adds approval friction.
What business problem does the Aerospace Plastic Components Market address?
The market addresses the need for lighter aircraft parts that still meet strict fire, fluid and durability expectations. It also helps engineering teams reduce repeat release work across cabin and connector assemblies.
What should procurement leaders evaluate before selecting suppliers?
Procurement leaders should evaluate grade traceability, tolerance control, aerospace references and service response. They should also review whether suppliers support line-fit, retrofit and MRO routes without documentation gaps.
What can limit return on investment for buyers?
Return on investment is likely to be limited by long qualification cycles and uncertain tooling payback. Weak application support also delays the move from trial orders to repeat supply.
How can suppliers build long-term account confidence?
Suppliers build account confidence by providing test evidence, stable processing windows and clear part history. Long-term retention is expected to improve when technical support continues after first approval.
Preview the report firsthand - request a free sample
Get SampleGet the brochure for pricing and purchase details.
Get PDFTable of Content
- Key Takeaways
- Market Size and CAGR
- Top Growth Driver
- Fastest Growing Segment
- Leading Region
- Key Companies
- Emerging Opportunities
- Executive Summary
- Global Market Outlook
- Demand-side Trends
- Supply-side Trends
- Technology Roadmap Analysis
- Analysis and Recommendations
- Analyst Perspective (What is happening? Why now? What should investors know?)
- Key Questions Answered
- How large is the market?
- What is the CAGR?
- What are key trends?
- Which region dominates?
- Who are the leaders?
- Market Overview
- Market Coverage / Taxonomy
- Market Definition / Scope / Limitations
- Research Methodology
- Chapter Orientation
- Analytical Lens and Working Hypotheses
- Market Structure, Signals, and Trend Drivers
- Benchmarking and Cross-market Comparability
- Market Sizing, Forecasting, and Opportunity Mapping
- Research Design and Evidence Framework
- Desk Research Programme (Secondary Evidence)
- Expert Input and Fieldwork (Primary Evidence)
- Tooling, Models, and Reference Databases
- Data Engineering and Model Build
- Quality Assurance and Audit Trail
- Market Background
- Market Dynamics (Drivers, Restraints, Opportunity, Trends)
- Scenario Forecast (Optimistic, Likely, Conservative)
- Impact Analysis
- AI Impact
- Sustainability Impact
- Regulatory Impact
- Technology Impact
- Consumer / Buyer Analysis
- Purchase Drivers
- Adoption Barriers
- Buyer Journey
- Opportunity Map Analysis
- Product Life Cycle Analysis
- Supply Chain Analysis
- Investment Feasibility Matrix
- Value Chain Analysis
- PESTLE and Porter's Analysis
- Regulatory Landscape
- Regional Parent Market Outlook
- Production and Consumption Statistics
- Import and Export Statistics
- Global Market Analysis and Forecast, 2021 to 2036
- Historical Market Size Value (USD Million) & Volume (Unit) Analysis, 2021 to 2025
- Current and Future Market Size Value (USD Million) & Volume (Unit) Projections, 2026 to 2036
- Y-o-Y Growth Trend Analysis
- Absolute $ Opportunity Analysis
- Global Market Pricing Analysis, 2021 to 2036
- Global Market Analysis and Forecast, By Component Type, 2021 to 2036
- Introduction / Key Findings
- Historical Market Size Value (USD Million) & Volume (Unit) Analysis By Component Type, 2021 to 2025
- Current and Future Market Size Value (USD Million) & Volume (Unit) Analysis and Forecast By Component Type, 2026 to 2036
- Interior Components
- Structural - Bracket Parts
- Seals and Insulators
- Electrical - Connector Components
- Interior Components
- Y-o-Y Growth Trend Analysis By Component Type, 2021 to 2025
- Absolute $ Opportunity Analysis By Component Type, 2026 to 2036
- Global Market Analysis and Forecast, By Material, 2021 to 2036
- Introduction / Key Findings
- Historical Market Size Value (USD Million) & Volume (Unit) Analysis By Material, 2021 to 2025
- Current and Future Market Size Value (USD Million) & Volume (Unit) Analysis and Forecast By Material, 2026 to 2036
- Peek - Pekk
- Pei - Ultem
- Pps
- Composite-reinforced Plastics
- Peek - Pekk
- Y-o-Y Growth Trend Analysis By Material, 2021 to 2025
- Absolute $ Opportunity Analysis By Material, 2026 to 2036
- Global Market Analysis and Forecast, By Aircraft Type, 2021 to 2036
- Introduction / Key Findings
- Historical Market Size Value (USD Million) & Volume (Unit) Analysis By Aircraft Type, 2021 to 2025
- Current and Future Market Size Value (USD Million) & Volume (Unit) Analysis and Forecast By Aircraft Type, 2026 to 2036
- Commercial Aircraft
- Business Jets
- Defense Aircraft
- Space - Uav Platforms
- Commercial Aircraft
- Y-o-Y Growth Trend Analysis By Aircraft Type, 2021 to 2025
- Absolute $ Opportunity Analysis By Aircraft Type, 2026 to 2036
- Global Market Analysis and Forecast, By Manufacturing Process, 2021 to 2036
- Introduction / Key Findings
- Historical Market Size Value (USD Million) & Volume (Unit) Analysis By Manufacturing Process, 2021 to 2025
- Current and Future Market Size Value (USD Million) & Volume (Unit) Analysis and Forecast By Manufacturing Process, 2026 to 2036
- Injection Molding
- Machining
- Thermoforming
- Additive Manufacturing
- Injection Molding
- Y-o-Y Growth Trend Analysis By Manufacturing Process, 2021 to 2025
- Absolute $ Opportunity Analysis By Manufacturing Process, 2026 to 2036
- Global Market Analysis and Forecast, By Sales Channel, 2021 to 2036
- Introduction / Key Findings
- Historical Market Size Value (USD Million) & Volume (Unit) Analysis By Sales Channel, 2021 to 2025
- Current and Future Market Size Value (USD Million) & Volume (Unit) Analysis and Forecast By Sales Channel, 2026 to 2036
- Direct Oem
- Tier Supplier
- Mro - Replacement
- Direct Oem
- Y-o-Y Growth Trend Analysis By Sales Channel, 2021 to 2025
- Absolute $ Opportunity Analysis By Sales Channel, 2026 to 2036
- Global Market Analysis and Forecast, By Region, 2021 to 2036
- Introduction
- Historical Market Size Value (USD Million) & Volume (Unit) Analysis By Region, 2021 to 2025
- Current Market Size Value (USD Million) & Volume (Unit) Analysis and Forecast By Region, 2026 to 2036
- North America
- Latin America
- Western Europe
- Eastern Europe
- East Asia
- South Asia and Pacific
- Middle East & Africa
- Market Attractiveness Analysis By Region
- North America Market Analysis and Forecast, By Country, 2021 to 2036
- Historical Market Size Value (USD Million) & Volume (Unit) Trend Analysis By Market Taxonomy, 2021 to 2025
- Market Size Value (USD Million) & Volume (Unit) Forecast By Market Taxonomy, 2026 to 2036
- By Country
- USA
- Canada
- Mexico
- By Component Type
- By Material
- By Aircraft Type
- By Manufacturing Process
- By Sales Channel
- By Country
- Market Attractiveness Analysis
- By Country
- By Component Type
- By Material
- By Aircraft Type
- By Manufacturing Process
- By Sales Channel
- Key Takeaways
- Latin America Market Analysis and Forecast, By Country
- Historical Market Size Value (USD Million) & Volume (Unit) Trend Analysis By Market Taxonomy, 2021 to 2025
- Market Size Value (USD Million) & Volume (Unit) Forecast By Market Taxonomy, 2026 to 2036
- By Country
- Brazil
- Chile
- Rest of Latin America
- By Component Type
- By Material
- By Aircraft Type
- By Manufacturing Process
- By Sales Channel
- By Country
- Market Attractiveness Analysis
- By Country
- By Component Type
- By Material
- By Aircraft Type
- By Manufacturing Process
- By Sales Channel
- Key Takeaways
- Western Europe Market Analysis and Forecast, By Country
- Historical Market Size Value (USD Million) & Volume (Unit) Trend Analysis By Market Taxonomy, 2021 to 2025
- Market Size Value (USD Million) & Volume (Unit) Forecast By Market Taxonomy, 2026 to 2036
- By Country
- Germany
- UK
- Italy
- Spain
- France
- Nordic
- BENELUX
- Rest of Western Europe
- By Component Type
- By Material
- By Aircraft Type
- By Manufacturing Process
- By Sales Channel
- By Country
- Market Attractiveness Analysis
- By Country
- By Component Type
- By Material
- By Aircraft Type
- By Manufacturing Process
- By Sales Channel
- Key Takeaways
- Eastern Europe Market Analysis and Forecast, By Country
- Historical Market Size Value (USD Million) & Volume (Unit) Trend Analysis By Market Taxonomy, 2021 to 2025
- Market Size Value (USD Million) & Volume (Unit) Forecast By Market Taxonomy, 2026 to 2036
- By Country
- Russia
- Poland
- Hungary
- Balkan & Baltic
- Rest of Eastern Europe
- By Component Type
- By Material
- By Aircraft Type
- By Manufacturing Process
- By Sales Channel
- By Country
- Market Attractiveness Analysis
- By Country
- By Component Type
- By Material
- By Aircraft Type
- By Manufacturing Process
- By Sales Channel
- Key Takeaways
- East Asia Market Analysis and Forecast, By Country
- Historical Market Size Value (USD Million) & Volume (Unit) Trend Analysis By Market Taxonomy, 2021 to 2025
- Market Size Value (USD Million) & Volume (Unit) Forecast By Market Taxonomy, 2026 to 2036
- By Country
- China
- Japan
- South Korea
- By Component Type
- By Material
- By Aircraft Type
- By Manufacturing Process
- By Sales Channel
- By Country
- Market Attractiveness Analysis
- By Country
- By Component Type
- By Material
- By Aircraft Type
- By Manufacturing Process
- By Sales Channel
- Key Takeaways
- South Asia and Pacific Market Analysis and Forecast, By Country
- Historical Market Size Value (USD Million) & Volume (Unit) Trend Analysis By Market Taxonomy, 2021 to 2025
- Market Size Value (USD Million) & Volume (Unit) Forecast By Market Taxonomy, 2026 to 2036
- By Country
- India
- ASEAN
- Australia & New Zealand
- Rest of South Asia and Pacific
- By Component Type
- By Material
- By Aircraft Type
- By Manufacturing Process
- By Sales Channel
- By Country
- Market Attractiveness Analysis
- By Country
- By Component Type
- By Material
- By Aircraft Type
- By Manufacturing Process
- By Sales Channel
- Key Takeaways
- Middle East & Africa Market Analysis and Forecast, By Country
- Historical Market Size Value (USD Million) & Volume (Unit) Trend Analysis By Market Taxonomy, 2021 to 2025
- Market Size Value (USD Million) & Volume (Unit) Forecast By Market Taxonomy, 2026 to 2036
- By Country
- Kingdom of Saudi Arabia
- Other GCC Countries
- Türkiye
- South Africa
- Other African Union
- Rest of Middle East & Africa
- By Component Type
- By Material
- By Aircraft Type
- By Manufacturing Process
- By Sales Channel
- By Country
- Market Attractiveness Analysis
- By Country
- By Component Type
- By Material
- By Aircraft Type
- By Manufacturing Process
- By Sales Channel
- Key Takeaways
- Key Countries Market Analysis
- USA
- Pricing Analysis
- Market Share Analysis, 2025
- By Component Type
- By Material
- By Aircraft Type
- By Manufacturing Process
- By Sales Channel
- Canada
- Pricing Analysis
- Market Share Analysis, 2025
- By Component Type
- By Material
- By Aircraft Type
- By Manufacturing Process
- By Sales Channel
- Mexico
- Pricing Analysis
- Market Share Analysis, 2025
- By Component Type
- By Material
- By Aircraft Type
- By Manufacturing Process
- By Sales Channel
- Brazil
- Pricing Analysis
- Market Share Analysis, 2025
- By Component Type
- By Material
- By Aircraft Type
- By Manufacturing Process
- By Sales Channel
- Chile
- Pricing Analysis
- Market Share Analysis, 2025
- By Component Type
- By Material
- By Aircraft Type
- By Manufacturing Process
- By Sales Channel
- Germany
- Pricing Analysis
- Market Share Analysis, 2025
- By Component Type
- By Material
- By Aircraft Type
- By Manufacturing Process
- By Sales Channel
- UK
- Pricing Analysis
- Market Share Analysis, 2025
- By Component Type
- By Material
- By Aircraft Type
- By Manufacturing Process
- By Sales Channel
- Italy
- Pricing Analysis
- Market Share Analysis, 2025
- By Component Type
- By Material
- By Aircraft Type
- By Manufacturing Process
- By Sales Channel
- Spain
- Pricing Analysis
- Market Share Analysis, 2025
- By Component Type
- By Material
- By Aircraft Type
- By Manufacturing Process
- By Sales Channel
- France
- Pricing Analysis
- Market Share Analysis, 2025
- By Component Type
- By Material
- By Aircraft Type
- By Manufacturing Process
- By Sales Channel
- India
- Pricing Analysis
- Market Share Analysis, 2025
- By Component Type
- By Material
- By Aircraft Type
- By Manufacturing Process
- By Sales Channel
- ASEAN
- Pricing Analysis
- Market Share Analysis, 2025
- By Component Type
- By Material
- By Aircraft Type
- By Manufacturing Process
- By Sales Channel
- Australia & New Zealand
- Pricing Analysis
- Market Share Analysis, 2025
- By Component Type
- By Material
- By Aircraft Type
- By Manufacturing Process
- By Sales Channel
- China
- Pricing Analysis
- Market Share Analysis, 2025
- By Component Type
- By Material
- By Aircraft Type
- By Manufacturing Process
- By Sales Channel
- Japan
- Pricing Analysis
- Market Share Analysis, 2025
- By Component Type
- By Material
- By Aircraft Type
- By Manufacturing Process
- By Sales Channel
- South Korea
- Pricing Analysis
- Market Share Analysis, 2025
- By Component Type
- By Material
- By Aircraft Type
- By Manufacturing Process
- By Sales Channel
- Russia
- Pricing Analysis
- Market Share Analysis, 2025
- By Component Type
- By Material
- By Aircraft Type
- By Manufacturing Process
- By Sales Channel
- Poland
- Pricing Analysis
- Market Share Analysis, 2025
- By Component Type
- By Material
- By Aircraft Type
- By Manufacturing Process
- By Sales Channel
- Hungary
- Pricing Analysis
- Market Share Analysis, 2025
- By Component Type
- By Material
- By Aircraft Type
- By Manufacturing Process
- By Sales Channel
- Kingdom of Saudi Arabia
- Pricing Analysis
- Market Share Analysis, 2025
- By Component Type
- By Material
- By Aircraft Type
- By Manufacturing Process
- By Sales Channel
- Türkiye
- Pricing Analysis
- Market Share Analysis, 2025
- By Component Type
- By Material
- By Aircraft Type
- By Manufacturing Process
- By Sales Channel
- South Africa
- Pricing Analysis
- Market Share Analysis, 2025
- By Component Type
- By Material
- By Aircraft Type
- By Manufacturing Process
- By Sales Channel
- USA
- Market Structure Analysis
- Competition Dashboard
- Competition Benchmarking
- Market Share Analysis of Top Players
- By Regional
- By Component Type
- By Material
- By Aircraft Type
- By Manufacturing Process
- By Sales Channel
- Emerging Startups
- Innovation Benchmarking
- Competition Analysis
- Competition Deep Dive
- Victrex
- Overview
- Product Portfolio
- Profitability by Market Segments (Product/Region/Sales Channel)
- Sales Footprint
- Strategy Overview
- Marketing Strategy
- Product Strategy
- Channel Strategy
- Syensqo
- SABIC
- Toray Advanced Composites
- Ensinger
- Röchling
- Saint-Gobain
- Collins Aerospace
- Safran
- and TE Connectivity
- Victrex
- Case Studies
- Success Stories
- Recent Developments
- Competition Deep Dive
- Assumptions & Acronyms Used


