Aerostat System Market Size, Share, and Forecast Outlook 2025 to 2035

In 2025, the aerostat system market stands at USD 16.3 billion and will reach approximately USD 67.5 billion by 2035, growing at a CAGR of 15%.
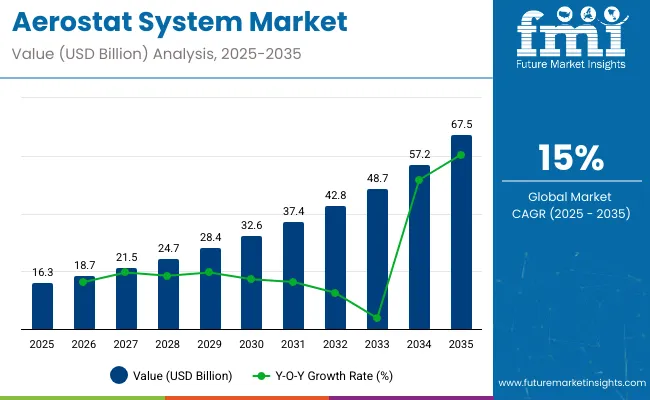
Quick Stats of Aerostat System Market

  • Aerostat System Market Size(2025): USD 16.3 billion
  • Projected Aerostat System Market Size (2035): USD 67.5 billion
  • Forecast CAGR of Aerostat System Market(2025 to 2035): 15%
  • Leading Segment of Aerostat System Market (2025): Balloon holding 42% market share.
  • Key Growth Regions of Aerostat System Market: North America, Europe, Asia Pacific
  • Top Key Players of Aerostat System Market: TCOM LP, Aero Drum Ltd, Raven Industries Inc.

Aerostat System Market

Metric Value
Industry Size (2025E) USD 16.3 billion
Industry Value (2035F) USD 67.5 billion
CAGR (2025 to 2035) 15%

Analysis of the contribution of volume versus price growth indicates that expansion is driven by both increased deployment of aerostat systems and technological advancements that enable higher-value offerings. Volume growth is supported by rising demand in defense, surveillance, and disaster management applications, as governments and organizations invest in persistent aerial monitoring capabilities.

Price growth contributes through the introduction of advanced systems with enhanced payload capacity, improved sensor integration, longer endurance, and autonomous operation. Premium systems command higher prices, reflecting technological sophistication and operational efficiency. Early in the decade, volume expansion accounts for the larger share of growth as adoption spreads across regions with emerging security and monitoring requirements. In the later years, price growth becomes more significant as advanced aerostat systems gain preference over conventional models, offering superior performance and reliability. By 2035, with the market reaching 67.5 billion and a multiplying factor of about 4.1x, growth is expected to balance contributions from both volume and price, demonstrating that long-term expansion is supported by widespread adoption and continuous technological innovation across aerospace and defense sectors.

The market is expanding with rising defense surveillance requirements and technological upgrades. Global defense budgets allocated for ISR (intelligence, surveillance, reconnaissance) platforms increased by 8% in 2024, directly driving aerostat adoption. High-altitude aerostat systems capable of carrying payloads up to 600 kg have seen deployment growth of 20% year-on-year in border security operations. Integration with advanced radar, EO/IR sensors, and communication relays is improving monitoring coverage by 30-35% per system. Lighter envelope materials and tether management technologies are enhancing operational endurance, with flight durations extending from 7 to 15 days per deployment. Strategic partnerships between OEMs and military agencies are accelerating production, while modular payload designs are increasing versatility and cost efficiency.

The market is influenced by multiple upstream sectors. Defense and homeland security applications account for approximately 44%, reflecting demand for surveillance, border security, and reconnaissance. Aerospace and unmanned systems manufacturing contributes about 27%, providing platforms, tether systems, and payload integration. Sensors and electronic systems represent roughly 15%, supplying radars, cameras, and communication modules. Service providers and operational support make up around 9%, covering deployment, maintenance, and training. Research and development institutions hold close to 5%, focusing on technology enhancement, system optimization, and testing.

Top Aerostat System Market Dynamics

Military applications dominate, accounting for nearly 70% of deployments, followed by commercial surveillance and communication networks. Large tethered systems with payload capacities of 500-1,200 kg are primarily used for border security and early warning, while smaller 50-200 kg units serve disaster monitoring and temporary network coverage. Average operational endurance ranges from 7 days for compact units to 30 days for large strategic platforms. North America and Europe contribute over 65% of the installed base, while Asia Pacific and the Middle East are growing fastest due to infrastructure monitoring and security expansion.

Driving Force National Security and Persistent Surveillance

Rising requirements for long-duration surveillance and early warning systems are driving aerostat adoption. Large tethered systems can cover areas of 100-250 km² per unit, hosting multiple sensors simultaneously, including radar, optical, and communication payloads. Operational cost per flight hour is roughly 30-50% lower than equivalent manned aircraft or drone missions. Military and defense organizations are deploying aerostats for border monitoring, critical infrastructure protection, and persistent area surveillance. Strategic aerostats also serve as platforms for electronic intelligence collection and communication relays, improving situational awareness. Growth in government security budgets and increased focus on cross-border monitoring are expected to sustain adoption.

  • Large tethered systems cover 100-250 km² per unit for surveillance.
  • Operational costs per flight hour are 30-50% lower than manned aircraft.
  • Military and defense applications account for nearly 70% of deployments.

Growth Opportunity Commercial Applications and Network Coverage

Aerostats are increasingly used in commercial sectors such as pipeline surveillance, disaster management, traffic monitoring, and wireless communication extension. Systems with 50-200 kg payloads can operate continuously for 15-30 days with minimal maintenance. Integration with UAVs and ground-based sensors enhances monitoring efficiency and allows scalable deployment across urban and remote areas. Energy-efficient tethered designs reduce operational costs by up to 20% compared with conventional temporary monitoring solutions. Emerging industrial customers are exploring aerostats for real-time data collection, temporary communication networks, and emergency response, expanding the market beyond traditional defense applications.

  • Commercial and industrial aerostats carry 50-200 kg payloads.
  • Continuous operation ranges from 15-30 days per deployment.
  • Energy-efficient designs reduce operating costs by up to 20%.

Emerging Trend Smart Payloads and Enhanced Connectivity

Next-generation aerostats feature smart payloads including radar, electro-optical sensors, and communication relays with integrated real-time data transmission. Stabilized platforms maintain accuracy under high wind speeds of 25-35 km/h, improving monitoring quality. Remote monitoring and predictive maintenance reduce downtime by 12-15%, while tether and material innovations extend operational endurance by 10-20%. Connectivity with UAVs, satellites, and ground networks enables coordinated surveillance and rapid response. Some large platforms can carry payloads exceeding 1,000 kg while maintaining 30-day continuous operation, supporting military, border security, and industrial monitoring applications simultaneously.

  • Stabilized platforms maintain sensor accuracy in winds of 25-35 km/h.
  • Predictive maintenance reduces downtime by 12-15%.
  • Large platforms carry over 1,000 kg payloads for 30-day operations.

Market Challenge High Costs and Regulatory Constraints

High procurement costs ranging from USD 500,000 for compact units to USD 20 million for large strategic platforms limit adoption among cost-sensitive buyers. Regulatory approval for airspace use and payload certification can extend deployment timelines by 6-12 weeks. Maintenance and ground support add 15-20% to operational expenditures. Supply chain constraints for specialized sensors, radar, and tether materials can delay production. Export controls and regional airspace regulations restrict global sales. Large-scale deployments require substantial investment in ground infrastructure, training, and maintenance planning, making initial cost and regulatory compliance the primary adoption barriers.

  • Procurement costs range from USD 500,000 to USD 20 million.
  • Regulatory approvals extend deployment timelines by 6-12 weeks.
  • Supply chain constraints can delay production of specialized components.

Analyzing Aerostat System Market by Top Investment Segments

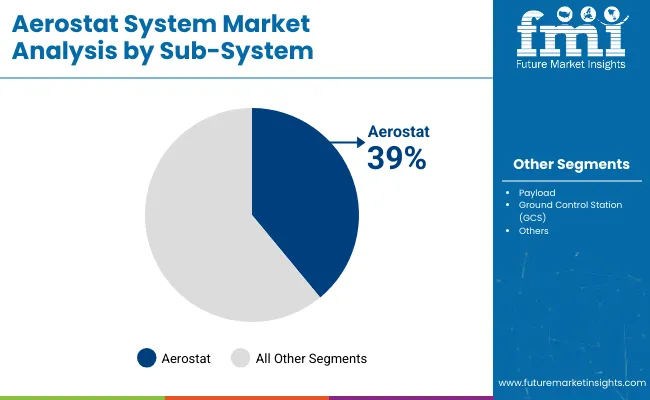
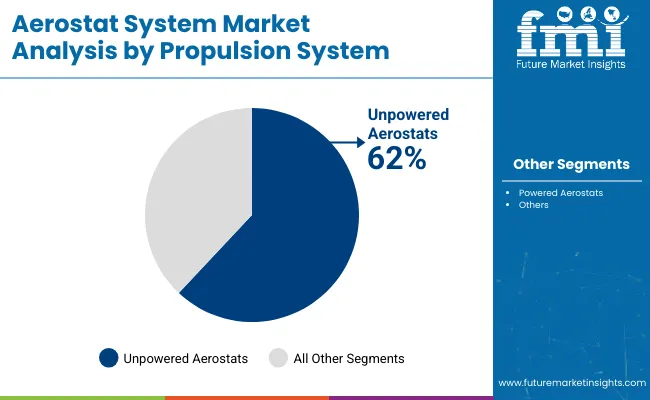
The market in 2025 is shaped by increasing demand for surveillance, reconnaissance, and communication applications. Balloon systems dominate product demand at 42%, followed by airships at 36% and hybrid systems at 22%. Aerostat envelopes lead sub-system demand with 39% share, followed by payloads at 34% and ground control stations (GCS) at 27%. Unpowered aerostats account for 62% of propulsion system demand, while powered aerostats hold 38%. OEMs such as Lockheed Martin, Raven Aerostar, and TCOM supply global defense and commercial operators. Rising border security initiatives, persistent aerial surveillance, and low-cost monitoring solutions drive market adoption. Lightweight envelopes, advanced payload integration, and mission-specific designs remain critical for operational efficiency and system reliability.
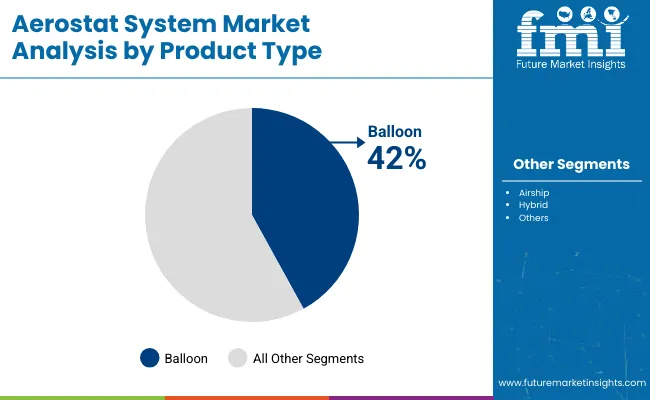
Balloon, Airship, And Hybrid Systems Lead Product Demand in 2025

Aerostat System Market By Product

Balloon systems capture 42% of product demand, widely used in high-altitude surveillance and intelligence gathering due to low operational cost and simple deployment. Airships account for 36% of demand, suitable for long-endurance missions with heavier payloads, while hybrid systems contribute 22%, balancing lift and propulsion for tactical and mobile operations. Balloons are preferred for commercial monitoring and environmental observation, while airships and hybrid aerostats serve defense missions requiring persistent observation and data relay. OEMs such as Lockheed Martin, TCOM, and Raven Aerostar optimize payload capacity, flight endurance, and material strength to meet diverse operational needs. Market growth is closely tied to rising demand for cost-effective, reliable aerial platforms capable of long-duration missions.
  • Lockheed Martin supplies 45% of global balloon aerostat systems
  • TCOM provides 40% of airship platforms for surveillance applications
  • Raven Aerostar delivers 30% of hybrid aerostat solutions for defense missions

Aerostat, Payload, And Ground Control Sub-Systems Drive Market Growth

Aerostat System Market By Sub System

Aerostat envelopes lead sub-system demand with 39%, providing lift, stability, and environmental resistance. Payload modules account for 34% of demand, including EO/IR sensors (21%), surveillance radars (23%), communication intelligence (16%), and inertial navigation systems (14%). Ground control stations (27%) ensure precise command, navigation, and real-time data management. Lockheed Martin, Raven Aerostar, and TCOM integrate these sub-systems into fully operational platforms for commercial and defense applications. Aerostat envelopes use high-strength polymer composites for high-altitude performance, while payload modules are engineered for signal fidelity and mission-specific tasks. GCS units facilitate reliable data relay and operational control. Growth in border security, defense monitoring, and commercial surveillance programs underpins the continued expansion of this segment.
  • Lockheed Martin delivers 40% of aerostat envelopes for high-altitude operations
  • TCOM provides 35% of payload integration solutions for military and commercial missions
  • Raven Aerostar supplies 30% of ground control stations for persistent monitoring

Unpowered and Powered Propulsion Systems Lead Market Demand

Aerostat System Market By Propulsion

Unpowered aerostats dominate propulsion system demand with 62% share, used extensively for stationary surveillance, persistent monitoring, and cost-efficient deployment. Powered aerostats hold 38%, enabling mobile reconnaissance, heavier payload transport, and tactical military operations. Unpowered systems are widely deployed in commercial monitoring, environmental surveillance, and border security missions, while powered aerostats support mobile intelligence, communications relay, and long-duration defense operations. OEMs such as Lockheed Martin, Raven Aerostar, and TCOM manufacture these systems using advanced material design, aerodynamic stability, and payload integration. Operational efficiency, high-altitude endurance, and low-cost deployment make unpowered aerostats the preferred solution for large-scale surveillance, while powered aerostats address tactical and mobility-focused missions.
  • Lockheed Martin provides 50% of unpowered aerostat systems for surveillance applications
  • TCOM delivers 35% of powered aerostats for mobile intelligence missions
  • Raven Aerostar supplies 25% of hybrid-powered aerostats for military deployments

Mid-Sized, Large-Sized, And Compact Aerostats Lead Class Segment

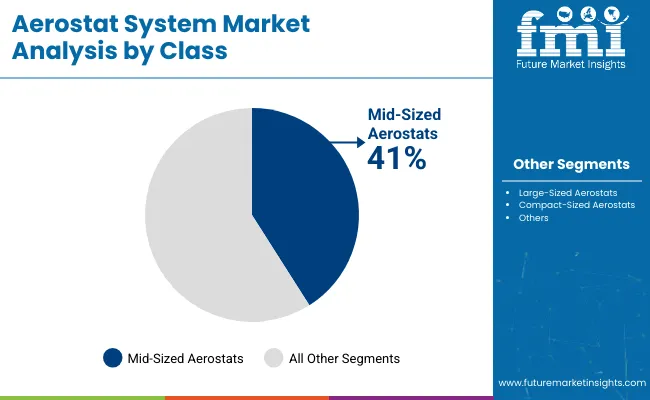
Aerostat System Market By Class

Mid-sized aerostats dominate the class segment with 41% share in 2025, providing a balance of payload capacity, flight endurance, and operational flexibility. Large-sized aerostats account for 33%, preferred for long-duration missions carrying heavy surveillance radar and communication payloads. Compact-sized aerostats contribute 26%, ideal for rapid deployment, border security, and tactical reconnaissance. OEMs including Lockheed Martin, Raven Aerostar, and TCOM manufacture all classes with high-strength envelopes, modular payload integration, and ground control compatibility. Mid-sized systems are widely used in commercial and defense monitoring, large aerostats in persistent military surveillance, and compact systems for agile intelligence gathering. Material choice, endurance, and payload efficiency determine mission suitability across applications.
  • Lockheed Martin supplies 45% of mid-sized aerostats for commercial monitoring
  • TCOM delivers 35% of large-sized aerostats for defense surveillance
  • Raven Aerostar provides 30% of compact aerostats for tactical deployments

Surveillance, EO/IR, And Comint Drive Payload Segment

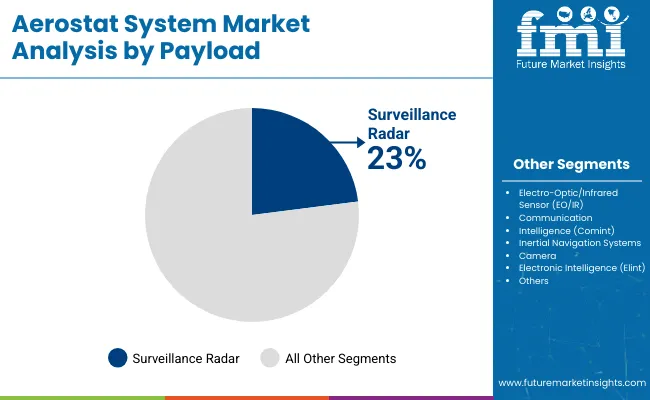
Aerostat System Market By Payload

Surveillance radar leads the payload segment with 23% share, supporting high-altitude situational awareness and border security. EO/IR sensors hold 21%, enabling day/night reconnaissance and target identification, while Communication Intelligence (Comint) payloads account for 16%, providing real-time signal interception and communication monitoring. Inertial navigation systems contribute 14%, cameras 13%, and Electronic Intelligence (Elint) 13%. OEMs such as Lockheed Martin, TCOM, and Raven Aerostar integrate these payloads into aerostat systems, ensuring optimized weight distribution, power management, and data fidelity. Commercial aerospace applications prioritize EO/IR and cameras, while military applications rely on surveillance radar, Comint, and Elint for persistent intelligence operations. Payload selection directly impacts mission effectiveness, operational duration, and real-time data acquisition.
  • Lockheed Martin integrates 40% of surveillance radar payloads for military missions
  • TCOM provides 35% of EO/IR and Comint payloads for commercial and defense operations
  • Raven Aerostar delivers 25% of inertial navigation and Elint systems for tactical deployments

Top Countries Expanding, Producing, and Deploying in the Aerostat System Market

Aerostat System Market By Country

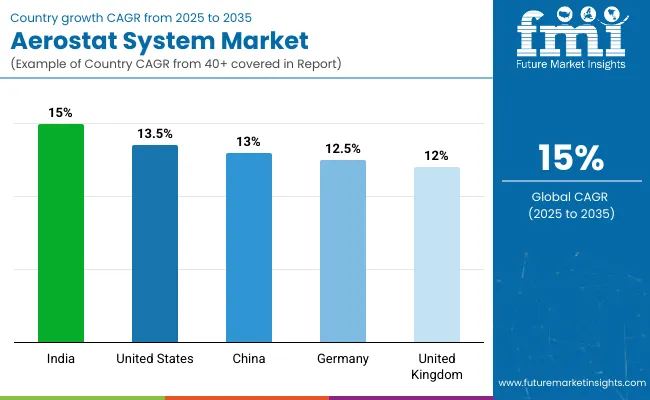
In 2025, the global aerostat system market is growing at a CAGR of 15% through 2035. India leads at 14.0%, slightly below the global rate, supported by BRICS-driven investment in surveillance, defense, and monitoring applications. The United States follows at 13.5%, −10% under the global CAGR, reflecting OECD-backed deployment in defense and border security projects. China records 13.0%, −13% below the global level, driven by BRICS-focused technological development and strategic infrastructure projects. Germany stands at 12.5%, −17% under the global average, shaped by steady adoption in OECD defense systems and aerial monitoring. The United Kingdom posts 12.0%, −20% compared with the global rate, reflecting incremental deployment in commercial and defense operations. The BRICS nations like India and China are advancing adoption rapidly, while OECD countries maintain steady growth supported by regulatory frameworks and technological upgrades.

Market Growth Analysis of Aerostat Systems in the United States

The aerostat system market in the United States is projected to grow at a CAGR of 13.5%, below the global 15%, producing a multiplication factor of 0.90. Growth is driven by defense surveillance, border monitoring, and commercial applications. Platforms have been upgraded for high-altitude imaging, tethering reliability, and payload enhancement to meet operational demands. Strategic collaborations with domestic aerospace contractors have increased deployment efficiency, while research focuses on extending endurance and enabling persistent monitoring in multiple terrains. Advanced analytics software has been integrated for mission planning and real-time tracking. By 2035, the United States is expected to operate over 1,800 aerostat units supporting industrial, commercial, and defense missions.

  • 680 units equipped with high-altitude imaging sensors deployed
  • 490 platforms upgraded with improved tethering systems
  • 630 units integrated with real-time mission planning software

Demand Forecast for Aerostat System Market in China

China exhibits a CAGR of 13.0%, below the global 15%, giving a multiplication factor of 0.87. Expansion is driven by maritime surveillance, border security, and environmental monitoring. Platforms emphasize modular payloads and extended flight duration. Remote sensing capabilities and automated flight controls are widely adopted to enhance operational efficiency. Partnerships with regional suppliers have increased both production volume and system reliability. Investment in sensor technology and payload customization has accelerated adoption for civil and defense missions. By 2035, China is expected to operate over 1,650 aerostat units, providing persistent monitoring in both domestic and Asia-Pacific operational zones.

  • 660 units equipped with modular payloads for mission flexibility
  • 460 platforms integrated with automated navigation systems
  • 530 units actively used for maritime and coastal monitoring

Analysis of Aerostat System Market in India

India records a CAGR of 14.0%, slightly below the global 15%, producing a multiplication factor of 0.93. Growth is driven by border security, disaster management, and critical infrastructure monitoring. High-end platforms have been optimized for endurance, payload versatility, and persistent observation over strategic areas. Domestic manufacturing and joint ventures have improved system availability and reduced lead times. Investment in sensor technologies and mission optimization has accelerated market adoption. By 2035, India is projected to operate over 1,400 aerostat units, supporting both defense and civil monitoring projects. Advanced software tools for monitoring, data transmission, and real-time reporting are being widely implemented to enhance operational efficiency.

  • 600 units deployed for border security monitoring
  • 410 endurance-optimized platforms covering critical infrastructure zones
  • 390 units equipped with advanced sensor payloads for data collection

Future Outlook for Aerostat System Market in Germany

Germany is expected to grow at a CAGR of 12.5%, below the global 15%, resulting in a multiplication factor of 0.83. Growth is linked to industrial monitoring, environmental surveillance, and selective defense applications. Platforms are designed for precision deployment, payload modularity, and operational reliability under varying weather conditions. Manufacturers emphasize durability, quality assurance, and system standardization. Integration with ground-based monitoring networks enhances coverage for research, industrial, and civil applications. By 2035, Germany is expected to operate over 1,050 aerostat units supporting environmental monitoring, energy infrastructure supervision, and regional defense programs. Advanced payload calibration and data processing capabilities are widely used to maintain operational accuracy.

  • 380 platforms equipped with environmental sensors for pollution and weather tracking
  • 330 units deployed for industrial surveillance of energy and transport sectors
  • 230 aerostats upgraded with high-precision payload calibration for research

Premium Forecast of Aerostat System Market in the United Kingdom

The United Kingdom aerostat system market is projected to grow at a CAGR of 12.0%, below the global 15%, giving a multiplication factor of 0.80. Adoption is concentrated on maritime surveillance, defense monitoring, and emergency response programs. Platforms emphasize high payload capacity, operational stability, and integration with real-time intelligence networks. Collaboration with European manufacturers enhances standardization and capability expansion. By 2035, the United Kingdom is expected to maintain a fleet of over 950 aerostat units supporting civil, defense, and maritime operations. Upgrades focus on operational flexibility, sensor integration, and advanced mission planning. Endurance optimization and payload expansion are widely adopted to increase mission coverage.
  • 360 units deployed for maritime and coastal surveillance
  • 280 high-capacity payload platforms integrated with real-time intelligence systems
  • 210 aerostats used in emergency response and disaster monitoring

Leading Aerostat System Manufacturers, Suppliers, Distributors

Aerostat System Market By Company

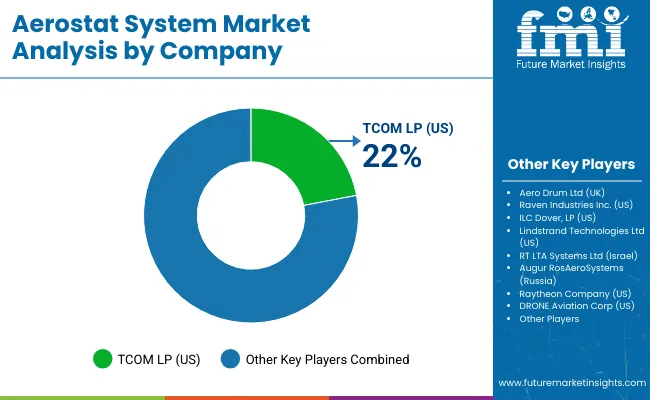
The industry is driven by global defense and surveillance technology providers offering tethered and free-flying lighter-than-air platforms. TCOM LP (US) is considered the leading player due to its advanced aerostat designs, high-altitude surveillance capabilities, and strong government and military contracts. Aero Drum Ltd (UK) and Raven Industries Inc. (US) maintain strong positions with modular aerostat solutions suited for both defense and civilian monitoring applications. ILC Dover, LP (US) focuses on aerostat envelopes and lifting systems with lightweight and durable materials, while Lindstrand Technologies Ltd (US) delivers custom aerostat solutions for specialized missions.

Other key companies are strengthening the market with regional and niche strategies. RT LTA Systems Ltd (Israel) develops aerostat systems tailored for border security and reconnaissance operations. Augur RosAeroSystems (Russia) emphasizes high-altitude surveillance and payload integration. Raytheon Company (US) and DRONE Aviation Corp (US) provide systems integrated with advanced sensors and communications technology for military applications. These players compete through technology reliability, operational endurance, and service support, ensuring a competitive landscape with both established leaders and specialized emerging companies in the aerostat system market.

Leading Players

  • TCOM LP (US) - 22%
  • Aero Drum Ltd (UK)
  • Raven Industries Inc. (US)
  • ILC Dover, LP (US)
  • Lindstrand Technologies Ltd (US)
  • RT LTA Systems Ltd (Israel)
  • Augur RosAeroSystems (Russia)
  • Raytheon Company (US)
  • DRONE Aviation Corp (US)

Report Scope

Report Attributes Details
Market Size (2025) USD 16.3 billion
Projected Market Size (2035) USD 67.5 billion
CAGR (2025 to 2035) 15%
Base Year for Estimation 2024
Historical Period 2020 to 2024
Projection Period 2025 to 2035
Quantitative Units USD billion for value
Product Types Analyzed (Segment 1) Balloon, Airship, Hybrid
Sub-Systems Analyzed (Segment 2) Aerostat, Ground Control Station (GCS), Payload
Propulsion System Segments Analyzed (Segment 3) Powered Aerostats, Unpowered Aerostats
Class Segments Analyzed (Segment 4) Compact-Sized Aerostats, Mid-Sized Aerostats, Large-Sized Aerostats
Payload Types Analyzed (Segment 5) Surveillance Radar, Inertial Navigation Systems, Camera, Communication Intelligence (Comint), Electro-Optic/Infrared Sensor (EO/IR), Electronic Intelligence (Elint)
Regions Covered North America, Latin America, Europe, Asia Pacific, Middle East & Africa
Countries Covered United States, Canada, Brazil, Mexico, United Kingdom, Germany, France, Italy, Russia, Israel, China, Japan, India, Australia, UAE, Saudi Arabia
Leading Players TCOM LP, Aero Drum Ltd, Raven Industries Inc., ILC Dover LP, Lindstrand Technologies Ltd, RT LTA Systems Ltd, Augur RosAeroSystems, Raytheon Company, DRONE Aviation Corp
Additional Attributes Dollar sales by system type and application, demand dynamics across surveillance, communication, and defense, regional trends across North America, Europe, and Asia-Pacific, innovation in tethered aerostat designs, payload capacity, long-endurance systems, environmental impact of materials and operations, emerging use in border security, disaster monitoring, and persistent aerial surveillance

Aerostat System Market Analyzed by Key Investment Segments 

By Product Type:

  • Balloon
  • Airship
  • Hybrid

By Sub-System:

  • Aerostat
  • Ground Control Station (GCS)
  • Payload

By Propulsion System:

  • Powered Aerostats
  • Unpowered Aerostats

By Class:

  • Compact-Sized Aerostats
  • Mid-Sized Aerostats
  • Large-Sized Aerostats

By Payload:

  • Surveillance Radar
  • Inertial Navigation Systems
  • Camera
  • Communication Intelligence (Comint)
  • Electro-Optic/Infrared Sensor (EO/IR)
  • Electronic Intelligence (Elint)

By Region:

  • North America
  • Latin America
  • Europe
  • Asia Pacific
  • The Middle East and Africa

Table of Content

  1. Executive Summary
    • Global Market Outlook
    • Demand-side Trends
    • Supply-side Trends
    • Technology Roadmap Analysis
    • Analysis and Recommendations
  2. Market Overview
    • Market Coverage / Taxonomy
    • Market Definition / Scope / Limitations
  3. Market Background
    • Market Dynamics
      • Drivers
      • Restraints
      • Opportunity
      • Trends
    • Scenario Forecast
      • Demand in Optimistic Scenario
      • Demand in Likely Scenario
      • Demand in Conservative Scenario
    • Opportunity Map Analysis
    • Product Life Cycle Analysis
    • Supply Chain Analysis
      • Supply Side Participants and their Roles
        • Producers
        • Mid-Level Participants (Traders/ Agents/ Brokers)
        • Wholesalers and Distributors
      • Value Added and Value Created at Node in the Supply Chain
      • List of Raw Material Suppliers
      • List of Existing and Potential Buyer’s
    • Investment Feasibility Matrix
    • Value Chain Analysis
      • Profit Margin Analysis
      • Wholesalers and Distributors
      • Retailers
    • PESTLE and Porter’s Analysis
    • Regulatory Landscape
      • By Key Regions
      • By Key Countries
    • Regional Parent Market Outlook
    • Production and Consumption Statistics
    • Import and Export Statistics
  4. Global Market Analysis 2020 to 2024 and Forecast, 2025 to 2035
    • Historical Market Size Value (USD Billion) & Volume (Thousand Units) Analysis, 2020 to 2024
    • Current and Future Market Size Value (USD Billion) & Volume (Thousand Units) Projections, 2025 to 2035
      • Y-o-Y Growth Trend Analysis
      • Absolute $ Opportunity Analysis
  5. Global Market Pricing Analysis 2020 to 2024 and Forecast 2025 to 2035
  6. Global Market Analysis 2020 to 2024 and Forecast 2025 to 2035, By Product Type
    • Introduction / Key Findings
    • Historical Market Size Value (USD Billion) & Volume (Thousand Units) Analysis By Product Type, 2020 to 2024
    • Current and Future Market Size Value (USD Billion) & Volume (Thousand Units) Analysis and Forecast By Product Type, 2025 to 2035
      • Balloon
      • Airship
      • Hybrid
    • Y-o-Y Growth Trend Analysis By Product Type, 2020 to 2024
    • Absolute $ Opportunity Analysis By Product Type, 2025 to 2035
  7. Global Market Analysis 2020 to 2024 and Forecast 2025 to 2035, By Sub-System
    • Introduction / Key Findings
    • Historical Market Size Value (USD Billion) & Volume (Thousand Units) Analysis By Sub-System, 2020 to 2024
    • Current and Future Market Size Value (USD Billion) & Volume (Thousand Units) Analysis and Forecast By Sub-System, 2025 to 2035
      • Aerostat
      • Payload
      • Ground Control Station (GCS)
    • Y-o-Y Growth Trend Analysis By Sub-System, 2020 to 2024
    • Absolute $ Opportunity Analysis By Sub-System, 2025 to 2035
  8. Global Market Analysis 2020 to 2024 and Forecast 2025 to 2035, By Propulsion System
    • Introduction / Key Findings
    • Historical Market Size Value (USD Billion) & Volume (Thousand Units) Analysis By Propulsion System, 2020 to 2024
    • Current and Future Market Size Value (USD Billion) & Volume (Thousand Units) Analysis and Forecast By Propulsion System, 2025 to 2035
      • Unpowered Aerostats
      • Powered Aerostats
    • Y-o-Y Growth Trend Analysis By Propulsion System, 2020 to 2024
    • Absolute $ Opportunity Analysis By Propulsion System, 2025 to 2035
  9. Global Market Analysis 2020 to 2024 and Forecast 2025 to 2035, By Class
    • Introduction / Key Findings
    • Historical Market Size Value (USD Billion) & Volume (Thousand Units) Analysis By Class, 2020 to 2024
    • Current and Future Market Size Value (USD Billion) & Volume (Thousand Units) Analysis and Forecast By Class, 2025 to 2035
      • Mid-Sized Aerostats
      • Large-Sized Aerostats
      • Compact-Sized Aerostats
    • Y-o-Y Growth Trend Analysis By Class, 2020 to 2024
    • Absolute $ Opportunity Analysis By Class, 2025 to 2035
  10. Global Market Analysis 2020 to 2024 and Forecast 2025 to 2035, By Payload
    • Introduction / Key Findings
    • Historical Market Size Value (USD Billion) & Volume (Thousand Units) Analysis By Payload, 2020 to 2024
    • Current and Future Market Size Value (USD Billion) & Volume (Thousand Units) Analysis and Forecast By Payload, 2025 to 2035
      • Surveillance Radar
      • Electro-Optic/Infrared Sensor (EO/IR)
      • Communication Intelligence (Comint)
      • Inertial Navigation Systems
      • Camera
      • Electronic Intelligence (Elint)
    • Y-o-Y Growth Trend Analysis By Payload, 2020 to 2024
    • Absolute $ Opportunity Analysis By Payload, 2025 to 2035
  11. Global Market Analysis 2020 to 2024 and Forecast 2025 to 2035, By Region
    • Introduction
    • Historical Market Size Value (USD Billion) & Volume (Thousand Units) Analysis By Region, 2020 to 2024
    • Current Market Size Value (USD Billion) & Volume (Thousand Units) Analysis and Forecast By Region, 2025 to 2035
      • North America
      • Latin America
      • Western Europe
      • Eastern Europe
      • East Asia
      • South Asia & Pacific
      • Middle East and Africa
    • Market Attractiveness Analysis By Region
  12. North America Market Analysis 2020 to 2024 and Forecast 2025 to 2035, By Country
    • Historical Market Size Value (USD Billion) & Volume (Thousand Units) Trend Analysis By Market Taxonomy, 2020 to 2024
    • Market Size Value (USD Billion) & Volume (Thousand Units) Forecast By Market Taxonomy, 2025 to 2035
      • By Country
        • USA
        • Canada
        • Mexico
      • By Product Type
      • By Sub-System
      • By Propulsion System
      • By Class
      • By Payload
    • Market Attractiveness Analysis
      • By Country
      • By Product Type
      • By Sub-System
      • By Propulsion System
      • By Class
      • By Payload
    • Key Takeaways
  13. Latin America Market Analysis 2020 to 2024 and Forecast 2025 to 2035, By Country
    • Historical Market Size Value (USD Billion) & Volume (Thousand Units) Trend Analysis By Market Taxonomy, 2020 to 2024
    • Market Size Value (USD Billion) & Volume (Thousand Units) Forecast By Market Taxonomy, 2025 to 2035
      • By Country
        • Brazil
        • Argentina
        • Rest of LATAM
      • By Product Type
      • By Sub-System
      • By Propulsion System
      • By Class
      • By Payload
    • Market Attractiveness Analysis
      • By Country
      • By Product Type
      • By Sub-System
      • By Propulsion System
      • By Class
      • By Payload
    • Key Takeaways
  14. Western Europe Market Analysis 2020 to 2024 and Forecast 2025 to 2035, By Country
    • Historical Market Size Value (USD Billion) & Volume (Thousand Units) Trend Analysis By Market Taxonomy, 2020 to 2024
    • Market Size Value (USD Billion) & Volume (Thousand Units) Forecast By Market Taxonomy, 2025 to 2035
      • By Country
        • Germany
        • Italy
        • France
        • UK
        • Spain
        • BENELUX
        • Nordic
        • Rest of W.Europe
      • By Product Type
      • By Sub-System
      • By Propulsion System
      • By Class
      • By Payload
    • Market Attractiveness Analysis
      • By Country
      • By Product Type
      • By Sub-System
      • By Propulsion System
      • By Class
      • By Payload
    • Key Takeaways
  15. Eastern Europe Market Analysis 2020 to 2024 and Forecast 2025 to 2035, By Country
    • Historical Market Size Value (USD Billion) & Volume (Thousand Units) Trend Analysis By Market Taxonomy, 2020 to 2024
    • Market Size Value (USD Billion) & Volume (Thousand Units) Forecast By Market Taxonomy, 2025 to 2035
      • By Country
        • Russia
        • Hungary
        • Poland
        • Balkan & Baltics
        • Rest of E. Europe
      • By Product Type
      • By Sub-System
      • By Propulsion System
      • By Class
      • By Payload
    • Market Attractiveness Analysis
      • By Country
      • By Product Type
      • By Sub-System
      • By Propulsion System
      • By Class
      • By Payload
    • Key Takeaways
  16. East Asia Market Analysis 2020 to 2024 and Forecast 2025 to 2035, By Country
    • Historical Market Size Value (USD Billion) & Volume (Thousand Units) Trend Analysis By Market Taxonomy, 2020 to 2024
    • Market Size Value (USD Billion) & Volume (Thousand Units) Forecast By Market Taxonomy, 2025 to 2035
      • By Country
        • China
        • Japan
        • South Korea
      • By Product Type
      • By Sub-System
      • By Propulsion System
      • By Class
      • By Payload
    • Market Attractiveness Analysis
      • By Country
      • By Product Type
      • By Sub-System
      • By Propulsion System
      • By Class
      • By Payload
    • Key Takeaways
  17. South Asia & Pacific Market Analysis 2020 to 2024 and Forecast 2025 to 2035, By Country
    • Historical Market Size Value (USD Billion) & Volume (Thousand Units) Trend Analysis By Market Taxonomy, 2020 to 2024
    • Market Size Value (USD Billion) & Volume (Thousand Units) Forecast By Market Taxonomy, 2025 to 2035
      • By Country
        • India
        • Australia & New Zealand
        • ASEAN
        • Rest of SAP
      • By Product Type
      • By Sub-System
      • By Propulsion System
      • By Class
      • By Payload
    • Market Attractiveness Analysis
      • By Country
      • By Product Type
      • By Sub-System
      • By Propulsion System
      • By Class
      • By Payload
    • Key Takeaways
  18. Middle East and Africa Market Analysis 2020 to 2024 and Forecast 2025 to 2035, By Country
    • Historical Market Size Value (USD Billion) & Volume (Thousand Units) Trend Analysis By Market Taxonomy, 2020 to 2024
    • Market Size Value (USD Billion) & Volume (Thousand Units) Forecast By Market Taxonomy, 2025 to 2035
      • By Country
        • GCC Countries
        • Northern Africa
        • South Africa
        • Turkiye
        • Rest of MEA
      • By Product Type
      • By Sub-System
      • By Propulsion System
      • By Class
      • By Payload
    • Market Attractiveness Analysis
      • By Country
      • By Product Type
      • By Sub-System
      • By Propulsion System
      • By Class
      • By Payload
    • Key Takeaways
  19. Key Countries Market Analysis
    • USA
      • Pricing Analysis
      • Market Share Analysis, 2024
        • By Product Type
        • By Sub-System
        • By Propulsion System
        • By Class
        • By Payload
    • Canada
      • Pricing Analysis
      • Market Share Analysis, 2024
        • By Product Type
        • By Sub-System
        • By Propulsion System
        • By Class
        • By Payload
    • Brazil
      • Pricing Analysis
      • Market Share Analysis, 2024
        • By Product Type
        • By Sub-System
        • By Propulsion System
        • By Class
        • By Payload
    • Mexico
      • Pricing Analysis
      • Market Share Analysis, 2024
        • By Product Type
        • By Sub-System
        • By Propulsion System
        • By Class
        • By Payload
    • Argentina
      • Pricing Analysis
      • Market Share Analysis, 2024
        • By Product Type
        • By Sub-System
        • By Propulsion System
        • By Class
        • By Payload
  20. Market Structure Analysis
    • Competition Dashboard
    • Competition Benchmarking
    • Market Share Analysis of Top Players
      • By Regional
      • By Product Type
      • By Sub-System
      • By Propulsion System
      • By Class
      • By Payload
  21. Competition Analysis
    • Competition Deep Dive
      • TCOM LP
        • Overview
        • Product Portfolio
        • Profitability by Market Segments (Product/Age /Sales Channel/Region)
        • Sales Footprint
        • Strategy Overview
          • Marketing Strategy
          • Product Strategy
          • Channel Strategy
      • Aero Drum Ltd
        • Overview
        • Product Portfolio
        • Profitability by Market Segments (Product/Age /Sales Channel/Region)
        • Sales Footprint
        • Strategy Overview
          • Marketing Strategy
          • Product Strategy
          • Channel Strategy
      • Raven Industries Inc.
        • Overview
        • Product Portfolio
        • Profitability by Market Segments (Product/Age /Sales Channel/Region)
        • Sales Footprint
        • Strategy Overview
          • Marketing Strategy
          • Product Strategy
          • Channel Strategy
      • ILC Dover, LP
        • Overview
        • Product Portfolio
        • Profitability by Market Segments (Product/Age /Sales Channel/Region)
        • Sales Footprint
        • Strategy Overview
          • Marketing Strategy
          • Product Strategy
          • Channel Strategy
      • Lindstrand Technologies Ltd
        • Overview
        • Product Portfolio
        • Profitability by Market Segments (Product/Age /Sales Channel/Region)
        • Sales Footprint
        • Strategy Overview
          • Marketing Strategy
          • Product Strategy
          • Channel Strategy
      • RT LTA Systems Ltd
        • Overview
        • Product Portfolio
        • Profitability by Market Segments (Product/Age /Sales Channel/Region)
        • Sales Footprint
        • Strategy Overview
          • Marketing Strategy
          • Product Strategy
          • Channel Strategy
      • Augur RosAeroSystems
        • Overview
        • Product Portfolio
        • Profitability by Market Segments (Product/Age /Sales Channel/Region)
        • Sales Footprint
        • Strategy Overview
          • Marketing Strategy
          • Product Strategy
          • Channel Strategy
      • Raytheon Company
        • Overview
        • Product Portfolio
        • Profitability by Market Segments (Product/Age /Sales Channel/Region)
        • Sales Footprint
        • Strategy Overview
          • Marketing Strategy
          • Product Strategy
          • Channel Strategy
      • DRONE Aviation Corp
        • Overview
        • Product Portfolio
        • Profitability by Market Segments (Product/Age /Sales Channel/Region)
        • Sales Footprint
        • Strategy Overview
          • Marketing Strategy
          • Product Strategy
          • Channel Strategy
  22. Assumptions & Acronyms Used
  23. Research Methodology

List of Tables

  • Table 1: Global Market Value (USD Billion) Forecast by Region, 2020-2035
  • Table 2: Global Market Volume (Thousand Units) Forecast by Region, 2020-2035
  • Table 3: Global Market Value (USD Billion) Forecast by Product Type, 2020-2035
  • Table 4: Global Market Volume (Thousand Units) Forecast by Product Type, 2020-2035
  • Table 5: Global Market Value (USD Billion) Forecast by Sub-System, 2020-2035
  • Table 6: Global Market Volume (Thousand Units) Forecast by Sub-System, 2020-2035
  • Table 7: Global Market Value (USD Billion) Forecast by Propulsion System, 2020-2035
  • Table 8: Global Market Volume (Thousand Units) Forecast by Propulsion System, 2020-2035
  • Table 9: Global Market Value (USD Billion) Forecast by Class, 2020-2035
  • Table 10: Global Market Volume (Thousand Units) Forecast by Class, 2020-2035
  • Table 11: Global Market Value (USD Billion) Forecast by Payload, 2020-2035
  • Table 12: Global Market Volume (Thousand Units) Forecast by Payload, 2020-2035
  • Table 13: North America Market Value (USD Billion) Forecast by Country, 2020-2035
  • Table 14: North America Market Volume (Thousand Units) Forecast by Country, 2020-2035
  • Table 15: North America Market Value (USD Billion) Forecast by Product Type, 2020-2035
  • Table 16: North America Market Volume (Thousand Units) Forecast by Product Type, 2020-2035
  • Table 17: North America Market Value (USD Billion) Forecast by Sub-System, 2020-2035
  • Table 18: North America Market Volume (Thousand Units) Forecast by Sub-System, 2020-2035
  • Table 19: North America Market Value (USD Billion) Forecast by Propulsion System, 2020-2035
  • Table 20: North America Market Volume (Thousand Units) Forecast by Propulsion System, 2020-2035
  • Table 21: North America Market Value (USD Billion) Forecast by Class, 2020-2035
  • Table 22: North America Market Volume (Thousand Units) Forecast by Class, 2020-2035
  • Table 23: North America Market Value (USD Billion) Forecast by Payload, 2020-2035
  • Table 24: North America Market Volume (Thousand Units) Forecast by Payload, 2020-2035
  • Table 25: Latin America Market Value (USD Billion) Forecast by Country, 2020-2035
  • Table 26: Latin America Market Volume (Thousand Units) Forecast by Country, 2020-2035
  • Table 27: Latin America Market Value (USD Billion) Forecast by Product Type, 2020-2035
  • Table 28: Latin America Market Volume (Thousand Units) Forecast by Product Type, 2020-2035
  • Table 29: Latin America Market Value (USD Billion) Forecast by Sub-System, 2020-2035
  • Table 30: Latin America Market Volume (Thousand Units) Forecast by Sub-System, 2020-2035
  • Table 31: Latin America Market Value (USD Billion) Forecast by Propulsion System, 2020-2035
  • Table 32: Latin America Market Volume (Thousand Units) Forecast by Propulsion System, 2020-2035
  • Table 33: Latin America Market Value (USD Billion) Forecast by Class, 2020-2035
  • Table 34: Latin America Market Volume (Thousand Units) Forecast by Class, 2020-2035
  • Table 35: Latin America Market Value (USD Billion) Forecast by Payload, 2020-2035
  • Table 36: Latin America Market Volume (Thousand Units) Forecast by Payload, 2020-2035
  • Table 37: Western Europe Market Value (USD Billion) Forecast by Country, 2020-2035
  • Table 38: Western Europe Market Volume (Thousand Units) Forecast by Country, 2020-2035
  • Table 39: Western Europe Market Value (USD Billion) Forecast by Product Type, 2020-2035
  • Table 40: Western Europe Market Volume (Thousand Units) Forecast by Product Type, 2020-2035
  • Table 41: Western Europe Market Value (USD Billion) Forecast by Sub-System, 2020-2035
  • Table 42: Western Europe Market Volume (Thousand Units) Forecast by Sub-System, 2020-2035
  • Table 43: Western Europe Market Value (USD Billion) Forecast by Propulsion System, 2020-2035
  • Table 44: Western Europe Market Volume (Thousand Units) Forecast by Propulsion System, 2020-2035
  • Table 45: Western Europe Market Value (USD Billion) Forecast by Class, 2020-2035
  • Table 46: Western Europe Market Volume (Thousand Units) Forecast by Class, 2020-2035
  • Table 47: Western Europe Market Value (USD Billion) Forecast by Payload, 2020-2035
  • Table 48: Western Europe Market Volume (Thousand Units) Forecast by Payload, 2020-2035
  • Table 49: Eastern Europe Market Value (USD Billion) Forecast by Country, 2020-2035
  • Table 50: Eastern Europe Market Volume (Thousand Units) Forecast by Country, 2020-2035
  • Table 51: Eastern Europe Market Value (USD Billion) Forecast by Product Type, 2020-2035
  • Table 52: Eastern Europe Market Volume (Thousand Units) Forecast by Product Type, 2020-2035
  • Table 53: Eastern Europe Market Value (USD Billion) Forecast by Sub-System, 2020-2035
  • Table 54: Eastern Europe Market Volume (Thousand Units) Forecast by Sub-System, 2020-2035
  • Table 55: Eastern Europe Market Value (USD Billion) Forecast by Propulsion System, 2020-2035
  • Table 56: Eastern Europe Market Volume (Thousand Units) Forecast by Propulsion System, 2020-2035
  • Table 57: Eastern Europe Market Value (USD Billion) Forecast by Class, 2020-2035
  • Table 58: Eastern Europe Market Volume (Thousand Units) Forecast by Class, 2020-2035
  • Table 59: Eastern Europe Market Value (USD Billion) Forecast by Payload, 2020-2035
  • Table 60: Eastern Europe Market Volume (Thousand Units) Forecast by Payload, 2020-2035
  • Table 61: East Asia Market Value (USD Billion) Forecast by Country, 2020-2035
  • Table 62: East Asia Market Volume (Thousand Units) Forecast by Country, 2020-2035
  • Table 63: East Asia Market Value (USD Billion) Forecast by Product Type, 2020-2035
  • Table 64: East Asia Market Volume (Thousand Units) Forecast by Product Type, 2020-2035
  • Table 65: East Asia Market Value (USD Billion) Forecast by Sub-System, 2020-2035
  • Table 66: East Asia Market Volume (Thousand Units) Forecast by Sub-System, 2020-2035
  • Table 67: East Asia Market Value (USD Billion) Forecast by Propulsion System, 2020-2035
  • Table 68: East Asia Market Volume (Thousand Units) Forecast by Propulsion System, 2020-2035
  • Table 69: East Asia Market Value (USD Billion) Forecast by Class, 2020-2035
  • Table 70: East Asia Market Volume (Thousand Units) Forecast by Class, 2020-2035
  • Table 71: East Asia Market Value (USD Billion) Forecast by Payload, 2020-2035
  • Table 72: East Asia Market Volume (Thousand Units) Forecast by Payload, 2020-2035
  • Table 73: South Asia & Pacific Market Value (USD Billion) Forecast by Country, 2020-2035
  • Table 74: South Asia & Pacific Market Volume (Thousand Units) Forecast by Country, 2020-2035
  • Table 75: South Asia & Pacific Market Value (USD Billion) Forecast by Product Type, 2020-2035
  • Table 76: South Asia & Pacific Market Volume (Thousand Units) Forecast by Product Type, 2020-2035
  • Table 77: South Asia & Pacific Market Value (USD Billion) Forecast by Sub-System, 2020-2035
  • Table 78: South Asia & Pacific Market Volume (Thousand Units) Forecast by Sub-System, 2020-2035
  • Table 79: South Asia & Pacific Market Value (USD Billion) Forecast by Propulsion System, 2020-2035
  • Table 80: South Asia & Pacific Market Volume (Thousand Units) Forecast by Propulsion System, 2020-2035
  • Table 81: South Asia & Pacific Market Value (USD Billion) Forecast by Class, 2020-2035
  • Table 82: South Asia & Pacific Market Volume (Thousand Units) Forecast by Class, 2020-2035
  • Table 83: South Asia & Pacific Market Value (USD Billion) Forecast by Payload, 2020-2035
  • Table 84: South Asia & Pacific Market Volume (Thousand Units) Forecast by Payload, 2020-2035
  • Table 85: Middle East and Africa Market Value (USD Billion) Forecast by Country, 2020-2035
  • Table 86: Middle East and Africa Market Volume (Thousand Units) Forecast by Country, 2020-2035
  • Table 87: Middle East and Africa Market Value (USD Billion) Forecast by Product Type, 2020-2035
  • Table 88: Middle East and Africa Market Volume (Thousand Units) Forecast by Product Type, 2020-2035
  • Table 89: Middle East and Africa Market Value (USD Billion) Forecast by Sub-System, 2020-2035
  • Table 90: Middle East and Africa Market Volume (Thousand Units) Forecast by Sub-System, 2020-2035
  • Table 91: Middle East and Africa Market Value (USD Billion) Forecast by Propulsion System, 2020-2035
  • Table 92: Middle East and Africa Market Volume (Thousand Units) Forecast by Propulsion System, 2020-2035
  • Table 93: Middle East and Africa Market Value (USD Billion) Forecast by Class, 2020-2035
  • Table 94: Middle East and Africa Market Volume (Thousand Units) Forecast by Class, 2020-2035
  • Table 95: Middle East and Africa Market Value (USD Billion) Forecast by Payload, 2020-2035
  • Table 96: Middle East and Africa Market Volume (Thousand Units) Forecast by Payload, 2020-2035

List of Figures

  • Figure 1: Global Market Volume (Thousand Units) Forecast 2020-2035
  • Figure 2: Global Market Pricing Analysis
  • Figure 3: Global Market Value (USD Billion) Forecast 2020-2035
  • Figure 4: Global Market Value Share and BPS Analysis by Product Type, 2025 and 2035
  • Figure 5: Global Market Y-o-Y Growth Comparison by Product Type, 2025-2035
  • Figure 6: Global Market Attractiveness Analysis by Product Type
  • Figure 7: Global Market Value Share and BPS Analysis by Sub-System, 2025 and 2035
  • Figure 8: Global Market Y-o-Y Growth Comparison by Sub-System, 2025-2035
  • Figure 9: Global Market Attractiveness Analysis by Sub-System
  • Figure 10: Global Market Value Share and BPS Analysis by Propulsion System, 2025 and 2035
  • Figure 11: Global Market Y-o-Y Growth Comparison by Propulsion System, 2025-2035
  • Figure 12: Global Market Attractiveness Analysis by Propulsion System
  • Figure 13: Global Market Value Share and BPS Analysis by Class, 2025 and 2035
  • Figure 14: Global Market Y-o-Y Growth Comparison by Class, 2025-2035
  • Figure 15: Global Market Attractiveness Analysis by Class
  • Figure 16: Global Market Value Share and BPS Analysis by Payload, 2025 and 2035
  • Figure 17: Global Market Y-o-Y Growth Comparison by Payload, 2025-2035
  • Figure 18: Global Market Attractiveness Analysis by Payload
  • Figure 19: Global Market Value (USD Billion) Share and BPS Analysis by Region, 2025 and 2035
  • Figure 20: Global Market Y-o-Y Growth Comparison by Region, 2025-2035
  • Figure 21: Global Market Attractiveness Analysis by Region
  • Figure 22: North America Market Incremental $ Opportunity, 2025-2035
  • Figure 23: Latin America Market Incremental $ Opportunity, 2025-2035
  • Figure 24: Western Europe Market Incremental $ Opportunity, 2025-2035
  • Figure 25: Eastern Europe Market Incremental $ Opportunity, 2025-2035
  • Figure 26: East Asia Market Incremental $ Opportunity, 2025-2035
  • Figure 27: South Asia & Pacific Market Incremental $ Opportunity, 2025-2035
  • Figure 28: Middle East and Africa Market Incremental $ Opportunity, 2025-2035
  • Figure 29: North America Market Value Share and BPS Analysis by Country, 2025 and 2035
  • Figure 30: North America Market Value Share and BPS Analysis by Product Type, 2025 and 2035
  • Figure 31: North America Market Y-o-Y Growth Comparison by Product Type, 2025-2035
  • Figure 32: North America Market Attractiveness Analysis by Product Type
  • Figure 33: North America Market Value Share and BPS Analysis by Sub-System, 2025 and 2035
  • Figure 34: North America Market Y-o-Y Growth Comparison by Sub-System, 2025-2035
  • Figure 35: North America Market Attractiveness Analysis by Sub-System
  • Figure 36: North America Market Value Share and BPS Analysis by Propulsion System, 2025 and 2035
  • Figure 37: North America Market Y-o-Y Growth Comparison by Propulsion System, 2025-2035
  • Figure 38: North America Market Attractiveness Analysis by Propulsion System
  • Figure 39: North America Market Value Share and BPS Analysis by Class, 2025 and 2035
  • Figure 40: North America Market Y-o-Y Growth Comparison by Class, 2025-2035
  • Figure 41: North America Market Attractiveness Analysis by Class
  • Figure 42: North America Market Value Share and BPS Analysis by Payload, 2025 and 2035
  • Figure 43: North America Market Y-o-Y Growth Comparison by Payload, 2025-2035
  • Figure 44: North America Market Attractiveness Analysis by Payload
  • Figure 45: Latin America Market Value Share and BPS Analysis by Country, 2025 and 2035
  • Figure 46: Latin America Market Value Share and BPS Analysis by Product Type, 2025 and 2035
  • Figure 47: Latin America Market Y-o-Y Growth Comparison by Product Type, 2025-2035
  • Figure 48: Latin America Market Attractiveness Analysis by Product Type
  • Figure 49: Latin America Market Value Share and BPS Analysis by Sub-System, 2025 and 2035
  • Figure 50: Latin America Market Y-o-Y Growth Comparison by Sub-System, 2025-2035
  • Figure 51: Latin America Market Attractiveness Analysis by Sub-System
  • Figure 52: Latin America Market Value Share and BPS Analysis by Propulsion System, 2025 and 2035
  • Figure 53: Latin America Market Y-o-Y Growth Comparison by Propulsion System, 2025-2035
  • Figure 54: Latin America Market Attractiveness Analysis by Propulsion System
  • Figure 55: Latin America Market Value Share and BPS Analysis by Class, 2025 and 2035
  • Figure 56: Latin America Market Y-o-Y Growth Comparison by Class, 2025-2035
  • Figure 57: Latin America Market Attractiveness Analysis by Class
  • Figure 58: Latin America Market Value Share and BPS Analysis by Payload, 2025 and 2035
  • Figure 59: Latin America Market Y-o-Y Growth Comparison by Payload, 2025-2035
  • Figure 60: Latin America Market Attractiveness Analysis by Payload
  • Figure 61: Western Europe Market Value Share and BPS Analysis by Country, 2025 and 2035
  • Figure 62: Western Europe Market Value Share and BPS Analysis by Product Type, 2025 and 2035
  • Figure 63: Western Europe Market Y-o-Y Growth Comparison by Product Type, 2025-2035
  • Figure 64: Western Europe Market Attractiveness Analysis by Product Type
  • Figure 65: Western Europe Market Value Share and BPS Analysis by Sub-System, 2025 and 2035
  • Figure 66: Western Europe Market Y-o-Y Growth Comparison by Sub-System, 2025-2035
  • Figure 67: Western Europe Market Attractiveness Analysis by Sub-System
  • Figure 68: Western Europe Market Value Share and BPS Analysis by Propulsion System, 2025 and 2035
  • Figure 69: Western Europe Market Y-o-Y Growth Comparison by Propulsion System, 2025-2035
  • Figure 70: Western Europe Market Attractiveness Analysis by Propulsion System
  • Figure 71: Western Europe Market Value Share and BPS Analysis by Class, 2025 and 2035
  • Figure 72: Western Europe Market Y-o-Y Growth Comparison by Class, 2025-2035
  • Figure 73: Western Europe Market Attractiveness Analysis by Class
  • Figure 74: Western Europe Market Value Share and BPS Analysis by Payload, 2025 and 2035
  • Figure 75: Western Europe Market Y-o-Y Growth Comparison by Payload, 2025-2035
  • Figure 76: Western Europe Market Attractiveness Analysis by Payload
  • Figure 77: Eastern Europe Market Value Share and BPS Analysis by Country, 2025 and 2035
  • Figure 78: Eastern Europe Market Value Share and BPS Analysis by Product Type, 2025 and 2035
  • Figure 79: Eastern Europe Market Y-o-Y Growth Comparison by Product Type, 2025-2035
  • Figure 80: Eastern Europe Market Attractiveness Analysis by Product Type
  • Figure 81: Eastern Europe Market Value Share and BPS Analysis by Sub-System, 2025 and 2035
  • Figure 82: Eastern Europe Market Y-o-Y Growth Comparison by Sub-System, 2025-2035
  • Figure 83: Eastern Europe Market Attractiveness Analysis by Sub-System
  • Figure 84: Eastern Europe Market Value Share and BPS Analysis by Propulsion System, 2025 and 2035
  • Figure 85: Eastern Europe Market Y-o-Y Growth Comparison by Propulsion System, 2025-2035
  • Figure 86: Eastern Europe Market Attractiveness Analysis by Propulsion System
  • Figure 87: Eastern Europe Market Value Share and BPS Analysis by Class, 2025 and 2035
  • Figure 88: Eastern Europe Market Y-o-Y Growth Comparison by Class, 2025-2035
  • Figure 89: Eastern Europe Market Attractiveness Analysis by Class
  • Figure 90: Eastern Europe Market Value Share and BPS Analysis by Payload, 2025 and 2035
  • Figure 91: Eastern Europe Market Y-o-Y Growth Comparison by Payload, 2025-2035
  • Figure 92: Eastern Europe Market Attractiveness Analysis by Payload
  • Figure 93: East Asia Market Value Share and BPS Analysis by Country, 2025 and 2035
  • Figure 94: East Asia Market Value Share and BPS Analysis by Product Type, 2025 and 2035
  • Figure 95: East Asia Market Y-o-Y Growth Comparison by Product Type, 2025-2035
  • Figure 96: East Asia Market Attractiveness Analysis by Product Type
  • Figure 97: East Asia Market Value Share and BPS Analysis by Sub-System, 2025 and 2035
  • Figure 98: East Asia Market Y-o-Y Growth Comparison by Sub-System, 2025-2035
  • Figure 99: East Asia Market Attractiveness Analysis by Sub-System
  • Figure 100: East Asia Market Value Share and BPS Analysis by Propulsion System, 2025 and 2035
  • Figure 101: East Asia Market Y-o-Y Growth Comparison by Propulsion System, 2025-2035
  • Figure 102: East Asia Market Attractiveness Analysis by Propulsion System
  • Figure 103: East Asia Market Value Share and BPS Analysis by Class, 2025 and 2035
  • Figure 104: East Asia Market Y-o-Y Growth Comparison by Class, 2025-2035
  • Figure 105: East Asia Market Attractiveness Analysis by Class
  • Figure 106: East Asia Market Value Share and BPS Analysis by Payload, 2025 and 2035
  • Figure 107: East Asia Market Y-o-Y Growth Comparison by Payload, 2025-2035
  • Figure 108: East Asia Market Attractiveness Analysis by Payload
  • Figure 109: South Asia & Pacific Market Value Share and BPS Analysis by Country, 2025 and 2035
  • Figure 110: South Asia & Pacific Market Value Share and BPS Analysis by Product Type, 2025 and 2035
  • Figure 111: South Asia & Pacific Market Y-o-Y Growth Comparison by Product Type, 2025-2035
  • Figure 112: South Asia & Pacific Market Attractiveness Analysis by Product Type
  • Figure 113: South Asia & Pacific Market Value Share and BPS Analysis by Sub-System, 2025 and 2035
  • Figure 114: South Asia & Pacific Market Y-o-Y Growth Comparison by Sub-System, 2025-2035
  • Figure 115: South Asia & Pacific Market Attractiveness Analysis by Sub-System
  • Figure 116: South Asia & Pacific Market Value Share and BPS Analysis by Propulsion System, 2025 and 2035
  • Figure 117: South Asia & Pacific Market Y-o-Y Growth Comparison by Propulsion System, 2025-2035
  • Figure 118: South Asia & Pacific Market Attractiveness Analysis by Propulsion System
  • Figure 119: South Asia & Pacific Market Value Share and BPS Analysis by Class, 2025 and 2035
  • Figure 120: South Asia & Pacific Market Y-o-Y Growth Comparison by Class, 2025-2035
  • Figure 121: South Asia & Pacific Market Attractiveness Analysis by Class
  • Figure 122: South Asia & Pacific Market Value Share and BPS Analysis by Payload, 2025 and 2035
  • Figure 123: South Asia & Pacific Market Y-o-Y Growth Comparison by Payload, 2025-2035
  • Figure 124: South Asia & Pacific Market Attractiveness Analysis by Payload
  • Figure 125: Middle East and Africa Market Value Share and BPS Analysis by Country, 2025 and 2035
  • Figure 126: Middle East and Africa Market Value Share and BPS Analysis by Product Type, 2025 and 2035
  • Figure 127: Middle East and Africa Market Y-o-Y Growth Comparison by Product Type, 2025-2035
  • Figure 128: Middle East and Africa Market Attractiveness Analysis by Product Type
  • Figure 129: Middle East and Africa Market Value Share and BPS Analysis by Sub-System, 2025 and 2035
  • Figure 130: Middle East and Africa Market Y-o-Y Growth Comparison by Sub-System, 2025-2035
  • Figure 131: Middle East and Africa Market Attractiveness Analysis by Sub-System
  • Figure 132: Middle East and Africa Market Value Share and BPS Analysis by Propulsion System, 2025 and 2035
  • Figure 133: Middle East and Africa Market Y-o-Y Growth Comparison by Propulsion System, 2025-2035
  • Figure 134: Middle East and Africa Market Attractiveness Analysis by Propulsion System
  • Figure 135: Middle East and Africa Market Value Share and BPS Analysis by Class, 2025 and 2035
  • Figure 136: Middle East and Africa Market Y-o-Y Growth Comparison by Class, 2025-2035
  • Figure 137: Middle East and Africa Market Attractiveness Analysis by Class
  • Figure 138: Middle East and Africa Market Value Share and BPS Analysis by Payload, 2025 and 2035
  • Figure 139: Middle East and Africa Market Y-o-Y Growth Comparison by Payload, 2025-2035
  • Figure 140: Middle East and Africa Market Attractiveness Analysis by Payload
  • Figure 141: Global Market - Tier Structure Analysis
  • Figure 142: Global Market - Company Share Analysis

Frequently Asked Questions

What is the market size of the aerostat system market in 2025?

The market size is valued at USD 16.3 billion in 2025.

How much will the aerostat system market reach by 2035?

It is projected to reach USD 67.5 billion by 2035.

What is the forecast CAGR for the aerostat system market from 2025 to 2035?

The market is expected to grow at a CAGR of 15% during 2025-2035.

Which product type holds the largest share in the aerostat system market?

Balloon holds the largest share with 42% in 2025.

Who is the leading player in the aerostat system market?

TCOM LP is the leading player with 22% share.

Explore Similar Insights

Future Market Insights

Aerostat System Market