

- Market Size (2026)
- USD 260.3 Mn
- Forecast (2036)
- USD 739.1 Mn
- CAGR (2026 to 2036)
- 11.0%
How big is AI Data Center Power Spare Parts Optimization Platforms Market in 2026?
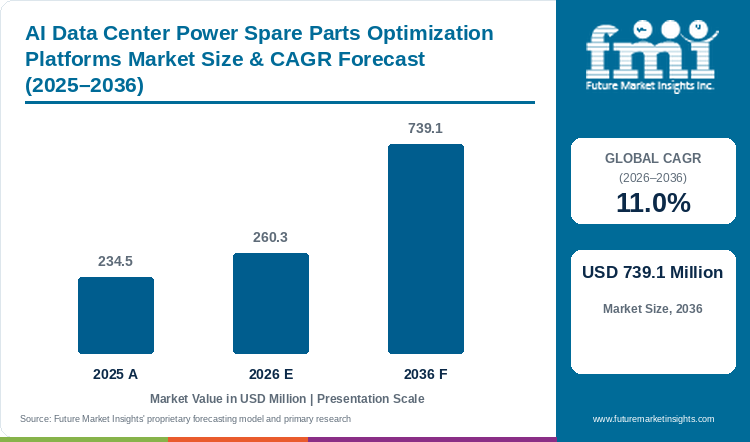
The market was valued at USD 234.5 Million in 2025 and is expected to reach USD 260.3 Million in 2026, with growth at an 11.0% CAGR from 2026 to 2036 taking its value to USD 739.1 Million by 2036.
A spare physically in stock may still be unusable for a repair because its revision is wrong, approval is missing or transport cannot meet the response window. Optimization connects those details with equipment criticality, giving the buyer a basis for relocating or reducing stock only after the installed base and replacement options are understood. Condition data can inform the decision but needs to be considered with lead time and the consequences of a delayed return to service. New campuses can establish common identifiers during procurement, while existing fleets may first need to reconcile equipment generations and service agreements. Saudi Arabian programs illustrate the first setting, with Germany and the USA also facing installed-base requirements. The forecast measures qualifying software and paid optimization services, excluding physical spares, general warehouse tools and maintenance lacking the specified planning function. [5]
Key Market Trends & Insights
- Asset health / predictive maintenance holds 26.0% of software function in 2026, linking condition evidence to a defined maintenance or stocking action for the installed asset.
- Medium-voltage distribution holds 31.0% of electrical layer in 2026, covering upstream equipment whose failure may affect several downstream electrical loads.
- The 51–150 MW band accounts for 31.0% of power capacity in 2026, requiring plans based on the revisions installed in each phase of the campus.
- Hyperscale AI accounts for 44.0% of facility type in 2026, making the recovery requirements of individual halls relevant before stock is pooled across sites.
Regional Highlights
- Saudi Arabia has the highest profiled CAGR at 12.4% during 2026–2036.
- The next two profiled growth rates are France at 12.1% and South Korea at 11.8% over the same period.
Market Size & Forecast
| Metric | Value |
|---|---|
| 2025 market value | USD 234.5 Million |
| 2026 market estimate | USD 260.3 Million |
| 2036 market forecast | USD 739.1 Million |
| Forecast CAGR, 2026–2036 | 11.0% |
The market covers AI data-center power spare-parts optimization software and directly associated paid optimization services. Physical spare parts, general warehouse software and maintenance activities without the specified planning or optimization function are excluded.
Spare-parts optimization in data-center power requires a view of equipment criticality, compatibility and the consequence of delayed restoration.
Infrastructure readiness and acceptance
| Documented operating context | Source |
|---|---|
| Siemens expanded Industrial Copilot with a generative-AI maintenance offering in March 2025. | [1] |
| Hitachi announced HMAX Energy in March 2026 for critical energy infrastructure service and support. | [2] |
| NIST SP 800-82 Revision 3 provides guidance for operational-technology security. | [3] |
| ETAP and Schneider Electric announced a grid-to-chip AI-factory power digital twin in March 2025. | [4] |
Analyst Perspective
A stocking recommendation needs to preserve a realistic replacement path, connecting installed revisions with approved alternatives, service ownership and delivery time. Engineering and procurement teams can then assess local holdings or pooled stock against the same recovery requirement, with inventory reduction judged alongside the ability to complete the repair.
- Sudip Saha, Principal Analyst at Future Market Insights
How is the AI data center power spare parts optimization platforms market segmented?
Software Function covers Asset health / predictive maintenance, Capacity & load planning, Dynamic load management, Energy / cost optimization and Compliance & reporting. Electrical Layer covers Medium-voltage distribution, Low-voltage distribution, Rack / row-level and Substation / grid interface. Power Capacity covers 51–150 MW, 10–50 MW, Below 10 MW and Above 150 MW. Facility Type covers Hyperscale AI, Colocation, Enterprise / private cloud and HPC / research. Route to Market covers OEM direct, Electrical EPC / contractor, System integrator and Distributor / service partner.
The installed-base records in data-center infrastructure management provide a foundation for identifying which spare can actually serve the equipment at risk.
Why does Asset health / predictive maintenance lead software function demand?
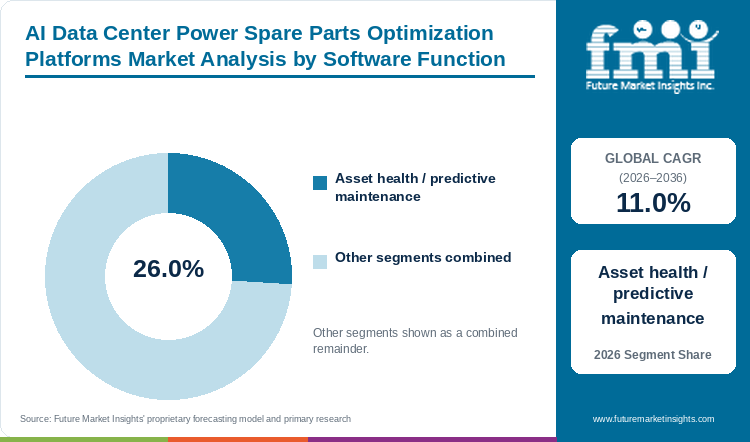
Asset health / predictive maintenance: 26.0% of software function in 2026.
Asset-health information can identify equipment likely to need attention, after which the stocking decision depends on the approved replacement and time available to obtain it. A deteriorating component serving several loads may justify a local spare, while another can be ordered for a scheduled shutdown. Connecting condition with that consequence makes logs and service history useful to inventory policy, provided the maintenance team has permission and a correctly identified part with which to act.
- The Asset health / predictive maintenance segment accounts for 26.0% of software function in 2026.
- A condition alert should lead to an approved maintenance or purchasing action rather than automatically trigger stocking of an unidentified replacement.
Why does Medium-voltage distribution lead electrical layer demand?
Medium-voltage distribution: 31.0% of electrical layer in 2026.
Medium-voltage equipment can affect several downstream loads, making ratings, revision and configuration part of a replacement decision rather than relying on a generic part description. Engineering approval may be necessary before a substitute is used, while rack-level and utility-interface assets have different repair consequences. Accurate identity and an approved replacement path allow those priorities to be compared without treating every electrical component as equally urgent.
- The Medium-voltage distribution segment accounts for 31.0% of electrical layer in 2026.
- Medium-voltage part records should retain the equipment revision and approved substitution conditions needed for an engineering review.
What are the drivers, restraints, and opportunities in the AI data center power spare parts optimization platforms market?
Electrical uptime depends on available compatible spares
The cost of an unavailable electrical component can extend beyond the part itself when it prevents valuable compute capacity from returning to service. Reliability teams need to compare that exposure with the cost of holding a suitable spare. Optimization makes the trade-off useful at the level of the installed asset. It can also show where procurement lead time is inconsistent with the recovery plan. Suppliers should connect alerts with a replacement consequence rather than simply increase the number of warnings. That gives maintenance managers a practical reason to change stock or service arrangements.
Poor asset records undermine inventory decisions
Incomplete bills of materials and undocumented substitutions can leave a recommended spare inconsistent with the installed equipment, making verification of an equipment family useful before expansion. Authoritative configuration data and approval history need to remain accessible under appropriate security controls for UPS and switchgear records. Settling ownership and replacement authority first gives buyers a sound basis for pooling or reducing parts without assuming untested interchangeability.
Condition and criticality can guide stock allocation
Shared stock can reduce duplication where condition and compatibility records are trustworthy. Hitachi Energy's RelCare documentation describes risk-based assessment of substation spare inventories as an example of linking maintenance with stock decisions. Data-center operators can apply the same type of comparison to local holdings and regional depots. Transport and service access still determine whether a pooled part is a realistic substitute for local stock. Vendors can connect procurement permissions with the recommendation so that it can be acted upon. The useful result is lower recovery risk or fewer expedited orders without weakening the required redundancy.
Records from AI infrastructure commissioning can establish equipment revisions and baseline configuration before spare-parts policies are applied across a site.
Which country and market CAGRs are profiled for AI data center power spare parts optimization platforms?
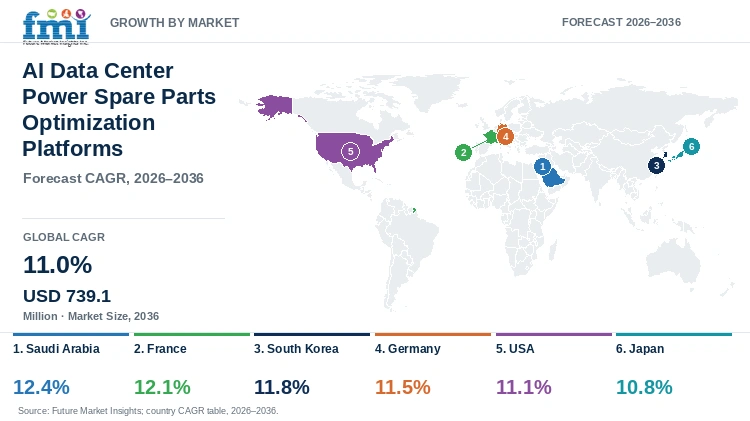
| Country | CAGR |
|---|---|
| Saudi Arabia | 12.4% |
| France | 12.1% |
| South Korea | 11.8% |
| Germany | 11.5% |
| USA | 11.1% |
| Japan | 10.8% |
Country-wise Analysis
Saudi Arabia
- New Saudi Arabian power-campus programs can establish consistent parts registers alongside switchgear procurement, then link them with qualified local stock and response coverage. The fastest profiled forecast is a 12.4% CAGR from 2026 to 2036. Distinguishing inventory that exists from a compatible part accessible in time gives operators a practical recovery view before service arrangements are finalized.
France
- Phased French commissioning lets developers confirm equipment identity and emergency-spares needs as electrical blocks are accepted. France’s 12.1% CAGR forecast for 2026 to 2036 accompanies recommendations that must follow the exact installed revision and its energization schedule. Linking these changes with approved replacements preserves a recovery plan when buyers consider holding fewer parts.
South Korea
- A South Korean campus may contain commissioned power trains beside equipment still being installed, requiring the inventory policy to distinguish those states. Within the market’s 11.8% CAGR forecast for 2026 to 2036, common naming established by OEMs and integrators helps later condition data refer to the correct assets. Consequence and replenishment can then set priorities instead of assigning urgency to everything in the project register.
Germany
- Several equipment generations in German facilities can carry different service responsibilities and configuration approvals, even where a replacement appears physically compatible. The 11.5% CAGR forecast for 2026 to 2036 includes renewal programs where those dependencies need to remain visible as assets change gradually. Buyers need to know whether a located part can restore the required function within the repair window.
USA
- American multi-campus operators may need to normalize UPS service records and distributor inventory before pooled stock becomes a dependable option. The USA’s 11.1% CAGR forecast for 2026 to 2036 accompanies decisions in which transport time, security and plant approval remain binding. A recommendation therefore needs to demonstrate that the retained part can reach the site and has an authorized substitution path.
Japan
- Japanese maintenance teams need a chain from the OEM identifier and installed revision to the contractor able to release and fit a replacement. Japan is forecast to grow at a 10.8% CAGR from 2026 to 2036, with escalation records relevant when stock belongs to another party. Reliable access and replenishment information let the plan reflect what the team can actually use during a repair.
Who are the notable companies in the AI data center power spare parts optimization platforms market?
Siemens; Hitachi Energy; Schneider Electric; Eaton; ABB
Engineering teams need confidence in compatibility while procurement teams need reliable availability and lead-time information. A spare-parts platform must connect those views. Equipment manufacturers can contribute replacement knowledge and software can organize the wider stock decision. Neither is sufficient when the recommended action cannot pass through the site's approval and service process.
Competitive Benchmarking: AI Data Center Power Spare Parts Optimization Platforms Market
| Participant | Commercial focus | Buyer qualification priority |
|---|---|---|
| Siemens | Electrical asset and maintenance software | Installed-base records and maintenance context |
| Hitachi Energy | Energy infrastructure service platforms | Asset condition and service planning |
| Schneider Electric | Electrical asset and lifecycle management | Parts compatibility and replacement governance |
| Eaton | Power equipment and services | Serviceable inventory and support coverage |
| ABB | Electrical equipment and digital services | Asset identification and obsolescence planning |
Key Developments in the AI Data Center Power Spare Parts Optimization Platforms Market
- Siemens expanded Industrial Copilot with a generative-AI maintenance offering in March 2025. [1]
- Hitachi announced HMAX Energy in March 2026 for critical energy infrastructure service and support. [2]
Key Players in the AI Data Center Power Spare Parts Optimization Platforms Market
- Siemens
- Hitachi Energy
- Schneider Electric
- Eaton
- ABB
AI Data Center Power Spare Parts Optimization Platforms Market - Report Scope
| Coverage field | Report scope |
|---|---|
| Market breakdown | Software Function; Electrical Layer; Power Capacity; Facility Type; Route to Market; Region |
| Quantitative unit | USD Million |
| Market definition | The market covers AI data-center power spare-parts optimization software and directly associated paid optimization services. Physical spare parts, general warehouse software and maintenance activities without the specified planning or optimization function are excluded. |
| Regions covered | North America; Latin America; Western Europe; Eastern Europe; East Asia; South Asia and Pacific; Middle East and Africa |
| Countries / markets profiled | Saudi Arabia; France; South Korea; Germany; USA; Japan |
| Key companies profiled | Siemens; Hitachi Energy; Schneider Electric; Eaton; ABB |
| Base year / forecast period | 2026 / 2026–2036 |
| Estimate coverage | 2025 and 2026 market estimates; 2036 forecast; segment shares and country / market CAGRs. |
AI Data Center Power Spare Parts Optimization Platforms Market - Research Methodology
| Method | Application |
|---|---|
| Market definition | The analysis follows the stated product or service boundary and distinguishes direct category revenue from adjacent activities. |
| Secondary research | Official technical, regulatory, research and company publications provide the documented operating context and recent developments cited in this report. |
| Forecast and segmentation | Market estimates, segment shares and geographic forecasts are presented as analytical estimates within the stated commercial scope. |
| Competitive assessment | Participants are compared by their relevant products or services, commercial role and buyer qualification requirements. |
| Interpretation | The assessment considers purchasing conditions and the scope of the documented product, service or performance claim. |
AI Data Center Power Spare Parts Optimization Platforms Market by Segments
Software Function
- Asset health / predictive maintenance
- Capacity & load planning
- Dynamic load management
- Energy / cost optimization
- Compliance & reporting
Electrical Layer
- Medium-voltage distribution
- Low-voltage distribution
- Rack / row-level
- Substation / grid interface
Power Capacity
- 51-150 MW
- 10-50 MW
- Below 10 MW
- Above 150 MW
Facility Type
- Hyperscale AI
- Colocation
- Enterprise / private cloud
- HPC / research
Route to Market
- OEM direct
- Electrical EPC / contractor
- System integrator
- Distributor / service partner
AI Data Center Power Spare Parts Optimization Platforms Market by Region
- North America
- United States
- Canada
- Latin America
- Brazil
- Mexico
- Argentina
- Chile
- Western Europe
- Germany
- France
- United Kingdom
- Italy
- Spain
- Benelux
- Nordics
- Eastern Europe
- Poland
- Czech Republic
- Romania
- Hungary
- East Asia
- China
- Japan
- South Korea
- South Asia and Pacific
- India
- ASEAN
- Australia and New Zealand
- Middle East and Africa
- GCC Countries
- South Africa
- Türkiye
- Israel
Research Sources and Bibliography
- [1] Siemens. (2025, March 24). Siemens expands Industrial Copilot with new generative AI-powered maintenance offering.
- [2] Hitachi Energy. (2026, March 23). Hitachi launches HMAX Energy, a pioneering AI-powered service and solution suite for critical energy infrastructure.
- [3] National Institute of Standards and Technology. (2023, September 28). Guide to Operational Technology (OT) Security (SP 800-82 Rev. 3).
- [4] Schneider Electric. (2025, March 18). ETAP and Schneider Electric Unveil World’s First Digital Twin to Simulate AI Factory Power Requirements from Grid to Chip Level Using NVIDIA Omniverse.
- [5] Future Market Insights. (2026). AI Data Center Power Spare Parts Optimization Platforms Market: Global industry analysis and opportunity assessment, 2026–2036.
This Report Answers
- How large is the AI data center power spare parts optimization platforms market in 2026?
- What value and CAGR are forecast through 2036?
- Which software function segment leads in 2026?
- Which electrical layer segment has the largest share?
- Which profiled country or market has the fastest forecast growth?
- Which participants are covered in the competitive assessment?
Frequently Asked Questions
How large is the AI data center power spare parts optimization platforms market in 2026?
The market was valued at USD 234.5 Million in 2025 and is expected to reach USD 260.3 Million in 2026.
What value and CAGR are forecast through 2036?
The market is projected to reach USD 739.1 Million by 2036, with an 11.0% CAGR during 2026–2036.
Which software function segment leads in 2026?
The Asset health / predictive maintenance segment accounts for 26.0% of software function in 2026.
Which electrical layer segment has the largest share?
The Medium-voltage distribution segment accounts for 31.0% of electrical layer in 2026.
Which profiled country or market has the fastest forecast growth?
Saudi Arabia has the highest profiled CAGR at 12.4% during 2026–2036.
Which participants are covered in the competitive assessment?
The assessment covers Siemens, Hitachi Energy, Schneider Electric, Eaton and ABB.
Preview the report firsthand - request a free sample
Get SampleGet the brochure for pricing and purchase details.
Get PDFTable of Content
- Key Takeaways
- Market Size and CAGR
- Top Growth Driver
- Fastest Growing Segment
- Leading Region
- Key Companies
- Emerging Opportunities
- Executive Summary
- Global Market Outlook
- Demand-side Trends
- Supply-side Trends
- Technology Roadmap Analysis
- Analysis and Recommendations
- Analyst Perspective (What is happening? Why now? What should investors know?)
- Key Questions Answered
- How large is the market?
- What is the CAGR?
- What are key trends?
- Which region dominates?
- Who are the leaders?
- Market Overview
- Market Coverage / Taxonomy
- Market Definition / Scope / Limitations
- Research Methodology
- Chapter Orientation
- Analytical Lens and Working Hypotheses
- Market Structure, Signals, and Trend Drivers
- Benchmarking and Cross-market Comparability
- Market Sizing, Forecasting, and Opportunity Mapping
- Research Design and Evidence Framework
- Desk Research Programme (Secondary Evidence)
- Expert Input and Fieldwork (Primary Evidence)
- Tooling, Models, and Reference Databases
- Data Engineering and Model Build
- Quality Assurance and Audit Trail
- Market Background
- Market Dynamics (Drivers, Restraints, Opportunity, Trends)
- Scenario Forecast (Optimistic, Likely, Conservative)
- Impact Analysis
- AI Impact
- Sustainability Impact
- Regulatory Impact
- Technology Impact
- Consumer / Buyer Analysis
- Purchase Drivers
- Adoption Barriers
- Buyer Journey
- Opportunity Map Analysis
- Product Life Cycle Analysis
- Supply Chain Analysis
- Investment Feasibility Matrix
- Value Chain Analysis
- PESTLE and Porter's Analysis
- Regulatory Landscape
- Regional Parent Market Outlook
- Production and Consumption Statistics
- Import and Export Statistics
- Global Market Analysis and Forecast, 2021 to 2036
- Historical Market Size Value (USD Million) Analysis, 2021 to 2025
- Current and Future Market Size Value (USD Million) Projections, 2026 to 2036
- Y-o-Y Growth Trend Analysis
- Absolute $ Opportunity Analysis
- Global Market Pricing Analysis, 2021 to 2036
- Global Market Analysis and Forecast, By Software Function, 2021 to 2036
- Introduction / Key Findings
- Historical Market Size Value (USD Million) Analysis By Software Function, 2021 to 2025
- Current and Future Market Size Value (USD Million) Analysis and Forecast By Software Function, 2026 to 2036
- Asset health / predictive maintenance
- Capacity & load planning
- Dynamic load management
- Energy / cost optimization
- Compliance & reporting
- Y-o-Y Growth Trend Analysis By Software Function, 2021 to 2025
- Absolute $ Opportunity Analysis By Software Function, 2026 to 2036
- Global Market Analysis and Forecast, By Electrical Layer, 2021 to 2036
- Introduction / Key Findings
- Historical Market Size Value (USD Million) Analysis By Electrical Layer, 2021 to 2025
- Current and Future Market Size Value (USD Million) Analysis and Forecast By Electrical Layer, 2026 to 2036
- Medium-voltage distribution
- Low-voltage distribution
- Rack / row-level
- Substation / grid interface
- Y-o-Y Growth Trend Analysis By Electrical Layer, 2021 to 2025
- Absolute $ Opportunity Analysis By Electrical Layer, 2026 to 2036
- Global Market Analysis and Forecast, By Power Capacity, 2021 to 2036
- Introduction / Key Findings
- Historical Market Size Value (USD Million) Analysis By Power Capacity, 2021 to 2025
- Current and Future Market Size Value (USD Million) Analysis and Forecast By Power Capacity, 2026 to 2036
- 51–150 MW
- 10–50 MW
- Below 10 MW
- Above 150 MW
- Y-o-Y Growth Trend Analysis By Power Capacity, 2021 to 2025
- Absolute $ Opportunity Analysis By Power Capacity, 2026 to 2036
- Global Market Analysis and Forecast, By Facility Type, 2021 to 2036
- Introduction / Key Findings
- Historical Market Size Value (USD Million) Analysis By Facility Type, 2021 to 2025
- Current and Future Market Size Value (USD Million) Analysis and Forecast By Facility Type, 2026 to 2036
- Hyperscale AI
- Colocation
- Enterprise / private cloud
- HPC / research
- Y-o-Y Growth Trend Analysis By Facility Type, 2021 to 2025
- Absolute $ Opportunity Analysis By Facility Type, 2026 to 2036
- Global Market Analysis and Forecast, By Route to Market, 2021 to 2036
- Introduction / Key Findings
- Historical Market Size Value (USD Million) Analysis By Route to Market, 2021 to 2025
- Current and Future Market Size Value (USD Million) Analysis and Forecast By Route to Market, 2026 to 2036
- OEM direct
- Electrical EPC / contractor
- System integrator
- Distributor / service partner
- Y-o-Y Growth Trend Analysis By Route to Market, 2021 to 2025
- Absolute $ Opportunity Analysis By Route to Market, 2026 to 2036
- Global Market Analysis and Forecast, By Region, 2021 to 2036
- Introduction
- Historical Market Size Value (USD Million) Analysis By Region, 2021 to 2025
- Current Market Size Value (USD Million) Analysis and Forecast By Region, 2026 to 2036
- North America
- Latin America
- Western Europe
- Eastern Europe
- East Asia
- South Asia and Pacific
- Middle East and Africa
- Market Attractiveness Analysis By Region
- North America Market Analysis and Forecast, By Country, 2021 to 2036
- Historical Market Size Value (USD Million) Trend Analysis By Market Taxonomy, 2021 to 2025
- Market Size Value (USD Million) Forecast By Market Taxonomy, 2026 to 2036
- By Country
- United States
- Canada
- By Software Function
- By Electrical Layer
- By Power Capacity
- By Facility Type
- By Route to Market
- By Country
- Market Attractiveness Analysis
- By Country
- By Software Function
- By Electrical Layer
- By Power Capacity
- By Facility Type
- By Route to Market
- Key Takeaways
- Latin America Market Analysis and Forecast, By Country
- Historical Market Size Value (USD Million) Trend Analysis By Market Taxonomy, 2021 to 2025
- Market Size Value (USD Million) Forecast By Market Taxonomy, 2026 to 2036
- By Country
- Brazil
- Mexico
- Argentina
- Chile
- By Software Function
- By Electrical Layer
- By Power Capacity
- By Facility Type
- By Route to Market
- By Country
- Market Attractiveness Analysis
- By Country
- By Software Function
- By Electrical Layer
- By Power Capacity
- By Facility Type
- By Route to Market
- Key Takeaways
- Western Europe Market Analysis and Forecast, By Country
- Historical Market Size Value (USD Million) Trend Analysis By Market Taxonomy, 2021 to 2025
- Market Size Value (USD Million) Forecast By Market Taxonomy, 2026 to 2036
- By Country
- Germany
- France
- United Kingdom
- Italy
- Spain
- Benelux
- Nordics
- By Software Function
- By Electrical Layer
- By Power Capacity
- By Facility Type
- By Route to Market
- By Country
- Market Attractiveness Analysis
- By Country
- By Software Function
- By Electrical Layer
- By Power Capacity
- By Facility Type
- By Route to Market
- Key Takeaways
- Eastern Europe Market Analysis and Forecast, By Country
- Historical Market Size Value (USD Million) Trend Analysis By Market Taxonomy, 2021 to 2025
- Market Size Value (USD Million) Forecast By Market Taxonomy, 2026 to 2036
- By Country
- Poland
- Czech Republic
- Romania
- Hungary
- By Software Function
- By Electrical Layer
- By Power Capacity
- By Facility Type
- By Route to Market
- By Country
- Market Attractiveness Analysis
- By Country
- By Software Function
- By Electrical Layer
- By Power Capacity
- By Facility Type
- By Route to Market
- Key Takeaways
- East Asia Market Analysis and Forecast, By Country
- Historical Market Size Value (USD Million) Trend Analysis By Market Taxonomy, 2021 to 2025
- Market Size Value (USD Million) Forecast By Market Taxonomy, 2026 to 2036
- By Country
- China
- Japan
- South Korea
- By Software Function
- By Electrical Layer
- By Power Capacity
- By Facility Type
- By Route to Market
- By Country
- Market Attractiveness Analysis
- By Country
- By Software Function
- By Electrical Layer
- By Power Capacity
- By Facility Type
- By Route to Market
- Key Takeaways
- South Asia and Pacific Market Analysis and Forecast, By Country
- Historical Market Size Value (USD Million) Trend Analysis By Market Taxonomy, 2021 to 2025
- Market Size Value (USD Million) Forecast By Market Taxonomy, 2026 to 2036
- By Country
- India
- ASEAN
- Australia and New Zealand
- By Software Function
- By Electrical Layer
- By Power Capacity
- By Facility Type
- By Route to Market
- By Country
- Market Attractiveness Analysis
- By Country
- By Software Function
- By Electrical Layer
- By Power Capacity
- By Facility Type
- By Route to Market
- Key Takeaways
- Middle East and Africa Market Analysis and Forecast, By Country
- Historical Market Size Value (USD Million) Trend Analysis By Market Taxonomy, 2021 to 2025
- Market Size Value (USD Million) Forecast By Market Taxonomy, 2026 to 2036
- By Country
- GCC Countries
- South Africa
- Türkiye
- Israel
- By Software Function
- By Electrical Layer
- By Power Capacity
- By Facility Type
- By Route to Market
- By Country
- Market Attractiveness Analysis
- By Country
- By Software Function
- By Electrical Layer
- By Power Capacity
- By Facility Type
- By Route to Market
- Key Takeaways
- Key Countries Market Analysis
- United States
- Pricing Analysis
- Market Share Analysis, 2025
- By Software Function
- By Electrical Layer
- By Power Capacity
- By Facility Type
- By Route to Market
- Canada
- Pricing Analysis
- Market Share Analysis, 2025
- By Software Function
- By Electrical Layer
- By Power Capacity
- By Facility Type
- By Route to Market
- Mexico
- Pricing Analysis
- Market Share Analysis, 2025
- By Software Function
- By Electrical Layer
- By Power Capacity
- By Facility Type
- By Route to Market
- Brazil
- Pricing Analysis
- Market Share Analysis, 2025
- By Software Function
- By Electrical Layer
- By Power Capacity
- By Facility Type
- By Route to Market
- Chile
- Pricing Analysis
- Market Share Analysis, 2025
- By Software Function
- By Electrical Layer
- By Power Capacity
- By Facility Type
- By Route to Market
- Germany
- Pricing Analysis
- Market Share Analysis, 2025
- By Software Function
- By Electrical Layer
- By Power Capacity
- By Facility Type
- By Route to Market
- United Kingdom
- Pricing Analysis
- Market Share Analysis, 2025
- By Software Function
- By Electrical Layer
- By Power Capacity
- By Facility Type
- By Route to Market
- Italy
- Pricing Analysis
- Market Share Analysis, 2025
- By Software Function
- By Electrical Layer
- By Power Capacity
- By Facility Type
- By Route to Market
- Spain
- Pricing Analysis
- Market Share Analysis, 2025
- By Software Function
- By Electrical Layer
- By Power Capacity
- By Facility Type
- By Route to Market
- France
- Pricing Analysis
- Market Share Analysis, 2025
- By Software Function
- By Electrical Layer
- By Power Capacity
- By Facility Type
- By Route to Market
- India
- Pricing Analysis
- Market Share Analysis, 2025
- By Software Function
- By Electrical Layer
- By Power Capacity
- By Facility Type
- By Route to Market
- ASEAN
- Pricing Analysis
- Market Share Analysis, 2025
- By Software Function
- By Electrical Layer
- By Power Capacity
- By Facility Type
- By Route to Market
- Australia and New Zealand
- Pricing Analysis
- Market Share Analysis, 2025
- By Software Function
- By Electrical Layer
- By Power Capacity
- By Facility Type
- By Route to Market
- China
- Pricing Analysis
- Market Share Analysis, 2025
- By Software Function
- By Electrical Layer
- By Power Capacity
- By Facility Type
- By Route to Market
- Japan
- Pricing Analysis
- Market Share Analysis, 2025
- By Software Function
- By Electrical Layer
- By Power Capacity
- By Facility Type
- By Route to Market
- South Korea
- Pricing Analysis
- Market Share Analysis, 2025
- By Software Function
- By Electrical Layer
- By Power Capacity
- By Facility Type
- By Route to Market
- Poland
- Pricing Analysis
- Market Share Analysis, 2025
- By Software Function
- By Electrical Layer
- By Power Capacity
- By Facility Type
- By Route to Market
- Hungary
- Pricing Analysis
- Market Share Analysis, 2025
- By Software Function
- By Electrical Layer
- By Power Capacity
- By Facility Type
- By Route to Market
- Türkiye
- Pricing Analysis
- Market Share Analysis, 2025
- By Software Function
- By Electrical Layer
- By Power Capacity
- By Facility Type
- By Route to Market
- South Africa
- Pricing Analysis
- Market Share Analysis, 2025
- By Software Function
- By Electrical Layer
- By Power Capacity
- By Facility Type
- By Route to Market
- Saudi Arabia
- Pricing Analysis
- Market Share Analysis, 2025
- By Software Function
- By Electrical Layer
- By Power Capacity
- By Facility Type
- By Route to Market
- United States
- Market Structure Analysis
- Competition Dashboard
- Competition Benchmarking
- Market Share Analysis of Top Players
- By Regional
- By Software Function
- By Electrical Layer
- By Power Capacity
- By Facility Type
- By Route to Market
- Emerging Startups
- Innovation Benchmarking
- Competition Analysis
- Competition Deep Dive
- Siemens
- Overview
- Product Portfolio
- Profitability by Market Segments
- Sales Footprint
- Strategy Overview
- Marketing Strategy
- Product Strategy
- Channel Strategy
- Hitachi Energy
- Schneider Electric
- Eaton
- ABB
- Siemens
- Case Studies
- Success Stories
- Recent Developments
- Competition Deep Dive
- Assumptions & Acronyms Used


