
- Market Size (2026)
- USD 441.9 Mn
- Forecast (2036)
- USD 1254.7 Mn
- CAGR (2026 to 2036)
- 11.0%
How big is AI Factory Capacity Orchestration Software Market in 2026?
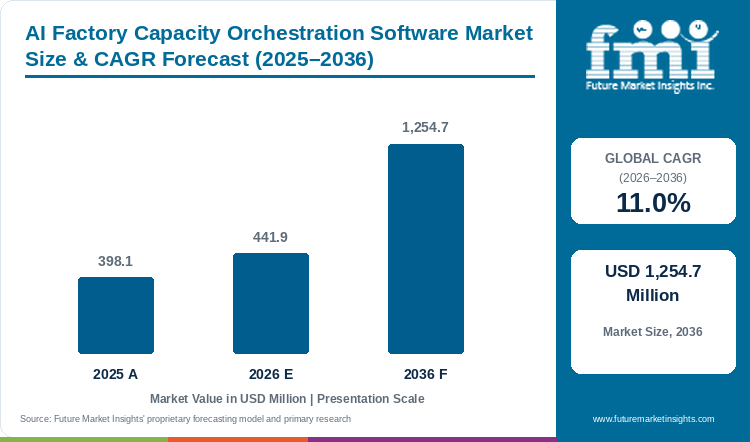
The market was valued at USD 398.1 Million in 2025 and is expected to reach USD 441.9 Million in 2026, with growth at an 11.0% CAGR from 2026 to 2036 taking its value to USD 1,254.7 Million by 2036.
An idle GPU may already be reserved or lack the network, storage or electrical resources required by the next job, making inventory alone an incomplete view of capacity. Orchestration brings those conditions into allocation through an accurate equipment record and the rules governing who may use each resource. Customers need that view to reduce unsuccessful placements and manual coordination, which requires connections to existing infrastructure and job controls rather than another dashboard carrying stale reservations. Decisions also need to preserve recovery and overrides when a resource changes state after allocation. Shared programs in Germany and France illustrate how several users may depend on one pool while holding different priorities and rights. The forecast includes qualifying monitoring, allocation, simulation and governance software, excluding GPU systems, physical networking and cooling equipment, and services without the defined orchestration function.
Key Market Trends & Insights
- Monitoring & telemetry holds 27.0% of platform function in 2026, distinguishing healthy, assignable resources from idle devices constrained by reservations or facility conditions.
- SaaS / public cloud holds 38.0% of deployment model in 2026, giving distributed teams common provisioning, alert and usage policies through connected local controls.
- 251–500 kW holds 32.0% of AI rack density in 2026, making shared electrical and cooling conditions relevant to whether installed capacity can accept more work.
- Hyperscale AI data centers account for 46.0% of data center type in 2026, requiring allocation rules that reconcile new demand with reservations already made to other users.
Regional Highlights
- UAE has the highest profiled CAGR at 12.4% during 2026–2036.
- The next two profiled growth rates are France at 12.1% and South Korea at 11.8% over the same period.
Market Size & Forecast
| Metric | Value |
|---|---|
| 2025 market value | USD 398.1 Million |
| 2026 market estimate | USD 441.9 Million |
| 2036 market forecast | USD 1,254.7 Million |
| Forecast CAGR, 2026–2036 | 11.0% |
The market covers software used to monitor, allocate, simulate, optimize or govern AI-factory compute capacity. GPU systems, physical networking and cooling infrastructure, and services that do not supply the specified orchestration functionality are excluded.
Capacity orchestration should account for data-center power alongside accelerator inventory, since installed hardware does not always represent immediately usable capacity.
Infrastructure readiness and acceptance
| Documented operating context | Source |
|---|---|
| NVIDIA described Mission Control’s AI-factory provisioning, telemetry and recovery functions in March 2025. | |
| Red Hat’s May 2025 technical article describes Kueue-based workload admission and GPU resource allocation in OpenShift AI. | |
| NVIDIA announced its acquisition of SchedMD in December 2025 and said Slurm would remain open source. | |
| HPE announced GreenLake Intelligence in June 2025 as an approach to coordinated hybrid-IT operations. |
Analyst Perspective
An allocation platform needs a current record of equipment state, reservations and the dependencies required to run a job. Connecting those conditions to existing controls can reduce failed placements and manual coordination, provided operators retain clear recovery procedures and authority when a resource becomes unavailable after it has been promised.
- Nikhil Kaitwade, Principal Analyst at Future Market Insights
How is the AI factory capacity orchestration software market segmented?
Platform Function covers Monitoring & telemetry, Planning & simulation, Optimization & control, Fault / reliability analytics and Reporting & governance. Deployment Model covers SaaS / public cloud, Private cloud, On-premise and Hybrid deployment. AI Rack Density covers 251–500 kW, 100–250 kW, Below 100 kW and Above 500 kW. Data Center Type covers Hyperscale AI data centers, Colocation AI facilities, Enterprise private AI and HPC & research centers. Commercial Model covers Direct enterprise contract, System integrator / EPC-led, Subscription / license and Managed-service contract.
A connection to data-center infrastructure management can bring equipment state and maintenance restrictions into the allocation decision.
Why does Monitoring & telemetry lead platform function demand?
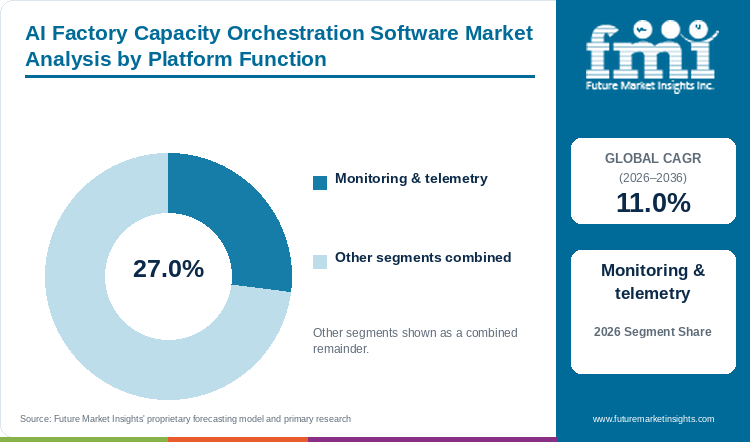
Monitoring & telemetry: 27.0% of platform function in 2026.
Monitoring establishes whether equipment is usable for a particular workload by reconciling health and maintenance information with reservations and infrastructure limits. An apparently idle accelerator may belong to another tenant or depend on a failed resource elsewhere, so unrelated utilization readings leave the allocation question unresolved. Timely configuration changes and a current resource record allow telemetry to guide the next placement instead of serving only as a report after scheduling has occurred.
- The Monitoring & telemetry segment accounts for 27.0% of platform function in 2026.
- A capacity record should identify reservations and maintenance restrictions before free resources are offered to another workload.
Why does SaaS / public cloud lead deployment model demand?
SaaS / public cloud: 38.0% of deployment model in 2026.
Hosted orchestration gives distributed teams common provisioning and usage controls while reducing separate management upgrades at each site. Its usefulness depends on connections to the systems that actually allocate resources, with identity boundaries, local authority and continuity arrangements established before access is expanded. Private deployment remains relevant where detailed operational data must stay within a sovereign or regulated environment, making the appropriate model dependent on permissions as well as administrative convenience.
- The SaaS / public cloud segment accounts for 38.0% of deployment model in 2026.
- Hosted orchestration needs a defined response when a site connection fails so that existing reservations and local operating rules remain intact.
What are the drivers, restraints, and opportunities in the AI factory capacity orchestration software market?
Shared AI resources need explicit allocation policies
Purchased equipment can remain idle because the resources needed to run a job are owned or managed separately. Staff may have to reconcile a queue reservation with network access and available facility capacity before releasing it. Orchestration can reduce that delay by making dependencies visible within the allocation process. Buyers should establish where work is currently blocked rather than assume that all idle time reflects insufficient demand. A useful deployment shows fewer failed placements or shorter provisioning delays. Those outcomes provide a stronger basis for expanding the software than a higher aggregate utilization figure alone.
Fragmented controls complicate cluster-wide decisions
The platform depends on information held in several existing systems. Inventory and job queues may be updated at different times while equipment changes are handled through local procedures. A stale record can turn an apparently valid allocation into a failed deployment. Buyers therefore need to test discovery and reconciliation as carefully as scheduling logic. Recovery and rollback also matter when the platform spans several control layers. An organization may retain familiar scripts until the new system demonstrates that it can manage those failures without creating conflicting authority.
A common operations layer can improve productive utilization
A supplier can begin with a specific provisioning delay and connect only the systems needed to resolve it. This gives the operator a defined outcome to measure. Once the allocation process works reliably it can be extended to additional resource pools or facilities. Expansion should retain clear responsibility for incidents that cross software and building-system boundaries. The opportunity is to reduce manual coordination rather than replace every existing tool at once. A platform that makes a concrete operating task easier has a clearer route to adoption than one promising a complete new control layer without a demonstrated need.
Results from AI infrastructure commissioning provide a practical boundary for the capacity that an orchestration platform can safely expose to users.
Which country and market CAGRs are profiled for AI factory capacity orchestration software?
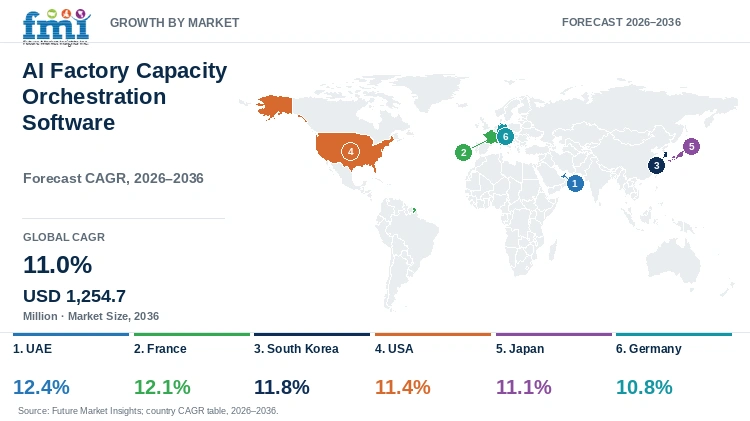
| Country | CAGR |
|---|---|
| UAE | 12.4% |
| France | 12.1% |
| South Korea | 11.8% |
| USA | 11.4% |
| Japan | 11.1% |
| Germany | 10.8% |
Country-wise Analysis
UAE
- Capacity reservations in phased UAE campuses need to follow commissioning, because equipment arrival may precede the release of supporting power. The market’s 12.4% CAGR forecast for 2026 to 2036 is the fastest profiled rate, with a shared platform needing to expose those states before making tenant commitments. Inspectable allocation rules and accurate availability records help participating operators retain responsibility for capacity already promised elsewhere.
France
- Shared French research and enterprise facilities need transparent quotas while avoiding unnecessary exposure of operational data. Working through existing control points lets a provider begin with a defined pool and measure allocation improvements within France’s 12.1% CAGR forecast for 2026 to 2036. Expansion across administrative domains then depends on permission to use the resources shown, since a common capacity view does not itself grant those rights.
South Korea
- Equipment ownership and allocation rights need early agreement in South Korea’s shared-compute environments, where memory, fabric access and power can limit an apparently free accelerator. The 11.8% CAGR forecast for 2026 to 2036 accompanies demand for a pool view that combines those conditions with reservations. Operators can then authorize an allocation without treating installed device counts as proof that a specific job can run.
USA
- Mixed-generation equipment and differing ownership arrangements complicate American fleet allocation, with interconnection delays adding uncertainty about the release of new capacity. Within the USA’s 11.4% CAGR forecast for 2026 to 2036, buyers need to see which installed resources can accept a particular job now. Keeping reservations and failures visible helps explain queue delays that an aggregate utilization score can conceal.
Japan
- Network paths and local operating limits affect allocation among geographically separated Japanese sites, making permission from infrastructure owners part of the placement decision. Accurate records let platform teams compare user requirements with resources they can actually assign, reducing repeated manual checks. Japan is forecast to grow at an 11.1% CAGR from 2026 to 2036 as orchestration supports this practical handoff between infrastructure and workload control.
Germany
- Existing allocation rules in German scientific environments shape how new AI work can enter a shared pool, alongside data-placement restrictions and change approval. Germany’s 10.8% CAGR forecast for 2026 to 2036 sits within that operating context, where suppliers need to expose conditions before promising capacity. Preserving established workflows also helps secure support from teams responsible for equipment and scientific services already in use.
Who are the notable companies in the AI factory capacity orchestration software market?
NVIDIA, including SchedMD; Red Hat; Hewlett Packard Enterprise; IBM; Siemens Digital Industries Software
Capacity orchestration competes on the accuracy of its allocation decisions. A broad inventory is useful only when reservations and infrastructure limits remain current. Vendors need to show that the platform can work with existing control systems rather than create another place where operators must reconcile conflicting information.
Competitive Benchmarking: AI Factory Capacity Orchestration Software Market
| Participant | Commercial focus | Buyer qualification priority |
|---|---|---|
| NVIDIA, including SchedMD | AI workload and cluster management | Scheduler integration and recovery controls |
| Red Hat | Kubernetes and OpenShift AI platforms | Admission policy and operational consistency |
| Hewlett Packard Enterprise | Hybrid infrastructure operations | Workload-to-infrastructure visibility |
| IBM | Enterprise workload orchestration | Priority rules and queue governance |
| Siemens Digital Industries Software | HPC workload-management software | Policy integration and deployment support |
Key Developments in the AI Factory Capacity Orchestration Software Market
- NVIDIA described Mission Control’s AI-factory provisioning, telemetry and recovery functions in March 2025.
- Red Hat’s May 2025 technical article describes Kueue-based workload admission and GPU resource allocation in OpenShift AI.
Key Players in the AI Factory Capacity Orchestration Software Market
- NVIDIA, including SchedMD
- Red Hat
- Hewlett Packard Enterprise
- IBM
- Siemens Digital Industries Software
AI Factory Capacity Orchestration Software Market - Report Scope
| Coverage field | Report scope |
|---|---|
| Market breakdown | Platform Function; Deployment Model; AI Rack Density; Data Center Type; Commercial Model; Region |
| Quantitative unit | USD Million |
| Market definition | The market covers software used to monitor, allocate, simulate, optimize or govern AI-factory compute capacity. GPU systems, physical networking and cooling infrastructure, and services that do not supply the specified orchestration functionality are excluded. |
| Regions covered | North America; Latin America; Western Europe; Eastern Europe; East Asia; South Asia and Pacific; Middle East and Africa |
| Countries / markets profiled | UAE; France; South Korea; USA; Japan; Germany |
| Key companies profiled | NVIDIA, including SchedMD; Red Hat; Hewlett Packard Enterprise; IBM; Siemens Digital Industries Software |
| Base year / forecast period | 2026 / 2026–2036 |
| Estimate coverage | 2025 and 2026 market estimates; 2036 forecast; segment shares and country / market CAGRs. |
AI Factory Capacity Orchestration Software Market - Research Methodology
| Method | Application |
|---|---|
| Market definition | The analysis follows the stated product or service boundary and distinguishes direct category revenue from adjacent activities. |
| Secondary research | Official technical, regulatory, research and company publications provide the documented operating context and recent developments cited in this report. |
| Forecast and segmentation | Market estimates, segment shares and geographic forecasts are presented as analytical estimates within the stated commercial scope. |
| Competitive assessment | Participants are compared by their relevant products or services, commercial role and buyer qualification requirements. |
| Interpretation | The assessment considers purchasing conditions and the scope of the documented product, service or performance claim. |
AI Factory Capacity Orchestration Software Market by Segments
Platform Function
- Monitoring & telemetry
- Planning & simulation
- Optimization & control
- Fault / reliability analytics
- Reporting & governance
Deployment Model
- SaaS / public cloud
- Private cloud
- On-premise
- Hybrid deployment
AI Rack Density
- 251–500 kW
- 100–250 kW
- Below 100 kW
- Above 500 kW
Data Center Type
- Hyperscale AI data centers
- Colocation AI facilities
- Enterprise private AI
- HPC & research centers
Commercial Model
- Direct enterprise contract
- System integrator / EPC-led
- Subscription / license
- Managed-service contract
AI Factory Capacity Orchestration Software Market by Region
- North America
- United States
- Canada
- Latin America
- Brazil
- Mexico
- Argentina
- Chile
- Western Europe
- Germany
- France
- United Kingdom
- Italy
- Spain
- Benelux
- Nordics
- Eastern Europe
- Poland
- Czech Republic
- Romania
- Hungary
- East Asia
- China
- Japan
- South Korea
- South Asia and Pacific
- India
- ASEAN
- Australia and New Zealand
- Middle East and Africa
- GCC Countries
- South Africa
- Türkiye
- Israel
Research Sources and Bibliography
- [1] NVIDIA. (2025, March 25). Automating AI Factories with NVIDIA Mission Control.
- [2] Red Hat. (2025, May 22). Improve GPU utilization with Kueue in OpenShift AI.
- [3] NVIDIA. (2025, December 15). NVIDIA Acquires Open-Source Workload Management Provider SchedMD.
- [4] HPE. (2025, June 24). HPE Reimagines Hybrid IT Operations with GreenLake Intelligence.
- [5] Future Market Insights. (2026). AI Factory Capacity Orchestration Software Market: Global industry analysis and opportunity assessment, 2026–2036.
This Report Answers
- How large is the AI factory capacity orchestration software market in 2026?
- What value and CAGR are forecast through 2036?
- Which platform function segment leads in 2026?
- Which deployment model segment has the largest share?
- Which profiled country or market has the fastest forecast growth?
- Which participants are covered in the competitive assessment?
Table of Content
- Key Takeaways
- Market Size and CAGR
- Top Growth Driver
- Fastest Growing Segment
- Leading Region
- Key Companies
- Emerging Opportunities
- Executive Summary
- Global Market Outlook
- Demand-side Trends
- Supply-side Trends
- Technology Roadmap Analysis
- Analysis and Recommendations
- Analyst Perspective (What is happening? Why now? What should investors know?)
- Key Questions Answered
- How large is the market?
- What is the CAGR?
- What are key trends?
- Which region dominates?
- Who are the leaders?
Read More...
- Market Overview
- Market Coverage / Taxonomy
- Market Definition / Scope / Limitations
- Research Methodology
- Chapter Orientation
- Analytical Lens and Working Hypotheses
- Market Structure, Signals, and Trend Drivers
- Benchmarking and Cross-market Comparability
- Market Sizing, Forecasting, and Opportunity Mapping
- Research Design and Evidence Framework
- Desk Research Programme (Secondary Evidence)
- Expert Input and Fieldwork (Primary Evidence)
- Tooling, Models, and Reference Databases
- Data Engineering and Model Build
- Quality Assurance and Audit Trail
- Market Background
- Market Dynamics (Drivers, Restraints, Opportunity, Trends)
- Scenario Forecast (Optimistic, Likely, Conservative)
- Impact Analysis
- AI Impact
- Sustainability Impact
- Regulatory Impact
- Technology Impact
- Consumer / Buyer Analysis
- Purchase Drivers
- Adoption Barriers
- Buyer Journey
- Opportunity Map Analysis
- Product Life Cycle Analysis
- Supply Chain Analysis
- Investment Feasibility Matrix
- Value Chain Analysis
- PESTLE and Porter's Analysis
- Regulatory Landscape
- Regional Parent Market Outlook
- Production and Consumption Statistics
- Import and Export Statistics
- Global Market Analysis and Forecast, 2021 to 2036
- Historical Market Size Value (USD Million) Analysis, 2021 to 2025
- Current and Future Market Size Value (USD Million) Projections, 2026 to 2036
- Y-o-Y Growth Trend Analysis
- Absolute $ Opportunity Analysis
- Global Market Pricing Analysis, 2021 to 2036
- Global Market Analysis and Forecast, By Platform Function, 2021 to 2036
- Introduction / Key Findings
- Historical Market Size Value (USD Million) Analysis By Platform Function, 2021 to 2025
- Current and Future Market Size Value (USD Million) Analysis and Forecast By Platform Function, 2026 to 2036
- Monitoring & telemetry
- Planning & simulation
- Optimization & control
- Fault / reliability analytics
- Reporting & governance
- Y-o-Y Growth Trend Analysis By Platform Function, 2021 to 2025
- Absolute $ Opportunity Analysis By Platform Function, 2026 to 2036
- Global Market Analysis and Forecast, By Deployment Model, 2021 to 2036
- Introduction / Key Findings
- Historical Market Size Value (USD Million) Analysis By Deployment Model, 2021 to 2025
- Current and Future Market Size Value (USD Million) Analysis and Forecast By Deployment Model, 2026 to 2036
- SaaS / public cloud
- Private cloud
- On-premise
- Hybrid deployment
- Y-o-Y Growth Trend Analysis By Deployment Model, 2021 to 2025
- Absolute $ Opportunity Analysis By Deployment Model, 2026 to 2036
- Global Market Analysis and Forecast, By AI Rack Density, 2021 to 2036
- Introduction / Key Findings
- Historical Market Size Value (USD Million) Analysis By AI Rack Density, 2021 to 2025
- Current and Future Market Size Value (USD Million) Analysis and Forecast By AI Rack Density, 2026 to 2036
- 251–500 kW
- 100–250 kW
- Below 100 kW
- Above 500 kW
- Y-o-Y Growth Trend Analysis By AI Rack Density, 2021 to 2025
- Absolute $ Opportunity Analysis By AI Rack Density, 2026 to 2036
- Global Market Analysis and Forecast, By Data Center Type, 2021 to 2036
- Introduction / Key Findings
- Historical Market Size Value (USD Million) Analysis By Data Center Type, 2021 to 2025
- Current and Future Market Size Value (USD Million) Analysis and Forecast By Data Center Type, 2026 to 2036
- Hyperscale AI data centers
- Colocation AI facilities
- Enterprise private AI
- HPC & research centers
- Y-o-Y Growth Trend Analysis By Data Center Type, 2021 to 2025
- Absolute $ Opportunity Analysis By Data Center Type, 2026 to 2036
- Global Market Analysis and Forecast, By Commercial Model, 2021 to 2036
- Introduction / Key Findings
- Historical Market Size Value (USD Million) Analysis By Commercial Model, 2021 to 2025
- Current and Future Market Size Value (USD Million) Analysis and Forecast By Commercial Model, 2026 to 2036
- Direct enterprise contract
- System integrator / EPC-led
- Subscription / license
- Managed-service contract
- Y-o-Y Growth Trend Analysis By Commercial Model, 2021 to 2025
- Absolute $ Opportunity Analysis By Commercial Model, 2026 to 2036
- Global Market Analysis and Forecast, By Region, 2021 to 2036
- Introduction
- Historical Market Size Value (USD Million) Analysis By Region, 2021 to 2025
- Current Market Size Value (USD Million) Analysis and Forecast By Region, 2026 to 2036
- North America
- Latin America
- Western Europe
- Eastern Europe
- East Asia
- South Asia and Pacific
- Middle East and Africa
- Market Attractiveness Analysis By Region
- North America Market Analysis and Forecast, By Country, 2021 to 2036
- Historical Market Size Value (USD Million) Trend Analysis By Market Taxonomy, 2021 to 2025
- Market Size Value (USD Million) Forecast By Market Taxonomy, 2026 to 2036
- By Country
- United States
- Canada
- By Platform Function
- By Deployment Model
- By AI Rack Density
- By Data Center Type
- By Commercial Model
- By Country
- Market Attractiveness Analysis
- By Country
- By Platform Function
- By Deployment Model
- By AI Rack Density
- By Data Center Type
- By Commercial Model
- Key Takeaways
- Latin America Market Analysis and Forecast, By Country
- Historical Market Size Value (USD Million) Trend Analysis By Market Taxonomy, 2021 to 2025
- Market Size Value (USD Million) Forecast By Market Taxonomy, 2026 to 2036
- By Country
- Brazil
- Mexico
- Argentina
- Chile
- By Platform Function
- By Deployment Model
- By AI Rack Density
- By Data Center Type
- By Commercial Model
- By Country
- Market Attractiveness Analysis
- By Country
- By Platform Function
- By Deployment Model
- By AI Rack Density
- By Data Center Type
- By Commercial Model
- Key Takeaways
- Western Europe Market Analysis and Forecast, By Country
- Historical Market Size Value (USD Million) Trend Analysis By Market Taxonomy, 2021 to 2025
- Market Size Value (USD Million) Forecast By Market Taxonomy, 2026 to 2036
- By Country
- Germany
- France
- United Kingdom
- Italy
- Spain
- Benelux
- Nordics
- By Platform Function
- By Deployment Model
- By AI Rack Density
- By Data Center Type
- By Commercial Model
- By Country
- Market Attractiveness Analysis
- By Country
- By Platform Function
- By Deployment Model
- By AI Rack Density
- By Data Center Type
- By Commercial Model
- Key Takeaways
- Eastern Europe Market Analysis and Forecast, By Country
- Historical Market Size Value (USD Million) Trend Analysis By Market Taxonomy, 2021 to 2025
- Market Size Value (USD Million) Forecast By Market Taxonomy, 2026 to 2036
- By Country
- Poland
- Czech Republic
- Romania
- Hungary
- By Platform Function
- By Deployment Model
- By AI Rack Density
- By Data Center Type
- By Commercial Model
- By Country
- Market Attractiveness Analysis
- By Country
- By Platform Function
- By Deployment Model
- By AI Rack Density
- By Data Center Type
- By Commercial Model
- Key Takeaways
- East Asia Market Analysis and Forecast, By Country
- Historical Market Size Value (USD Million) Trend Analysis By Market Taxonomy, 2021 to 2025
- Market Size Value (USD Million) Forecast By Market Taxonomy, 2026 to 2036
- By Country
- China
- Japan
- South Korea
- By Platform Function
- By Deployment Model
- By AI Rack Density
- By Data Center Type
- By Commercial Model
- By Country
- Market Attractiveness Analysis
- By Country
- By Platform Function
- By Deployment Model
- By AI Rack Density
- By Data Center Type
- By Commercial Model
- Key Takeaways
- South Asia and Pacific Market Analysis and Forecast, By Country
- Historical Market Size Value (USD Million) Trend Analysis By Market Taxonomy, 2021 to 2025
- Market Size Value (USD Million) Forecast By Market Taxonomy, 2026 to 2036
- By Country
- India
- ASEAN
- Australia and New Zealand
- By Platform Function
- By Deployment Model
- By AI Rack Density
- By Data Center Type
- By Commercial Model
- By Country
- Market Attractiveness Analysis
- By Country
- By Platform Function
- By Deployment Model
- By AI Rack Density
- By Data Center Type
- By Commercial Model
- Key Takeaways
- Middle East and Africa Market Analysis and Forecast, By Country
- Historical Market Size Value (USD Million) Trend Analysis By Market Taxonomy, 2021 to 2025
- Market Size Value (USD Million) Forecast By Market Taxonomy, 2026 to 2036
- By Country
- GCC Countries
- South Africa
- Türkiye
- Israel
- By Platform Function
- By Deployment Model
- By AI Rack Density
- By Data Center Type
- By Commercial Model
- By Country
- Market Attractiveness Analysis
- By Country
- By Platform Function
- By Deployment Model
- By AI Rack Density
- By Data Center Type
- By Commercial Model
- Key Takeaways
- Key Countries Market Analysis
- United States
- Pricing Analysis
- Market Share Analysis, 2025
- By Platform Function
- By Deployment Model
- By AI Rack Density
- By Data Center Type
- By Commercial Model
- Canada
- Pricing Analysis
- Market Share Analysis, 2025
- By Platform Function
- By Deployment Model
- By AI Rack Density
- By Data Center Type
- By Commercial Model
- Mexico
- Pricing Analysis
- Market Share Analysis, 2025
- By Platform Function
- By Deployment Model
- By AI Rack Density
- By Data Center Type
- By Commercial Model
- Brazil
- Pricing Analysis
- Market Share Analysis, 2025
- By Platform Function
- By Deployment Model
- By AI Rack Density
- By Data Center Type
- By Commercial Model
- Chile
- Pricing Analysis
- Market Share Analysis, 2025
- By Platform Function
- By Deployment Model
- By AI Rack Density
- By Data Center Type
- By Commercial Model
- Germany
- Pricing Analysis
- Market Share Analysis, 2025
- By Platform Function
- By Deployment Model
- By AI Rack Density
- By Data Center Type
- By Commercial Model
- United Kingdom
- Pricing Analysis
- Market Share Analysis, 2025
- By Platform Function
- By Deployment Model
- By AI Rack Density
- By Data Center Type
- By Commercial Model
- Italy
- Pricing Analysis
- Market Share Analysis, 2025
- By Platform Function
- By Deployment Model
- By AI Rack Density
- By Data Center Type
- By Commercial Model
- Spain
- Pricing Analysis
- Market Share Analysis, 2025
- By Platform Function
- By Deployment Model
- By AI Rack Density
- By Data Center Type
- By Commercial Model
- France
- Pricing Analysis
- Market Share Analysis, 2025
- By Platform Function
- By Deployment Model
- By AI Rack Density
- By Data Center Type
- By Commercial Model
- India
- Pricing Analysis
- Market Share Analysis, 2025
- By Platform Function
- By Deployment Model
- By AI Rack Density
- By Data Center Type
- By Commercial Model
- ASEAN
- Pricing Analysis
- Market Share Analysis, 2025
- By Platform Function
- By Deployment Model
- By AI Rack Density
- By Data Center Type
- By Commercial Model
- Australia and New Zealand
- Pricing Analysis
- Market Share Analysis, 2025
- By Platform Function
- By Deployment Model
- By AI Rack Density
- By Data Center Type
- By Commercial Model
- China
- Pricing Analysis
- Market Share Analysis, 2025
- By Platform Function
- By Deployment Model
- By AI Rack Density
- By Data Center Type
- By Commercial Model
- Japan
- Pricing Analysis
- Market Share Analysis, 2025
- By Platform Function
- By Deployment Model
- By AI Rack Density
- By Data Center Type
- By Commercial Model
- South Korea
- Pricing Analysis
- Market Share Analysis, 2025
- By Platform Function
- By Deployment Model
- By AI Rack Density
- By Data Center Type
- By Commercial Model
- Poland
- Pricing Analysis
- Market Share Analysis, 2025
- By Platform Function
- By Deployment Model
- By AI Rack Density
- By Data Center Type
- By Commercial Model
- Hungary
- Pricing Analysis
- Market Share Analysis, 2025
- By Platform Function
- By Deployment Model
- By AI Rack Density
- By Data Center Type
- By Commercial Model
- Türkiye
- Pricing Analysis
- Market Share Analysis, 2025
- By Platform Function
- By Deployment Model
- By AI Rack Density
- By Data Center Type
- By Commercial Model
- South Africa
- Pricing Analysis
- Market Share Analysis, 2025
- By Platform Function
- By Deployment Model
- By AI Rack Density
- By Data Center Type
- By Commercial Model
- UAE
- Pricing Analysis
- Market Share Analysis, 2025
- By Platform Function
- By Deployment Model
- By AI Rack Density
- By Data Center Type
- By Commercial Model
- United States
- Market Structure Analysis
- Competition Dashboard
- Competition Benchmarking
- Market Share Analysis of Top Players
- By Regional
- By Platform Function
- By Deployment Model
- By AI Rack Density
- By Data Center Type
- By Commercial Model
- Emerging Startups
- Innovation Benchmarking
- Competition Analysis
- Competition Deep Dive
- NVIDIA, including SchedMD
- Overview
- Product Portfolio
- Profitability by Market Segments
- Sales Footprint
- Strategy Overview
- Marketing Strategy
- Product Strategy
- Channel Strategy
- Red Hat
- Hewlett Packard Enterprise
- IBM
- Siemens Digital Industries Software
- NVIDIA, including SchedMD
- Case Studies
- Success Stories
- Recent Developments
- Competition Deep Dive
- Assumptions & Acronyms Used
List of Tables
- Table 1: Global Market Value (USD Million) Forecast by Region, 2021 to 2036
- Table 2: Global Market Value (USD Million) Forecast by Platform Function, 2021 to 2036
- Table 3: Global Market Value (USD Million) Forecast by Deployment Model, 2021 to 2036
- Table 4: Global Market Value (USD Million) Forecast by AI Rack Density, 2021 to 2036
- Table 5: Global Market Value (USD Million) Forecast by Data Center Type, 2021 to 2036
- Table 6: Global Market Value (USD Million) Forecast by Commercial Model, 2021 to 2036
- Table 7: North America Market Value (USD Million) Forecast by Country, 2021 to 2036
- Table 8: North America Market Value (USD Million) Forecast by Platform Function, 2021 to 2036
- Table 9: North America Market Value (USD Million) Forecast by Deployment Model, 2021 to 2036
- Table 10: North America Market Value (USD Million) Forecast by AI Rack Density, 2021 to 2036
- Table 11: North America Market Value (USD Million) Forecast by Data Center Type, 2021 to 2036
- Table 12: North America Market Value (USD Million) Forecast by Commercial Model, 2021 to 2036
- Table 13: Latin America Market Value (USD Million) Forecast by Country, 2021 to 2036
- Table 14: Latin America Market Value (USD Million) Forecast by Platform Function, 2021 to 2036
- Table 15: Latin America Market Value (USD Million) Forecast by Deployment Model, 2021 to 2036
- Table 16: Latin America Market Value (USD Million) Forecast by AI Rack Density, 2021 to 2036
- Table 17: Latin America Market Value (USD Million) Forecast by Data Center Type, 2021 to 2036
- Table 18: Latin America Market Value (USD Million) Forecast by Commercial Model, 2021 to 2036
- Table 19: Western Europe Market Value (USD Million) Forecast by Country, 2021 to 2036
- Table 20: Western Europe Market Value (USD Million) Forecast by Platform Function, 2021 to 2036
- Table 21: Western Europe Market Value (USD Million) Forecast by Deployment Model, 2021 to 2036
- Table 22: Western Europe Market Value (USD Million) Forecast by AI Rack Density, 2021 to 2036
- Table 23: Western Europe Market Value (USD Million) Forecast by Data Center Type, 2021 to 2036
- Table 24: Western Europe Market Value (USD Million) Forecast by Commercial Model, 2021 to 2036
- Table 25: Eastern Europe Market Value (USD Million) Forecast by Country, 2021 to 2036
- Table 26: Eastern Europe Market Value (USD Million) Forecast by Platform Function, 2021 to 2036
- Table 27: Eastern Europe Market Value (USD Million) Forecast by Deployment Model, 2021 to 2036
- Table 28: Eastern Europe Market Value (USD Million) Forecast by AI Rack Density, 2021 to 2036
- Table 29: Eastern Europe Market Value (USD Million) Forecast by Data Center Type, 2021 to 2036
- Table 30: Eastern Europe Market Value (USD Million) Forecast by Commercial Model, 2021 to 2036
- Table 31: East Asia Market Value (USD Million) Forecast by Country, 2021 to 2036
- Table 32: East Asia Market Value (USD Million) Forecast by Platform Function, 2021 to 2036
- Table 33: East Asia Market Value (USD Million) Forecast by Deployment Model, 2021 to 2036
- Table 34: East Asia Market Value (USD Million) Forecast by AI Rack Density, 2021 to 2036
- Table 35: East Asia Market Value (USD Million) Forecast by Data Center Type, 2021 to 2036
- Table 36: East Asia Market Value (USD Million) Forecast by Commercial Model, 2021 to 2036
- Table 37: South Asia and Pacific Market Value (USD Million) Forecast by Country, 2021 to 2036
- Table 38: South Asia and Pacific Market Value (USD Million) Forecast by Platform Function, 2021 to 2036
- Table 39: South Asia and Pacific Market Value (USD Million) Forecast by Deployment Model, 2021 to 2036
- Table 40: South Asia and Pacific Market Value (USD Million) Forecast by AI Rack Density, 2021 to 2036
- Table 41: South Asia and Pacific Market Value (USD Million) Forecast by Data Center Type, 2021 to 2036
- Table 42: South Asia and Pacific Market Value (USD Million) Forecast by Commercial Model, 2021 to 2036
- Table 43: Middle East and Africa Market Value (USD Million) Forecast by Country, 2021 to 2036
- Table 44: Middle East and Africa Market Value (USD Million) Forecast by Platform Function, 2021 to 2036
- Table 45: Middle East and Africa Market Value (USD Million) Forecast by Deployment Model, 2021 to 2036
- Table 46: Middle East and Africa Market Value (USD Million) Forecast by AI Rack Density, 2021 to 2036
- Table 47: Middle East and Africa Market Value (USD Million) Forecast by Data Center Type, 2021 to 2036
- Table 48: Middle East and Africa Market Value (USD Million) Forecast by Commercial Model, 2021 to 2036
List of Figures
- Figure 1: Global Market Pricing Analysis
- Figure 2: Global Market Value (USD Million) Forecast 2021-2036
- Figure 3: Global Market Value Share and BPS Analysis by Platform Function, 2026 and 2036
- Figure 4: Global Market Y-o-Y Growth Comparison by Platform Function, 2026-2036
- Figure 5: Global Market Attractiveness Analysis by Platform Function
- Figure 6: Global Market Value Share and BPS Analysis by Deployment Model, 2026 and 2036
- Figure 7: Global Market Y-o-Y Growth Comparison by Deployment Model, 2026-2036
- Figure 8: Global Market Attractiveness Analysis by Deployment Model
- Figure 9: Global Market Value Share and BPS Analysis by AI Rack Density, 2026 and 2036
- Figure 10: Global Market Y-o-Y Growth Comparison by AI Rack Density, 2026-2036
- Figure 11: Global Market Attractiveness Analysis by AI Rack Density
- Figure 12: Global Market Value Share and BPS Analysis by Data Center Type, 2026 and 2036
- Figure 13: Global Market Y-o-Y Growth Comparison by Data Center Type, 2026-2036
- Figure 14: Global Market Attractiveness Analysis by Data Center Type
- Figure 15: Global Market Value Share and BPS Analysis by Commercial Model, 2026 and 2036
- Figure 16: Global Market Y-o-Y Growth Comparison by Commercial Model, 2026-2036
- Figure 17: Global Market Attractiveness Analysis by Commercial Model
- Figure 18: Global Market Value (USD Million) Share and BPS Analysis by Region, 2026 and 2036
- Figure 19: Global Market Y-o-Y Growth Comparison by Region, 2026-2036
- Figure 20: Global Market Attractiveness Analysis by Region
- Figure 21: North America Market Incremental Dollar Opportunity, 2026-2036
- Figure 22: Latin America Market Incremental Dollar Opportunity, 2026-2036
- Figure 23: Western Europe Market Incremental Dollar Opportunity, 2026-2036
- Figure 24: Eastern Europe Market Incremental Dollar Opportunity, 2026-2036
- Figure 25: East Asia Market Incremental Dollar Opportunity, 2026-2036
- Figure 26: South Asia and Pacific Market Incremental Dollar Opportunity, 2026-2036
- Figure 27: Middle East and Africa Market Incremental Dollar Opportunity, 2026-2036
- Figure 28: North America Market Value Share and BPS Analysis by Country, 2026 and 2036
- Figure 29: North America Market Value Share and BPS Analysis by Platform Function, 2026 and 2036
- Figure 30: North America Market Y-o-Y Growth Comparison by Platform Function, 2026-2036
- Figure 31: North America Market Attractiveness Analysis by Platform Function
- Figure 32: North America Market Value Share and BPS Analysis by Deployment Model, 2026 and 2036
- Figure 33: North America Market Y-o-Y Growth Comparison by Deployment Model, 2026-2036
- Figure 34: North America Market Attractiveness Analysis by Deployment Model
- Figure 35: North America Market Value Share and BPS Analysis by AI Rack Density, 2026 and 2036
- Figure 36: North America Market Y-o-Y Growth Comparison by AI Rack Density, 2026-2036
- Figure 37: North America Market Attractiveness Analysis by AI Rack Density
- Figure 38: North America Market Value Share and BPS Analysis by Data Center Type, 2026 and 2036
- Figure 39: North America Market Y-o-Y Growth Comparison by Data Center Type, 2026-2036
- Figure 40: North America Market Attractiveness Analysis by Data Center Type
- Figure 41: North America Market Value Share and BPS Analysis by Commercial Model, 2026 and 2036
- Figure 42: North America Market Y-o-Y Growth Comparison by Commercial Model, 2026-2036
- Figure 43: North America Market Attractiveness Analysis by Commercial Model
- Figure 44: Latin America Market Value Share and BPS Analysis by Country, 2026 and 2036
- Figure 45: Latin America Market Value Share and BPS Analysis by Platform Function, 2026 and 2036
- Figure 46: Latin America Market Y-o-Y Growth Comparison by Platform Function, 2026-2036
- Figure 47: Latin America Market Attractiveness Analysis by Platform Function
- Figure 48: Latin America Market Value Share and BPS Analysis by Deployment Model, 2026 and 2036
- Figure 49: Latin America Market Y-o-Y Growth Comparison by Deployment Model, 2026-2036
- Figure 50: Latin America Market Attractiveness Analysis by Deployment Model
- Figure 51: Latin America Market Value Share and BPS Analysis by AI Rack Density, 2026 and 2036
- Figure 52: Latin America Market Y-o-Y Growth Comparison by AI Rack Density, 2026-2036
- Figure 53: Latin America Market Attractiveness Analysis by AI Rack Density
- Figure 54: Latin America Market Value Share and BPS Analysis by Data Center Type, 2026 and 2036
- Figure 55: Latin America Market Y-o-Y Growth Comparison by Data Center Type, 2026-2036
- Figure 56: Latin America Market Attractiveness Analysis by Data Center Type
- Figure 57: Latin America Market Value Share and BPS Analysis by Commercial Model, 2026 and 2036
- Figure 58: Latin America Market Y-o-Y Growth Comparison by Commercial Model, 2026-2036
- Figure 59: Latin America Market Attractiveness Analysis by Commercial Model
- Figure 60: Western Europe Market Value Share and BPS Analysis by Country, 2026 and 2036
- Figure 61: Western Europe Market Value Share and BPS Analysis by Platform Function, 2026 and 2036
- Figure 62: Western Europe Market Y-o-Y Growth Comparison by Platform Function, 2026-2036
- Figure 63: Western Europe Market Attractiveness Analysis by Platform Function
- Figure 64: Western Europe Market Value Share and BPS Analysis by Deployment Model, 2026 and 2036
- Figure 65: Western Europe Market Y-o-Y Growth Comparison by Deployment Model, 2026-2036
- Figure 66: Western Europe Market Attractiveness Analysis by Deployment Model
- Figure 67: Western Europe Market Value Share and BPS Analysis by AI Rack Density, 2026 and 2036
- Figure 68: Western Europe Market Y-o-Y Growth Comparison by AI Rack Density, 2026-2036
- Figure 69: Western Europe Market Attractiveness Analysis by AI Rack Density
- Figure 70: Western Europe Market Value Share and BPS Analysis by Data Center Type, 2026 and 2036
- Figure 71: Western Europe Market Y-o-Y Growth Comparison by Data Center Type, 2026-2036
- Figure 72: Western Europe Market Attractiveness Analysis by Data Center Type
- Figure 73: Western Europe Market Value Share and BPS Analysis by Commercial Model, 2026 and 2036
- Figure 74: Western Europe Market Y-o-Y Growth Comparison by Commercial Model, 2026-2036
- Figure 75: Western Europe Market Attractiveness Analysis by Commercial Model
- Figure 76: Eastern Europe Market Value Share and BPS Analysis by Country, 2026 and 2036
- Figure 77: Eastern Europe Market Value Share and BPS Analysis by Platform Function, 2026 and 2036
- Figure 78: Eastern Europe Market Y-o-Y Growth Comparison by Platform Function, 2026-2036
- Figure 79: Eastern Europe Market Attractiveness Analysis by Platform Function
- Figure 80: Eastern Europe Market Value Share and BPS Analysis by Deployment Model, 2026 and 2036
- Figure 81: Eastern Europe Market Y-o-Y Growth Comparison by Deployment Model, 2026-2036
- Figure 82: Eastern Europe Market Attractiveness Analysis by Deployment Model
- Figure 83: Eastern Europe Market Value Share and BPS Analysis by AI Rack Density, 2026 and 2036
- Figure 84: Eastern Europe Market Y-o-Y Growth Comparison by AI Rack Density, 2026-2036
- Figure 85: Eastern Europe Market Attractiveness Analysis by AI Rack Density
- Figure 86: Eastern Europe Market Value Share and BPS Analysis by Data Center Type, 2026 and 2036
- Figure 87: Eastern Europe Market Y-o-Y Growth Comparison by Data Center Type, 2026-2036
- Figure 88: Eastern Europe Market Attractiveness Analysis by Data Center Type
- Figure 89: Eastern Europe Market Value Share and BPS Analysis by Commercial Model, 2026 and 2036
- Figure 90: Eastern Europe Market Y-o-Y Growth Comparison by Commercial Model, 2026-2036
- Figure 91: Eastern Europe Market Attractiveness Analysis by Commercial Model
- Figure 92: East Asia Market Value Share and BPS Analysis by Country, 2026 and 2036
- Figure 93: East Asia Market Value Share and BPS Analysis by Platform Function, 2026 and 2036
- Figure 94: East Asia Market Y-o-Y Growth Comparison by Platform Function, 2026-2036
- Figure 95: East Asia Market Attractiveness Analysis by Platform Function
- Figure 96: East Asia Market Value Share and BPS Analysis by Deployment Model, 2026 and 2036
- Figure 97: East Asia Market Y-o-Y Growth Comparison by Deployment Model, 2026-2036
- Figure 98: East Asia Market Attractiveness Analysis by Deployment Model
- Figure 99: East Asia Market Value Share and BPS Analysis by AI Rack Density, 2026 and 2036
- Figure 100: East Asia Market Y-o-Y Growth Comparison by AI Rack Density, 2026-2036
- Figure 101: East Asia Market Attractiveness Analysis by AI Rack Density
- Figure 102: East Asia Market Value Share and BPS Analysis by Data Center Type, 2026 and 2036
- Figure 103: East Asia Market Y-o-Y Growth Comparison by Data Center Type, 2026-2036
- Figure 104: East Asia Market Attractiveness Analysis by Data Center Type
- Figure 105: East Asia Market Value Share and BPS Analysis by Commercial Model, 2026 and 2036
- Figure 106: East Asia Market Y-o-Y Growth Comparison by Commercial Model, 2026-2036
- Figure 107: East Asia Market Attractiveness Analysis by Commercial Model
- Figure 108: South Asia and Pacific Market Value Share and BPS Analysis by Country, 2026 and 2036
- Figure 109: South Asia and Pacific Market Value Share and BPS Analysis by Platform Function, 2026 and 2036
- Figure 110: South Asia and Pacific Market Y-o-Y Growth Comparison by Platform Function, 2026-2036
- Figure 111: South Asia and Pacific Market Attractiveness Analysis by Platform Function
- Figure 112: South Asia and Pacific Market Value Share and BPS Analysis by Deployment Model, 2026 and 2036
- Figure 113: South Asia and Pacific Market Y-o-Y Growth Comparison by Deployment Model, 2026-2036
- Figure 114: South Asia and Pacific Market Attractiveness Analysis by Deployment Model
- Figure 115: South Asia and Pacific Market Value Share and BPS Analysis by AI Rack Density, 2026 and 2036
- Figure 116: South Asia and Pacific Market Y-o-Y Growth Comparison by AI Rack Density, 2026-2036
- Figure 117: South Asia and Pacific Market Attractiveness Analysis by AI Rack Density
- Figure 118: South Asia and Pacific Market Value Share and BPS Analysis by Data Center Type, 2026 and 2036
- Figure 119: South Asia and Pacific Market Y-o-Y Growth Comparison by Data Center Type, 2026-2036
- Figure 120: South Asia and Pacific Market Attractiveness Analysis by Data Center Type
- Figure 121: South Asia and Pacific Market Value Share and BPS Analysis by Commercial Model, 2026 and 2036
- Figure 122: South Asia and Pacific Market Y-o-Y Growth Comparison by Commercial Model, 2026-2036
- Figure 123: South Asia and Pacific Market Attractiveness Analysis by Commercial Model
- Figure 124: Middle East and Africa Market Value Share and BPS Analysis by Country, 2026 and 2036
- Figure 125: Middle East and Africa Market Value Share and BPS Analysis by Platform Function, 2026 and 2036
- Figure 126: Middle East and Africa Market Y-o-Y Growth Comparison by Platform Function, 2026-2036
- Figure 127: Middle East and Africa Market Attractiveness Analysis by Platform Function
- Figure 128: Middle East and Africa Market Value Share and BPS Analysis by Deployment Model, 2026 and 2036
- Figure 129: Middle East and Africa Market Y-o-Y Growth Comparison by Deployment Model, 2026-2036
- Figure 130: Middle East and Africa Market Attractiveness Analysis by Deployment Model
- Figure 131: Middle East and Africa Market Value Share and BPS Analysis by AI Rack Density, 2026 and 2036
- Figure 132: Middle East and Africa Market Y-o-Y Growth Comparison by AI Rack Density, 2026-2036
- Figure 133: Middle East and Africa Market Attractiveness Analysis by AI Rack Density
- Figure 134: Middle East and Africa Market Value Share and BPS Analysis by Data Center Type, 2026 and 2036
- Figure 135: Middle East and Africa Market Y-o-Y Growth Comparison by Data Center Type, 2026-2036
- Figure 136: Middle East and Africa Market Attractiveness Analysis by Data Center Type
- Figure 137: Middle East and Africa Market Value Share and BPS Analysis by Commercial Model, 2026 and 2036
- Figure 138: Middle East and Africa Market Y-o-Y Growth Comparison by Commercial Model, 2026-2036
- Figure 139: Middle East and Africa Market Attractiveness Analysis by Commercial Model
- Figure 140: Global Market - Tier Structure Analysis
- Figure 141: Global Market - Company Share Analysis
Frequently Asked Questions
How large is the AI factory capacity orchestration software market in 2026?
The market was valued at USD 398.1 Million in 2025 and is expected to reach USD 441.9 Million in 2026.
What value and CAGR are forecast through 2036?
The market is projected to reach USD 1,254.7 Million by 2036, with an 11.0% CAGR during 2026–2036.
Which platform function segment leads in 2026?
The Monitoring & telemetry segment accounts for 27.0% of platform function in 2026.
Which deployment model segment has the largest share?
The SaaS / public cloud segment accounts for 38.0% of deployment model in 2026.
Which profiled country or market has the fastest forecast growth?
UAE has the highest profiled CAGR at 12.4% during 2026–2036.
Which participants are covered in the competitive assessment?
The assessment covers NVIDIA, including SchedMD, Red Hat, Hewlett Packard Enterprise, IBM and Siemens Digital Industries Software.
Preview the report firsthand - request a free sample
Get SampleGet the brochure for pricing and purchase details.
Get PDF
