
- Market Size (2026)
- USD 3.2 Bn
- Forecast (2036)
- USD 5.7 Bn
- CAGR (2026 to 2036)
- 6.0%
How Big Is the Aluminosilicate Glass Market in 2026?
The global aluminosilicate glass market is valued at USD 3.2 billion in 2026, up from USD 3.0 billion in 2025, and is projected by Future Market Insights (FMI) to reach USD 5.7 billion by 2036, expanding at a 6.0% CAGR to generate USD 2.5 billion in incremental revenue over the forecast decade.
| Market Metric | Valuation / Share / Forecast Benchmark |
|---|---|
| 2025 Market Size (Historical) | USD 3.0 billion |
| 2026 Market Size (Estimated) | USD 3.2 billion |
| 2036 Market Size (Projected) | USD 5.7 billion |
| Compound Annual Growth Rate (2026 to 2036) | 6.0% CAGR |
| Incremental Dollar Opportunity (2026 to 2036) | USD 2.5 billion |
| Dominant Application (2026 to 2036 Share) | Smartphones (62.4% in 2026, easing to 59.8% by 2036) |
| Leading & Fastest-Growing Thickness Bands | 0.5 to 0.7 Mm (46.0% share in 2026; 5.2% CAGR) | Below 0.5 Mm (8.1% CAGR) |
| Leading & Fastest-Growing Glass Types | Sodium Aluminosilicate (46.0% share in 2026; 5.4% CAGR) | Lithium Aluminosilicate (7.3% CAGR) |
| Largest Country Markets (2026 Global Share) | USA (14.0%), Japan (12.0%), South Korea (11.0%) |
| Fastest-Growing Country Markets (2026 to 2036) | Vietnam (7.9% CAGR), USA (5.9% CAGR), South Korea (4.9% CAGR) |
| Leading Tier-1 Companies | Corning, AGC, Nippon Electric Glass, Schott |
Source: Future Market Insights analysis of the aluminosilicate glass market, 2026.
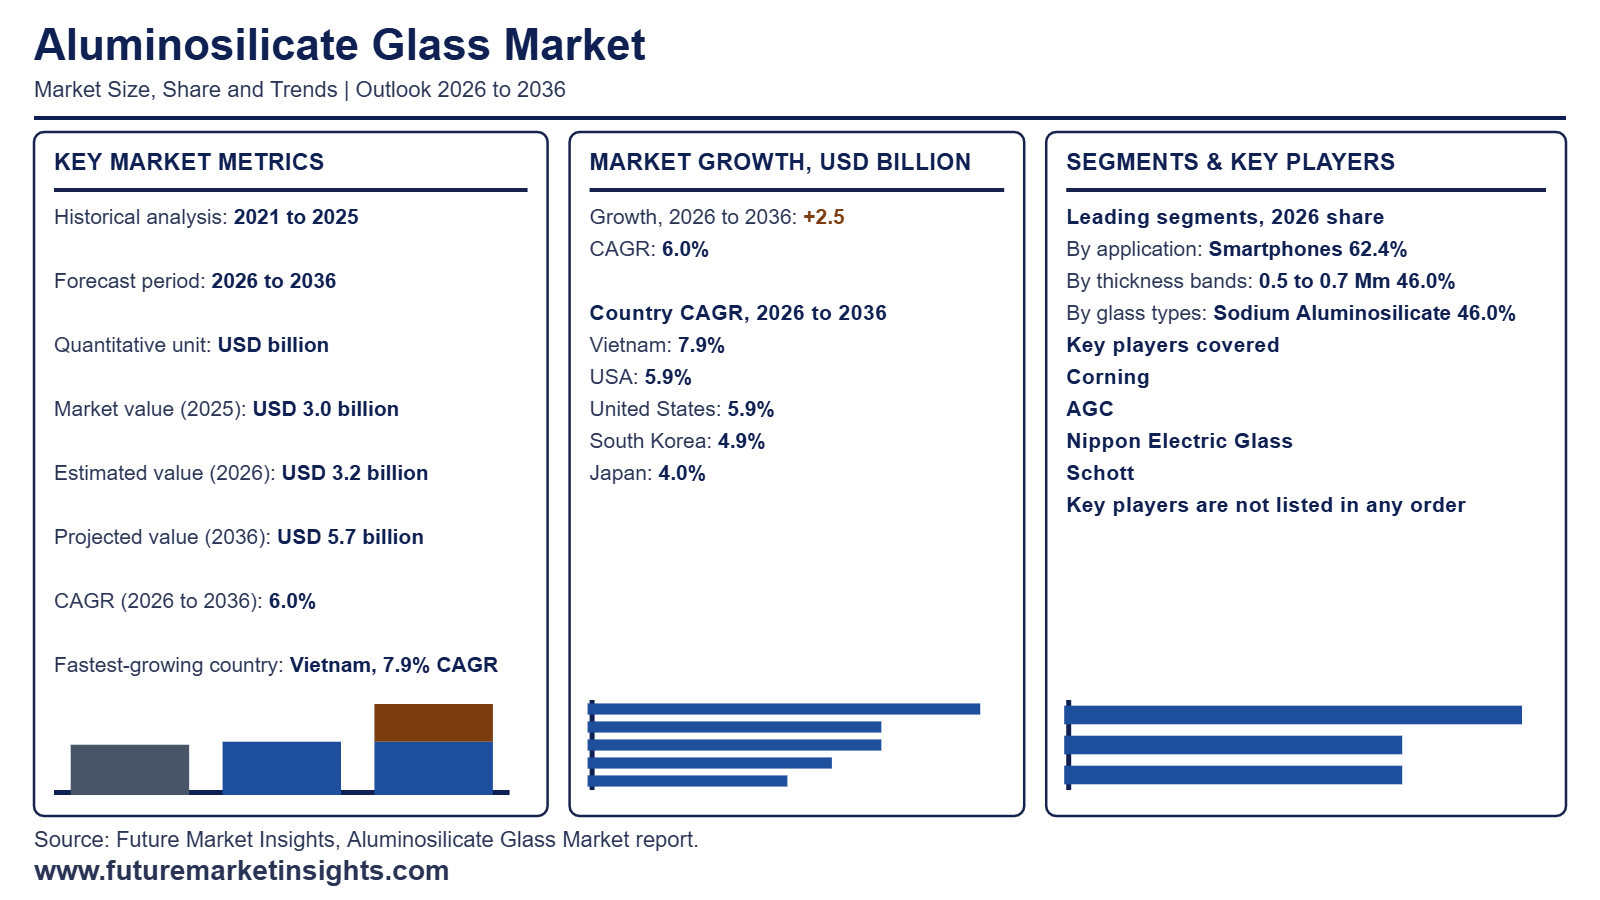
Executive Market Overview
Global demand for aluminosilicate glass rests on its role as the touch-facing cover, a form of scratch-resistant glass, that must survive drops and abrasion, so smartphone OEMs re-qualify and re-source glass with every model refresh, which gives approved suppliers repeat volume. East Asia leads because Japan, South Korea and Taiwan combine glass forming, strengthening and display assembly, while Vietnam is emerging as handset and wearable assembly shifts south. The USA is the largest country market at a 14.0% share on premium handset demand, with Japan at 12.0% and South Korea at 11.0%. Vietnam grows fastest at a 7.9% CAGR, followed by the USA at 5.9% as foldable phones and automotive screens broaden orders.
Price pressure from OEM sourcing teams is the main restraint: thin, ion-exchanged covers lose margin to cutting, edge and strengthening yield, and converters sit between glass makers and brand owners. Producers are responding by moving into ultra-thin glass for foldables, lithium and glass-ceramic compositions that command higher prices, and automotive display units, where longer validation cycles lock in multi-year supply. FMI projects Below 0.5 Mm glass at an 8.1% CAGR and Lithium Aluminosilicate at a 7.3% CAGR, against 6.0% for the market. Market sizing covers aluminosilicate cover glass sold as strengthened or unstrengthened sheet and cut parts, while excluding soda-lime glass, borosilicate, fused silica, sapphire, display substrate glass and finished touch modules.
Analyst Perspective
“Aluminosilicate glass suppliers will grow revenue faster than volume, because smartphone, foldable and automotive display makers pay a premium for drop resistance and thinner, lighter cover glass. The commercial risk is customer concentration, where one flagship design change or a yield problem in thin ion-exchanged sheets can idle capacity for a full product cycle.”
- Nikhil Kaitwade, Principal Consultant, Future Market Insights (FMI)
Major Market Trends and Insights
- Drop Durability Claims Push Premium Glass Chemistries Ahead of Sodium Grades: Handset brands differentiate on durability that buyers can see in drop tests, so premium cover materials command higher content value per device than the sodium aluminosilicate grades that supply mid-range volumes. FMI projects lithium aluminosilicate glass at a 7.3% CAGR against 5.4% for sodium aluminosilicate, which holds a 46.0% share in 2026. Corning (March 2026) launched Gorilla Glass Ceramic 3 and reported, from its lab tests, survival of at least 20 repeated one-meter drops on asphalt, where Corning says a competitive aluminosilicate glass typically failed on the first drop. Motorola's razr fold is the first smartphone available with it. Suppliers without a tough glass-ceramic tier risk losing flagship content to Corning while defending thin mid-range margins.
- U.S. Onshoring Commitments Anchor Domestic Smartphone Glass Capacity: Locking one OEM's entire cover glass volume into a single domestic plant secures utilization for the supplier and leaves rival glassmakers with no iPhone share. Apple (August 2025) committed $2.5 billion so that Corning's Harrodsburg, Kentucky plant makes all iPhone and Apple Watch cover glass, with Corning's Kentucky workforce set to grow 50%. Apple (October 2026) confirmed that by the end of 2026 all iPhone cover glass, including iPhone Duo, will come from that facility. FMI puts the USA at a 14.0% global share in 2026, the largest of any country, and a 5.9% CAGR, second only to Vietnam. Suppliers outside the program must win share from Android OEMs, where pricing leaves less room.
- Vietnam's Assembly Boom Pulls Cover Glass Demand Toward Southeast Asia: Cover glass follows final assembly, so handset output moving to Vietnam shifts where suppliers must hold inventory, finishing lines and technical support. Vietnam Customs data reported by Vietnam News Service (October 2026) show phone and component exports of about $51.8 billion in the first nine months of 2026, up 20% year on year. China, the United States and South Korea took 50.6% of the total. FMI projects Vietnam at a 7.9% CAGR, the fastest of any country, while smartphones, at 62.4% of 2026 demand, ease to 59.8% by 2036 as other devices gain. Glassmakers that place strengthening and finishing capacity near Vietnamese assemblers cut lead times and defend share while smartphone dependence declines.
What Are the Main Drivers, Restraints, and Opportunities?
OEM durability specifications for thin, chemically strengthened covers sustain recurring glass purchases, while price erosion, finishing yield loss and long approval cycles squeeze supplier returns, which leaves local finishing and foldable or automotive cover formats as the selective routes to qualified, higher-value demand.
Driver: OEM Demand for Thin, Chemically Strengthened Display Covers
Brands that want thinner devices without losing drop resistance specify chemically strengthened aluminosilicate covers, a design push that also runs through ultra-thin glass formats. Corning (October 2020) explains that larger potassium ions replace smaller sodium ions in the glass surface and create a compressive stress layer. Corning (June 2024) launched Gorilla Glass 7i for intermediate and value-segment mobile devices, pushing the specification below flagship tiers. Revenue converts only when an OEM approves the cover and the converter holds yield at mass volume. Suppliers with approved midrange programs gain repeat orders.
Restraint: Price Erosion, Finishing Yield Loss and Long Approval Cycles
Cutting, edge polishing, strengthening and coating happen after forming, so late scrap consumes glass and capacity, and price cuts then hit margin twice, a cost structure shared with flexible glass for flexible electronics. AGC (December 2025) decided to exit chemically strengthened specialty glass, citing falling market prices and sluggish order growth. Dragontrail manufacturing at the Takasago Factory is scheduled to end in the third quarter of 2026. Device demand did not disappear; supplier profitability is the constraint. Brands are left with fewer qualified sources, and smaller glass makers carry the price pressure.
Opportunity: Regional Cover Finishing and Differentiated Foldable or Automotive Formats
Finishing close to device assembly shortens logistics and rework loops for brands, and thinner foldable display and automotive covers carry design premiums over standard slab glass. Corning and Optiemus Infracom (June 2024) broke ground on the BIG Tech facility in Tamil Nadu, India's first for finished cover-glass parts. DIGITIMES Asia (December 2025) reports a first-phase capacity of 30 million cover-glass units annually. BIEL Crystal (July 2025) plans 7.5 million automotive cover glass units a year at its Vietnam base. FMI projects foldable-grade cover glass at a 12.4% CAGR and automotive cover glass at 8.1% through 2036. Each OEM still tests bending endurance and surface quality before committing to repeat orders.
How Is the Aluminosilicate Glass Market Segmented?
The global aluminosilicate glass market is segmented by application, thickness, glass type, end-use industry, and region, with all volumes standardized to square meters of finished cover glass.
| Segmentation Axis | Sub-Segments Covered | 2026 Leading Segment & Share | Main Growth Benchmark (2026 to 2036) |
|---|---|---|---|
| Application | Smartphones, Tablets and Laptops, Automotive Displays, Wearables | Smartphones (62.4% revenue share) | Smartphones share eases to 59.8% by 2036; Automotive Displays leads growth at 8.4% CAGR |
| Thickness | 0.5 to 0.7 mm, Below 0.5 mm, 0.7 to 1.1 mm, Above 1.1 mm | 0.5 to 0.7 mm (46.0% revenue share) | Below 0.5 mm (8.1% CAGR) vs. 0.5 to 0.7 mm (5.2% CAGR) |
| Glass Type | Sodium Aluminosilicate, Lithium Aluminosilicate, Mixed Alkali Aluminosilicate, Glass-Ceramic and Specialty Compositions | Sodium Aluminosilicate (46.0% revenue share) | Lithium Aluminosilicate (7.3% CAGR) vs. Sodium Aluminosilicate (5.4% CAGR) |
| End-Use Industry | Consumer Electronics, Automotive, Industrial and Medical Displays | Consumer Electronics (81.3% revenue share) | Automotive leads growth at 8.2% CAGR |
| Region | East Asia, South Asia & Pacific, North America, Europe, Latin America, Middle East & Africa | USA (14.0% global share), followed by Japan (12.0%) and South Korea (11.0%) | South Korea leads national growth at 7.2% CAGR |
Source: Future Market Insights analysis of the aluminosilicate glass market, 2026.
Why Does the Smartphones Segment Lead by Application?
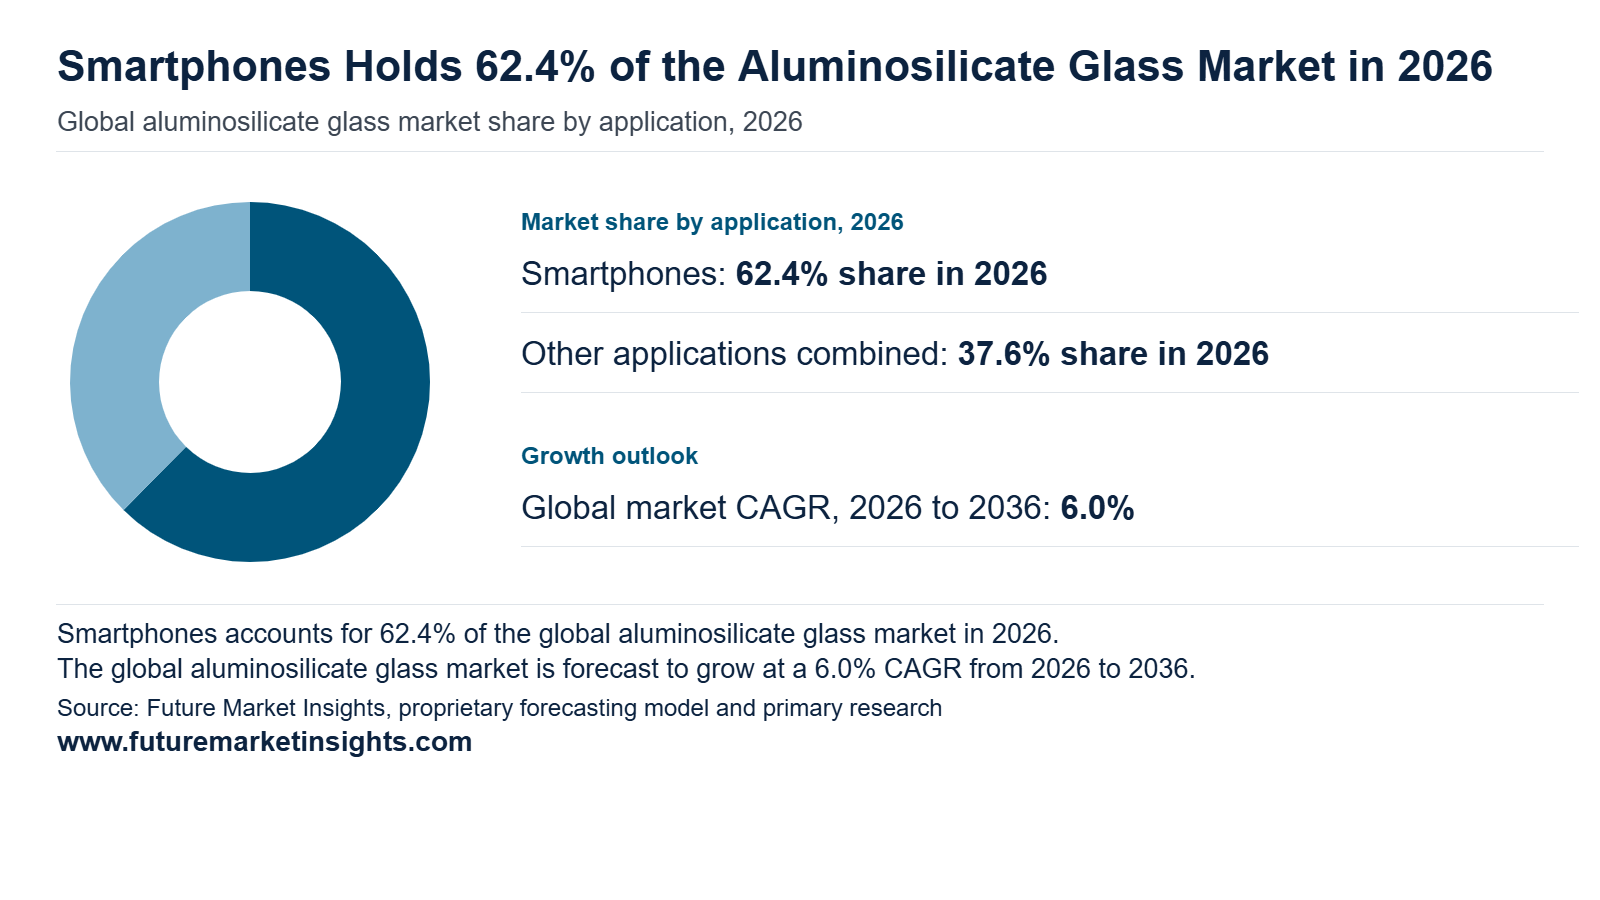
Smartphones hold 62.4% of application revenue in 2026, easing to 59.8% by 2036 at a 5.6% CAGR. Annual model refreshes give approved cover glass repeated entry points into OEM designs, and every handset exposes glass to drops and abrasion that buyers will not trade away on price. Share erodes slowly because foldable phone programs and Automotive Displays, the fastest-growing application at 8.4% CAGR, add more demanding specifications. Nippon Electric Glass (April 2026) reported that Dinorex UTG was adopted in the motorola razr fold, Motorola's first horizontally foldable smartphone, after the razr 50 and razr 60 series.
Why Does the 0.5 to 0.7 mm Segment Lead by Thickness?
The 0.5 to 0.7 mm band holds 46.0% of thickness revenue in 2026, easing to 42.6% by 2036 at a 5.2% CAGR, while Below 0.5 mm grows fastest at 8.1% CAGR. The mid-band balances weight, stress tolerance and edge finishing for rigid covers, so converters keep yields without redesigning handling lines. Thinner glass raises breakage risk in lamination and folding, which limits it to programs that justify the yield loss. Nippon Electric Glass (September 2025) announced that its Dinorex UTG ultra-thin glass for chemical strengthening was adopted for the inner main display cover of the HONOR Magic V Flip2, a foldable use in the ultra-thin glass class rather than this band.
Why Does the Sodium Aluminosilicate Segment Lead by Glass Type?
Sodium Aluminosilicate leads glass type with 46.0% in 2026, easing to 43.5% by 2036 at a 5.4% CAGR, while Lithium Aluminosilicate grows fastest at 7.3% CAGR. Sodium-bearing glass suits potassium-for-sodium ion exchange, so converters get a compressive surface layer on strengthening lines that OEM qualification already accepts. Lithium grades win where drop and scratch targets justify a costlier composition, and mixed-alkali and glass-ceramic grades fill narrower niches. Corning (June 2024) launched Gorilla Glass 7i for intermediate and value-segment mobile devices, claiming better drop and scratch performance than competing lithium aluminosilicate glasses, so scratch-resistant glass pricing is contested below the flagship tier.
Why Does the Consumer Electronics Segment Lead by End-Use Industry?
Consumer Electronics accounts for 81.3% of end-use revenue in 2026, easing to 79.8% by 2036 at a 5.8% CAGR, while Automotive grows fastest at 8.2% CAGR. Handset and portable-device programs bring large recurring volumes with cosmetic and reliability tests, and glass is often bought through an OEM-designated converter, so procurement scale and cadence decide share. Automotive validation runs longer and adds reflection and visibility requirements, so it ramps later. Samsung and Corning (January 2025) announced that the Galaxy S25 Ultra would feature Gorilla Armor 2, the first scratch-resistant, anti-reflective glass ceramic cover material for mobile devices, tying optical and durability specifications into one touch panel design decision.
Aluminosilicate Glass Market by Region and Country (2026 to 2036)
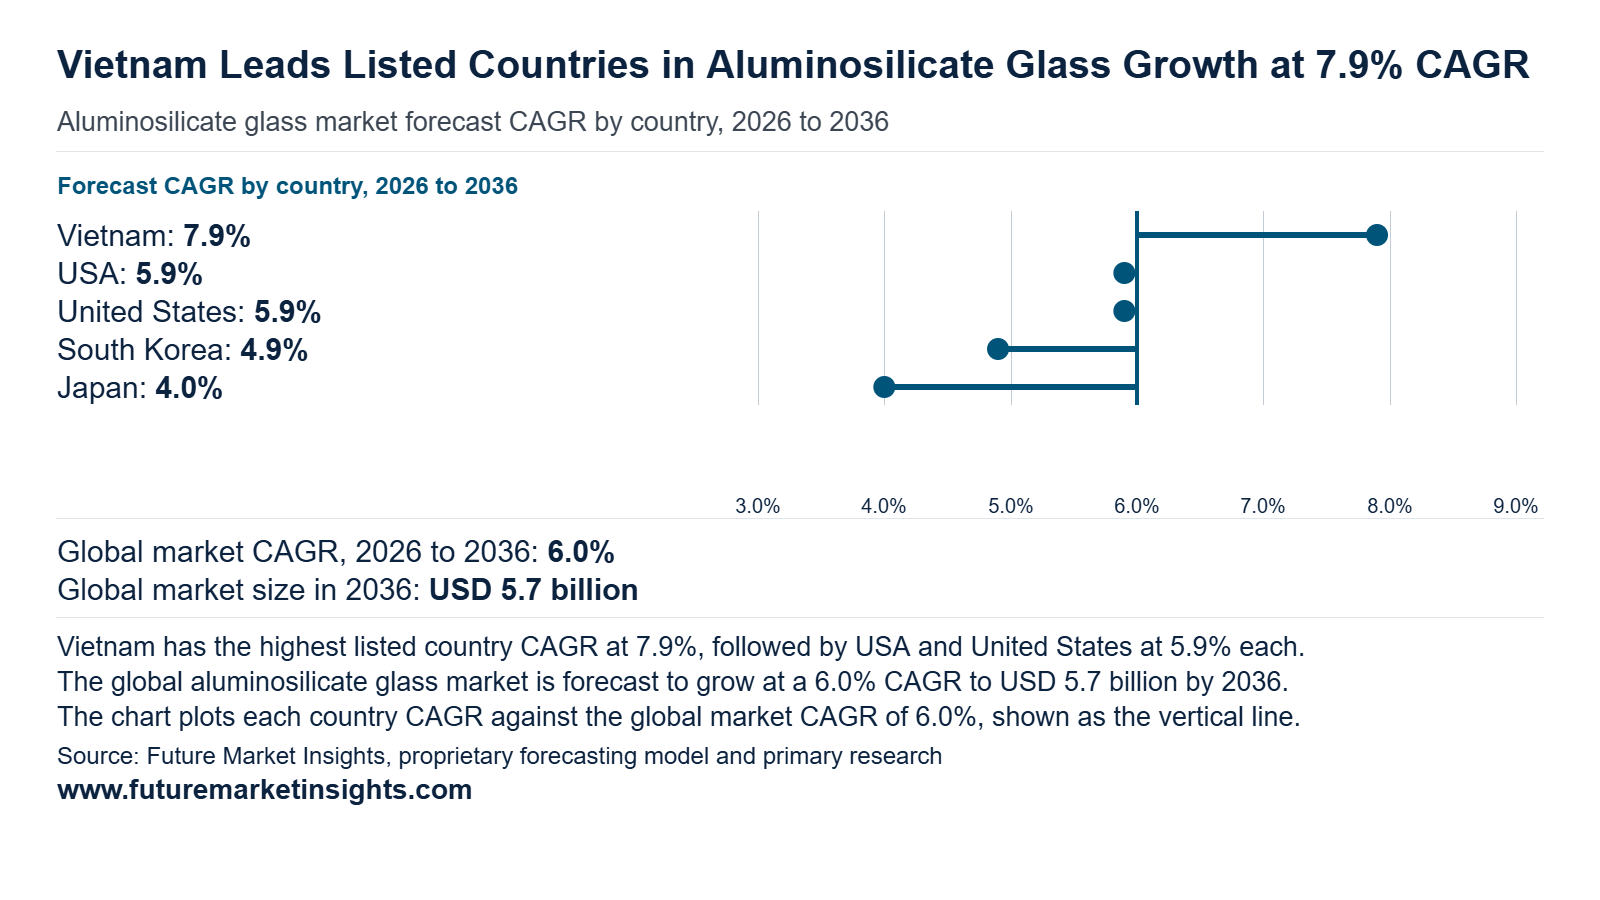
The five tracked countries hold 46.0% of global aluminosilicate glass revenue in 2026, so most demand sits in untracked markets. That untracked share widens from 54.0% to 56.2% by 2036 as the tracked share eases to 43.8%. The United States stays largest, lifting its share from 14.0% to 14.5% and adding USD 271 million. Japan slips from 12.0% to 10.4%. The Vietnam and South Korea cluster grows fastest, rising from USD 325 million to USD 551 million, an addition of USD 226 million.
| Country | 2026 Revenue | 2036 Revenue | 10-Year Addition | 2026 to 2036 CAGR | Global Share (2026 → 2036) |
|---|---|---|---|---|---|
| Vietnam | USD 50 million | USD 107 million | USD 57 million | 7.9% | 2.0% → 2.5% |
| United States | USD 350 million | USD 621 million | USD 271 million | 5.9% | 14.0% → 14.5% |
| South Korea | USD 275 million | USD 444 million | USD 169 million | 4.9% | 11.0% → 10.4% |
| Japan | USD 300 million | USD 444 million | USD 144 million | 4.0% | 12.0% → 10.4% |
| Taiwan | USD 175 million | USD 257 million | USD 82 million | 3.9% | 7.0% → 6.0% |
Source: Future Market Insights analysis of the aluminosilicate glass market, 2026.
United States
The United States grows from USD 350 million in 2026 to USD 621 million in 2036, a 5.9% CAGR and USD 271 million of addition, a 1.77-fold expansion. Its share rises from 14.0% to 14.5% as smartphone cover glass production localizes. Apple committed $2.5 billion to make all iPhone and Apple Watch cover glass at Corning's Harrodsburg, Kentucky facility (Apple Newsroom, August 2025). By the end of 2026, all cover glass for iPhone and Apple Watch sold worldwide is to be produced there (Apple Newsroom, October 2026). A single dedicated line concentrates domestic volume with one supplier, so growth depends on Apple's cycle.
Japan
Japan grows from USD 300 million to USD 444 million, a 4.0% CAGR and USD 144 million of addition, a 1.48-fold gain. Its share declines from 12.0% to 10.4%, the steepest loss among the tracked countries. Domestic supply is thinning. AGC will exit chemically strengthened specialty glass (Dragontrail), ending manufacturing at its Takasago factory in the third quarter of 2026, citing lower market prices and weak order growth (AGC Inc., December 2025). The exit leaves fewer qualified sources, so Japanese device makers must rebalance sourcing toward remaining suppliers.
South Korea
South Korea rises from USD 275 million to USD 444 million, a 4.9% CAGR and USD 169 million of addition, a 1.61-fold expansion. Its share eases from 11.0% to 10.4%. Foldable displays anchor demand, since Samsung Display commercialized ultra-thin glass cover windows only 30 µm thick for foldables (Samsung Newsroom, February 2020). Its dual-folding TriFold panel measures 0.44 mm and withstood 500,000 folds (Samsung Display, April 2026). Thinner stacks raise glass quality requirements per panel, which favors suppliers with strengthening know-how over commodity producers.
Taiwan
Taiwan grows from USD 175 million to USD 257 million, the lowest CAGR at 3.9%, with USD 82 million of addition and a 1.47-fold gain. Its share narrows from 7.0% to 6.0%. Panel makers drive consumption, and their sales are flat. AUO's 2025 consolidated revenue was NT$281.39 billion, up only 0.4% year over year (AUO Corporation, January 2026). Without volume growth at the panel level, glass demand rises mainly through higher-value specifications. Suppliers compete on strengthened and thinner grades, not on tonnage.
Vietnam
Vietnam posts the fastest CAGR at 7.9%, rising from USD 50 million to USD 107 million, an addition of USD 57 million and a 2.14-fold expansion. Its share grows from 2.0% to 2.5%, the largest relative gain in the set. Handset assembly scale pulls glass demand. Samsung Vietnam recorded USD31.8 billion in revenue in the first half of 2025, including US$28 billion in exports (Vietnam Government News, August 2025). The government is pressing for more localization, so on-site finishing and processing capacity is the likely entry point for glass suppliers.
Competitive Environment and Notable Companies
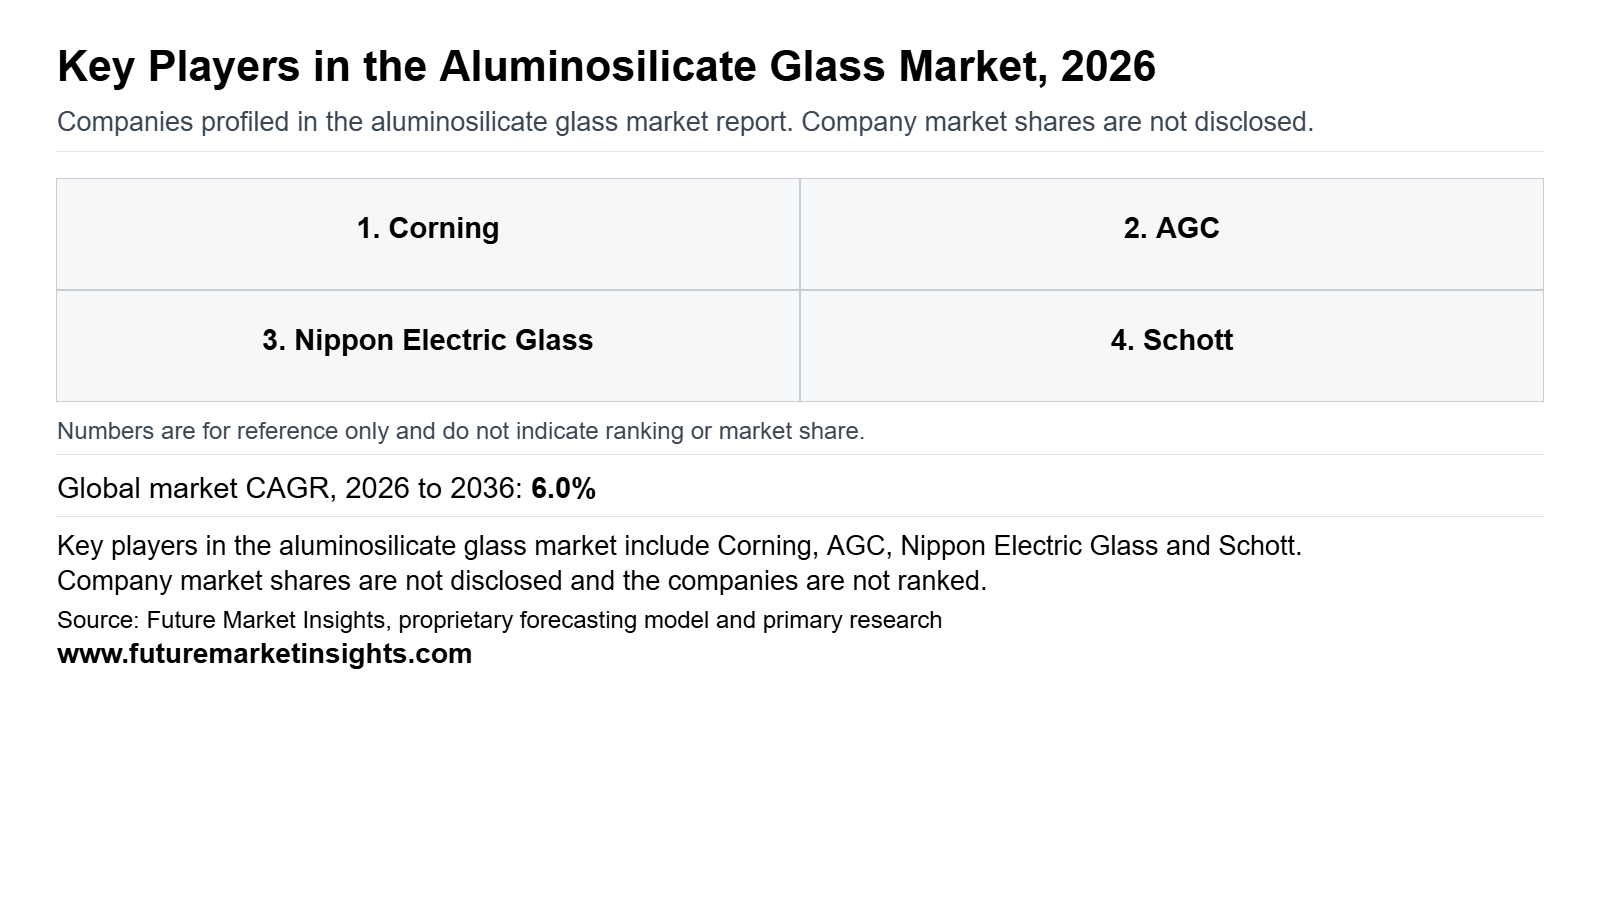
Notable companies operating in the global aluminosilicate glass market include Corning, AGC, Nippon Electric Glass, Schott, Lens Technology, and Biel Crystal Manufactory. Competition spans two linked transactions: supply of a strengthenable glass material and fabrication of an accepted cover component. Strengthenable glass formulators (Corning, AGC, Nippon Electric Glass, Schott) compete on composition, thickness and drop or bend performance, while Lens Technology and Biel Crystal Manufactory compete on finishing, coatings and module integration. Because device OEMs qualify both the recipe and the final-part process, AGC's Dragontrail exit and Corning's glass-ceramic launch are reshaping requalification plans.
How Are Companies Positioned in the Aluminosilicate Glass Market?
Positioning follows where a company sits between raw glass and finished cover. AGC announced on December 8, 2025 that it would exit chemically strengthened specialty glass, with Takasago production ending in the third quarter of 2026 (AGC, December 2025). Corning launched Gorilla Glass Ceramic 3 on March 2, 2026, with Motorola's razr fold as the first device (Corning, March 2026). Nippon Electric Glass confirmed Dinorex UTG in the razr fold inner display on April 9, 2026 (Nippon Electric Glass, April 2026). Lens Technology's first-half 2026 revenue fell 12.4% to RMB 28.9 billion (The Bamboo Works, August 2026).
What Matters When a Buyer Selects an Aluminosilicate Glass Supplier?
Buyers weigh supply continuity and qualification effort alongside strength. AGC cited falling market prices and sluggish order growth, concluding that profitability would be difficult to recover (AGC, December 2025), so Dragontrail users must requalify elsewhere. In Corning's repeated-drop test on asphalt-simulating surfaces, a competitive aluminosilicate glass typically failed on the first drop, while Gorilla Glass Ceramic 3 survived at least 20 one-meter drops (Corning, March 2026). These are company laboratory results, so OEMs should validate them on their own stack-ups and processing lines.
Which Capabilities Distinguish Product Offers?
Offers differ on thickness, flexibility and finishing. Nippon Electric Glass states that Dinorex UTG bends to a 1.5 mm radius (Nippon Electric Glass, April 2026). Schott's Xensation Core datasheet reports about 87% survival versus 7% for lithium aluminosilicate glass in its own sandpaper drop test, with sheets supplied at 1150 by 950 mm (SCHOTT, July 2022); it is a dated company claim. Biel Crystal Manufactory's Haiphong line will make automotive cover glass and complete smart cockpit display modules from 2026 (Biel Crystal, November 2025).
How Does Geographic Reach Affect Competition?
Reach depends on where processing sits. Biel Crystal Manufactory's Haiphong line already holds project nominations from automotive clients in Europe, the US, Japan and Korea (Biel Crystal, November 2025). Lens Technology cited Vietnam's zero-tariff exports to the US and Thailand's electric-vehicle incentives as tariff-risk mitigants (Lens Technology, August 2025). Nippon Electric Glass has placed Dinorex UTG in Motorola's razr 50, razr 60 and razr fold, and also in the HONOR Magic V Flip2 and Xiaomi MIX Flip 2 (Nippon Electric Glass, April 2026).
| Verified Company Evidence (2026) | Commercial Effect | Buyer Action |
|---|---|---|
| December 8, 2025: AGC announced its exit from specialty glass for chemical strengthening (the Dragontrail series), citing falling prices and sluggish order growth, with Takasago production scheduled to end in the third quarter of 2026 (AGC, December 2025). | Removes a float-process aluminosilicate source for smartphones and tablets; the announcement does not say how existing customers will be supplied. | Confirm last-time-buy terms and start requalification with an alternate glass source. |
| March 2, 2026: Corning launched Gorilla Glass Ceramic 3, which survived drops of more than two meters onto concrete-replicating surfaces in Corning laboratory tests, with Motorola's razr fold as the first device (Corning, March 2026). | Shows glass-ceramic substituting for conventional aluminosilicate on a flagship foldable; it does not mean all glass-ceramic revenue is aluminosilicate. | Benchmark glass-ceramic against current aluminosilicate on your own drop and scratch protocols. |
| April 9, 2026: Nippon Electric Glass announced Dinorex UTG adoption in the inner main display of Motorola's razr fold, after the razr 50 and razr 60 series (Nippon Electric Glass, April 2026). | Repeat OEM selection supports thin-sheet consistency and bending qualification; it does not establish share or handset volume. | Request thickness-uniformity and bend-cycle data before approving a second UTG source. |
Source: Verified corporate disclosures and Future Market Insights analysis, 2026.
| Company | Core Positioning | Verified Activity & Source Attribution |
|---|---|---|
| Corning | Formulated Gorilla Glass and glass-ceramic cover materials | Launched Gorilla Glass Ceramic 3 in March 2026 with Motorola's razr fold as first device (Corning, March 2026). |
| AGC | Float-process aluminosilicate (Dragontrail); automotive display cover glass | Announced exit from chemically strengthened specialty glass on December 8, 2025 (AGC, December 2025); automotive expertise is not covered by that announcement. |
| Nippon Electric Glass | Dinorex and Dinorex UTG for chemical strengthening | Dinorex UTG adopted in the razr fold inner display in April 2026 (Nippon Electric Glass, April 2026). |
| Schott | Xensation raw cover glass supplied to processors | Positioning only: Xensation Core datasheet with company drop-test claims (SCHOTT, July 2022); no 2026 activity verified. |
| Lens Technology | Integrated precision-cover processing, coatings and module integration | First-half 2026 revenue of RMB 28.9 billion, down 12.4%, and profit of RMB 577 million, down nearly 50% (The Bamboo Works, August 2026). |
| Biel Crystal Manufactory | Finished covers, decoration and specialty coatings | Announced a Haiphong, Vietnam line for automotive cover glass and cockpit modules, slated for 2026 (Biel Crystal, November 2025). |
Source: Verified corporate disclosures and Future Market Insights analysis, 2026.
Aluminosilicate Glass Market Report Scope and Research Methodology
FMI sizes the global aluminosilicate glass market from the revenue earned on aluminosilicate glass sheet and qualifying processed or chemically strengthened glass covers, cross-checked against wider national display cover glass and specialty glass industry totals. Sales into smartphones, tablets and laptops, automotive displays, and wearables anchor the model because they account for the majority of global revenue. Revenue is counted only for the glass component, with downstream devices, complete display systems, unrelated glass chemistries, sapphire, and standalone services excluded, and bundled product revenue recognized only for the relevant glass component. Primary interviews with glass formulators, cover processors, device makers, and procurement teams are combined with desk research on trade data, regulatory publications, standards, and company filings. Thickness, glass type, and end-use estimates are reconciled so that segment and national figures sum to the global market total in every year. Company disclosures are used strictly to verify product positioning, compositions, and processing footprints rather than to estimate proprietary company revenues.
| Coverage Field | Report Scope |
|---|---|
| Market definition | Revenue from aluminosilicate glass sheet and qualifying processed or chemically strengthened glass covers sold into the defined applications. |
| Applications | Smartphones, tablets and laptops, automotive displays, and wearables. |
| Thickness | Below 0.5 mm, 0.5 to 0.7 mm, 0.7 to 1.1 mm, and above 1.1 mm. |
| Glass types | Sodium aluminosilicate, lithium aluminosilicate, mixed alkali aluminosilicate, and glass-ceramic and specialty compositions. |
| End-use industries | Consumer electronics, automotive, and industrial and medical displays. |
| Inclusions | Aluminosilicate-based glass-ceramic variants only. |
| Exclusions | Downstream devices, complete display systems, unrelated glass chemistries, sapphire, and standalone services. |
| Quantitative units | USD billion for value. |
| Value basis | Revenue from sales of the glass component to buyers in each country, with bundled product revenue recognized only for the relevant glass component. |
| Regions covered | North America, Latin America, Western Europe, Eastern Europe, East Asia, South Asia and Pacific, and Middle East and Africa. |
| National coverage | USA, China, South Korea, Vietnam, India, Taiwan, and Japan. |
| Companies covered | Corning, AGC, Nippon Electric Glass, Schott, Lens Technology, and Biel Crystal Manufactory. |
| Forecast period | 2026 to 2036. |
| Approach | Primary and secondary research with market triangulation, followed by data validation against independent indicators to avoid double counting. |
Source: Future Market Insights analysis of the aluminosilicate glass market, 2026.
Research Sources and Bibliography
- AGC (December 2025). Decision to Exit Business in Specialty Glass for Chemical Strengthening. https://www.agc.com/en/news/detail/1210311_2814.html
- Apple (August 2025). Apple and Corning partner to manufacture 100 percent of iPhone and Apple Watch cover glass in Kentucky. https://www.apple.com/newsroom/2025/08/apple-corning-to-manufacture-all-iphone-apple-watch-cover-glass-in-kentucky/
- Apple (October 2026). Apple announces new American Manufacturing Program partners for iPhone Duo and iPhone 18 Pro. https://www.apple.com/newsroom/2026/10/apple-announces-american-manufacturing-program-partners-for-latest-iphone-lineup/
- AUO Corporation (January 2026). December 2025 Revenue Report. https://auo.com/ja-JP/News_Archive/detail/news_MonthlySales_20260109
- The Bamboo Works (August 2026). Lens Technology first-half results. https://thebambooworks.com/?p=66301
- BIEL Crystal (November 2025). Biel Crystal Forges Integrated Future with Pioneering Vietnam Automotive Line. https://kyodonewsprwire.jp/release/202511279938
- BIEL Crystal (July 2025). BIEL Crystal to Commence Operation at Vietnam Hai Duong production base from Q3. https://www.prnewswire.com/apac/news-releases/biel-crystal-to-commence-operation-at-vietnam-hai-duong-production-base-from-q3-302502185.html
- Corning (June 2024). Corning and Optiemus Infracom Break Ground on India’s First Cover-Glass Finishing Facility. https://www.corning.com/in/en/about-us/news-events/news-releases/2024/06/corning-and-optiemus-infracom-break-ground-on-indias-first-cover-glass-finishing-facility.html
- Corning (June 2024). Corning Launches Corning Gorilla Glass 7i, Expanding Portfolio of Durable Cover Glasses. https://www.corning.com/in/en/about-us/news-events/news-releases/2024/06/corning-launches-corning--gorilla--glass-7i--expanding-portfolio.html
- Corning (March 2026). Corning Launches Corning® Gorilla® Glass Ceramic 3 with Enhanced Drop Durability. https://www.corning.com/worldwide/en/about-us/news-events/news-releases/2026/03/corning-launches-corning-gorilla-glass-ceramic-3-with-enhanced-drop-durability.html
- Corning (October 2020). How It Works: Strengthening Glass. https://www.corning.com/worldwide/en/innovation/the-glass-age/science-of-glass/how-it-works-strengthening-glass.html
- DIGITIMES Asia (December 2025). Corning and Optiemus launch Gorilla Glass finishing facility in Tamil Nadu to boost India’s electronics supply chain. https://www.digitimes.com/news/a20251208VL201.html
- Lens Technology (August 2025). Lens Technology 2025 Mid-Term Performance Report. https://vietnamnews.vn/media-outreach/1723980/lens-technology-2025-mid-term-performance-report-ai-and-smart-vehicles-propel-growth-global-expansion-accelerates.html
- Nippon Electric Glass (April 2026). Dinorex UTG Adopted for motorola’s Foldable Smartphone “motorola razr fold”. https://www.neg.co.jp/en/news/20260409.html
- Nippon Electric Glass (September 2025). NEG’s Ultra-thin Glass “Dinorex UTG” Adopted for HONOR’s Foldable Smartphone “Magic V Flip2”. https://www.neg.co.jp/en/news/20250910.html
- Samsung Display (April 2026). Samsung Display’s Dual-Folding TriFold Wins SID ‘Display of the Year’. https://global.samsungdisplay.com/31449
- Samsung Electronics and Corning (January 2025). Samsung Galaxy S25 Ultra Introduces Corning Gorilla Armor 2, the Industry’s First Anti-Reflective Glass Ceramic For Mobile Devices. https://news.samsung.com/global/samsung-galaxy-s25-ultra-introduces-corning-gorilla-armor-2-the-industrys-first-anti-reflective-glass-ceramic-for-mobile-devices
- Samsung Newsroom (February 2020). Samsung Display Introduces Foldable Display with Easily Bendable, Ultra-thin Glass. https://news.samsung.com/us/samsung-utg-glass-foldable-display-easily-bendable-ultra-thin-glass/
- SCHOTT (July 2022). SCHOTT Xensation Core (datasheet). https://media.schott.com/api/public/content/ca522d1ccb51450f883ef715896f921d?v=8ee53595&download=true
- Vietnam Government News (August 2025). Samsung produces 2 billionth mobile phone in Viet Nam. https://en.baochinhphu.vn/samsung-produces-2-billionth-mobile-phone-in-viet-nam-1112508271304324.htm
- Vietnam News Service (October 2026). Mobile phone exports rise 20% to $51.8 billion in first nine months. https://vietnamnews.vn/economy/1801889/mobile-phone-exports-rise-20-to-51-8-billion-in-first-nine-months.html
Table of Content
- Key Takeaways
- Market Size and CAGR
- Top Growth Driver
- Fastest Growing Segment
- Leading Region
- Key Companies
- Emerging Opportunities
- Executive Summary
- Global Market Outlook
- Demand-side Trends
- Supply-side Trends
- Technology Roadmap Analysis
- Analysis and Recommendations
- Analyst Perspective (What is happening? Why now? What should investors know?)
- Key Questions Answered
- How large is the market?
- What is the CAGR?
- What are key trends?
- Which region dominates?
- Who are the leaders?
Read More...
- Market Overview
- Market Coverage / Taxonomy
- Market Definition / Scope / Limitations
- Research Methodology
- Chapter Orientation
- Analytical Lens and Working Hypotheses
- Market Structure, Signals, and Trend Drivers
- Benchmarking and Cross-market Comparability
- Market Sizing, Forecasting, and Opportunity Mapping
- Research Design and Evidence Framework
- Desk Research Programme (Secondary Evidence)
- Expert Input and Fieldwork (Primary Evidence)
- Tooling, Models, and Reference Databases
- Data Engineering and Model Build
- Quality Assurance and Audit Trail
- Market Background
- Market Dynamics (Drivers, Restraints, Opportunity, Trends)
- Scenario Forecast (Optimistic, Likely, Conservative)
- Impact Analysis
- AI Impact
- Sustainability Impact
- Regulatory Impact
- Technology Impact
- Consumer / Buyer Analysis
- Purchase Drivers
- Adoption Barriers
- Buyer Journey
- Opportunity Map Analysis
- Product Life Cycle Analysis
- Supply Chain Analysis
- Investment Feasibility Matrix
- Value Chain Analysis
- PESTLE and Porter's Analysis
- Regulatory Landscape
- Regional Parent Market Outlook
- Production and Consumption Statistics
- Import and Export Statistics
- Global Market Analysis and Forecast, 2021 to 2036
- Historical Market Size Value (USD Million) Analysis, 2021 to 2025
- Current and Future Market Size Value (USD Million) Projections, 2026 to 2036
- Y-o-Y Growth Trend Analysis
- Absolute $ Opportunity Analysis
- Global Market Pricing Analysis, 2021 to 2036
- Global Market Analysis and Forecast, By Application, 2021 to 2036
- Introduction / Key Findings
- Historical Market Size Value (USD Million) Analysis By Application, 2021 to 2025
- Current and Future Market Size Value (USD Million) Analysis and Forecast By Application, 2026 to 2036
- Smartphones
- Tablets and Laptops
- Automotive Displays
- Wearables
- Y-o-Y Growth Trend Analysis By Application, 2021 to 2025
- Absolute $ Opportunity Analysis By Application, 2026 to 2036
- Global Market Analysis and Forecast, By Thickness, 2021 to 2036
- Introduction / Key Findings
- Historical Market Size Value (USD Million) Analysis By Thickness, 2021 to 2025
- Current and Future Market Size Value (USD Million) Analysis and Forecast By Thickness, 2026 to 2036
- 0.5 to 0.7 Mm
- Below 0.5 Mm
- 0.7 to 1.1 Mm
- Above 1.1 Mm
- Y-o-Y Growth Trend Analysis By Thickness, 2021 to 2025
- Absolute $ Opportunity Analysis By Thickness, 2026 to 2036
- Global Market Analysis and Forecast, By Glass Type, 2021 to 2036
- Introduction / Key Findings
- Historical Market Size Value (USD Million) Analysis By Glass Type, 2021 to 2025
- Current and Future Market Size Value (USD Million) Analysis and Forecast By Glass Type, 2026 to 2036
- Sodium Aluminosilicate
- Lithium Aluminosilicate
- Mixed Alkali Aluminosilicate
- Glass-Ceramic and Specialty Compositions
- Y-o-Y Growth Trend Analysis By Glass Type, 2021 to 2025
- Absolute $ Opportunity Analysis By Glass Type, 2026 to 2036
- Global Market Analysis and Forecast, By End-Use Industry, 2021 to 2036
- Introduction / Key Findings
- Historical Market Size Value (USD Million) Analysis By End-Use Industry, 2021 to 2025
- Current and Future Market Size Value (USD Million) Analysis and Forecast By End-Use Industry, 2026 to 2036
- Consumer Electronics
- Automotive
- Industrial and Medical Displays
- Y-o-Y Growth Trend Analysis By End-Use Industry, 2021 to 2025
- Absolute $ Opportunity Analysis By End-Use Industry, 2026 to 2036
- Global Market Analysis and Forecast, By Region, 2021 to 2036
- Introduction
- Historical Market Size Value (USD Million) Analysis By Region, 2021 to 2025
- Current Market Size Value (USD Million) Analysis and Forecast By Region, 2026 to 2036
- North America
- Latin America
- Western Europe
- Eastern Europe
- East Asia
- South Asia and Pacific
- Middle East and Africa
- Market Attractiveness Analysis By Region
- North America Market Analysis and Forecast, By Country, 2021 to 2036
- Historical Market Size Value (USD Million) Trend Analysis By Market Taxonomy, 2021 to 2025
- Market Size Value (USD Million) Forecast By Market Taxonomy, 2026 to 2036
- By Country
- United States
- Canada
- By Application
- By Thickness
- By Glass Type
- By End-Use Industry
- By Country
- Market Attractiveness Analysis
- By Country
- By Application
- By Thickness
- By Glass Type
- By End-Use Industry
- Key Takeaways
- Latin America Market Analysis and Forecast, By Country, 2021 to 2036
- Historical Market Size Value (USD Million) Trend Analysis By Market Taxonomy, 2021 to 2025
- Market Size Value (USD Million) Forecast By Market Taxonomy, 2026 to 2036
- By Country
- Brazil
- Mexico
- Argentina
- Chile
- By Application
- By Thickness
- By Glass Type
- By End-Use Industry
- By Country
- Market Attractiveness Analysis
- By Country
- By Application
- By Thickness
- By Glass Type
- By End-Use Industry
- Key Takeaways
- Western Europe Market Analysis and Forecast, By Country, 2021 to 2036
- Historical Market Size Value (USD Million) Trend Analysis By Market Taxonomy, 2021 to 2025
- Market Size Value (USD Million) Forecast By Market Taxonomy, 2026 to 2036
- By Country
- Germany
- France
- United Kingdom
- Italy
- Spain
- Benelux
- Nordics
- By Application
- By Thickness
- By Glass Type
- By End-Use Industry
- By Country
- Market Attractiveness Analysis
- By Country
- By Application
- By Thickness
- By Glass Type
- By End-Use Industry
- Key Takeaways
- Eastern Europe Market Analysis and Forecast, By Country, 2021 to 2036
- Historical Market Size Value (USD Million) Trend Analysis By Market Taxonomy, 2021 to 2025
- Market Size Value (USD Million) Forecast By Market Taxonomy, 2026 to 2036
- By Country
- Poland
- Czech Republic
- Romania
- Hungary
- By Application
- By Thickness
- By Glass Type
- By End-Use Industry
- By Country
- Market Attractiveness Analysis
- By Country
- By Application
- By Thickness
- By Glass Type
- By End-Use Industry
- Key Takeaways
- East Asia Market Analysis and Forecast, By Country, 2021 to 2036
- Historical Market Size Value (USD Million) Trend Analysis By Market Taxonomy, 2021 to 2025
- Market Size Value (USD Million) Forecast By Market Taxonomy, 2026 to 2036
- By Country
- China
- Japan
- South Korea
- By Application
- By Thickness
- By Glass Type
- By End-Use Industry
- By Country
- Market Attractiveness Analysis
- By Country
- By Application
- By Thickness
- By Glass Type
- By End-Use Industry
- Key Takeaways
- South Asia and Pacific Market Analysis and Forecast, By Country, 2021 to 2036
- Historical Market Size Value (USD Million) Trend Analysis By Market Taxonomy, 2021 to 2025
- Market Size Value (USD Million) Forecast By Market Taxonomy, 2026 to 2036
- By Country
- India
- ASEAN
- Australia and New Zealand
- By Application
- By Thickness
- By Glass Type
- By End-Use Industry
- By Country
- Market Attractiveness Analysis
- By Country
- By Application
- By Thickness
- By Glass Type
- By End-Use Industry
- Key Takeaways
- Middle East and Africa Market Analysis and Forecast, By Country, 2021 to 2036
- Historical Market Size Value (USD Million) Trend Analysis By Market Taxonomy, 2021 to 2025
- Market Size Value (USD Million) Forecast By Market Taxonomy, 2026 to 2036
- By Country
- GCC Countries
- South Africa
- Türkiye
- Israel
- By Application
- By Thickness
- By Glass Type
- By End-Use Industry
- By Country
- Market Attractiveness Analysis
- By Country
- By Application
- By Thickness
- By Glass Type
- By End-Use Industry
- Key Takeaways
- Key Countries Market Analysis
- United States
- Pricing Analysis
- Market Share Analysis, 2025
- By Application
- By Thickness
- By Glass Type
- By End-Use Industry
- Canada
- Pricing Analysis
- Market Share Analysis, 2025
- By Application
- By Thickness
- By Glass Type
- By End-Use Industry
- Brazil
- Pricing Analysis
- Market Share Analysis, 2025
- By Application
- By Thickness
- By Glass Type
- By End-Use Industry
- Mexico
- Pricing Analysis
- Market Share Analysis, 2025
- By Application
- By Thickness
- By Glass Type
- By End-Use Industry
- Argentina
- Pricing Analysis
- Market Share Analysis, 2025
- By Application
- By Thickness
- By Glass Type
- By End-Use Industry
- Chile
- Pricing Analysis
- Market Share Analysis, 2025
- By Application
- By Thickness
- By Glass Type
- By End-Use Industry
- Germany
- Pricing Analysis
- Market Share Analysis, 2025
- By Application
- By Thickness
- By Glass Type
- By End-Use Industry
- France
- Pricing Analysis
- Market Share Analysis, 2025
- By Application
- By Thickness
- By Glass Type
- By End-Use Industry
- United Kingdom
- Pricing Analysis
- Market Share Analysis, 2025
- By Application
- By Thickness
- By Glass Type
- By End-Use Industry
- Italy
- Pricing Analysis
- Market Share Analysis, 2025
- By Application
- By Thickness
- By Glass Type
- By End-Use Industry
- Spain
- Pricing Analysis
- Market Share Analysis, 2025
- By Application
- By Thickness
- By Glass Type
- By End-Use Industry
- Benelux
- Pricing Analysis
- Market Share Analysis, 2025
- By Application
- By Thickness
- By Glass Type
- By End-Use Industry
- Nordics
- Pricing Analysis
- Market Share Analysis, 2025
- By Application
- By Thickness
- By Glass Type
- By End-Use Industry
- Poland
- Pricing Analysis
- Market Share Analysis, 2025
- By Application
- By Thickness
- By Glass Type
- By End-Use Industry
- Czech Republic
- Pricing Analysis
- Market Share Analysis, 2025
- By Application
- By Thickness
- By Glass Type
- By End-Use Industry
- Romania
- Pricing Analysis
- Market Share Analysis, 2025
- By Application
- By Thickness
- By Glass Type
- By End-Use Industry
- Hungary
- Pricing Analysis
- Market Share Analysis, 2025
- By Application
- By Thickness
- By Glass Type
- By End-Use Industry
- China
- Pricing Analysis
- Market Share Analysis, 2025
- By Application
- By Thickness
- By Glass Type
- By End-Use Industry
- Japan
- Pricing Analysis
- Market Share Analysis, 2025
- By Application
- By Thickness
- By Glass Type
- By End-Use Industry
- South Korea
- Pricing Analysis
- Market Share Analysis, 2025
- By Application
- By Thickness
- By Glass Type
- By End-Use Industry
- India
- Pricing Analysis
- Market Share Analysis, 2025
- By Application
- By Thickness
- By Glass Type
- By End-Use Industry
- ASEAN
- Pricing Analysis
- Market Share Analysis, 2025
- By Application
- By Thickness
- By Glass Type
- By End-Use Industry
- Australia and New Zealand
- Pricing Analysis
- Market Share Analysis, 2025
- By Application
- By Thickness
- By Glass Type
- By End-Use Industry
- GCC Countries
- Pricing Analysis
- Market Share Analysis, 2025
- By Application
- By Thickness
- By Glass Type
- By End-Use Industry
- South Africa
- Pricing Analysis
- Market Share Analysis, 2025
- By Application
- By Thickness
- By Glass Type
- By End-Use Industry
- Türkiye
- Pricing Analysis
- Market Share Analysis, 2025
- By Application
- By Thickness
- By Glass Type
- By End-Use Industry
- Israel
- Pricing Analysis
- Market Share Analysis, 2025
- By Application
- By Thickness
- By Glass Type
- By End-Use Industry
- United States
- Market Structure Analysis
- Competition Dashboard
- Competition Benchmarking
- Market Share Analysis of Top Players
- By Region
- By Application
- By Thickness
- By Glass Type
- By End-Use Industry
- Emerging Startups
- Innovation Benchmarking
- Competition Analysis
- Competition Deep Dive
- Corning
- Overview
- Product Portfolio
- Profitability by Market Segments
- Sales Footprint
- Strategy Overview
- Marketing Strategy
- Product Strategy
- Channel Strategy
- AGC
- Nippon Electric Glass
- Schott
- Lens Technology
- Biel Crystal Manufactory
- Corning
- Case Studies
- Success Stories
- Recent Developments
- Competition Deep Dive
- Assumptions & Acronyms Used
List of Tables
- Table 1: Global Market Value (USD Million) Forecast by Region, 2021 to 2036
- Table 2: Global Market Value (USD Million) Forecast by Application, 2021 to 2036
- Table 3: Global Market Value (USD Million) Forecast by Thickness, 2021 to 2036
- Table 4: Global Market Value (USD Million) Forecast by Glass Type, 2021 to 2036
- Table 5: Global Market Value (USD Million) Forecast by End-Use Industry, 2021 to 2036
- Table 6: North America Market Value (USD Million) Forecast by Country, 2021 to 2036
- Table 7: North America Market Value (USD Million) Forecast by Application, 2021 to 2036
- Table 8: North America Market Value (USD Million) Forecast by Thickness, 2021 to 2036
- Table 9: North America Market Value (USD Million) Forecast by Glass Type, 2021 to 2036
- Table 10: North America Market Value (USD Million) Forecast by End-Use Industry, 2021 to 2036
- Table 11: Latin America Market Value (USD Million) Forecast by Country, 2021 to 2036
- Table 12: Latin America Market Value (USD Million) Forecast by Application, 2021 to 2036
- Table 13: Latin America Market Value (USD Million) Forecast by Thickness, 2021 to 2036
- Table 14: Latin America Market Value (USD Million) Forecast by Glass Type, 2021 to 2036
- Table 15: Latin America Market Value (USD Million) Forecast by End-Use Industry, 2021 to 2036
- Table 16: Western Europe Market Value (USD Million) Forecast by Country, 2021 to 2036
- Table 17: Western Europe Market Value (USD Million) Forecast by Application, 2021 to 2036
- Table 18: Western Europe Market Value (USD Million) Forecast by Thickness, 2021 to 2036
- Table 19: Western Europe Market Value (USD Million) Forecast by Glass Type, 2021 to 2036
- Table 20: Western Europe Market Value (USD Million) Forecast by End-Use Industry, 2021 to 2036
- Table 21: Eastern Europe Market Value (USD Million) Forecast by Country, 2021 to 2036
- Table 22: Eastern Europe Market Value (USD Million) Forecast by Application, 2021 to 2036
- Table 23: Eastern Europe Market Value (USD Million) Forecast by Thickness, 2021 to 2036
- Table 24: Eastern Europe Market Value (USD Million) Forecast by Glass Type, 2021 to 2036
- Table 25: Eastern Europe Market Value (USD Million) Forecast by End-Use Industry, 2021 to 2036
- Table 26: East Asia Market Value (USD Million) Forecast by Country, 2021 to 2036
- Table 27: East Asia Market Value (USD Million) Forecast by Application, 2021 to 2036
- Table 28: East Asia Market Value (USD Million) Forecast by Thickness, 2021 to 2036
- Table 29: East Asia Market Value (USD Million) Forecast by Glass Type, 2021 to 2036
- Table 30: East Asia Market Value (USD Million) Forecast by End-Use Industry, 2021 to 2036
- Table 31: South Asia and Pacific Market Value (USD Million) Forecast by Country, 2021 to 2036
- Table 32: South Asia and Pacific Market Value (USD Million) Forecast by Application, 2021 to 2036
- Table 33: South Asia and Pacific Market Value (USD Million) Forecast by Thickness, 2021 to 2036
- Table 34: South Asia and Pacific Market Value (USD Million) Forecast by Glass Type, 2021 to 2036
- Table 35: South Asia and Pacific Market Value (USD Million) Forecast by End-Use Industry, 2021 to 2036
- Table 36: Middle East and Africa Market Value (USD Million) Forecast by Country, 2021 to 2036
- Table 37: Middle East and Africa Market Value (USD Million) Forecast by Application, 2021 to 2036
- Table 38: Middle East and Africa Market Value (USD Million) Forecast by Thickness, 2021 to 2036
- Table 39: Middle East and Africa Market Value (USD Million) Forecast by Glass Type, 2021 to 2036
- Table 40: Middle East and Africa Market Value (USD Million) Forecast by End-Use Industry, 2021 to 2036
List of Figures
- Figure 1: Global Market Pricing Analysis
- Figure 2: Global Market Value (USD Million) Forecast 2021-2036
- Figure 3: Global Market Value Share and BPS Analysis by Application, 2026 and 2036
- Figure 4: Global Market Y-o-Y Growth Comparison by Application, 2026-2036
- Figure 5: Global Market Attractiveness Analysis by Application
- Figure 6: Global Market Value Share and BPS Analysis by Thickness, 2026 and 2036
- Figure 7: Global Market Y-o-Y Growth Comparison by Thickness, 2026-2036
- Figure 8: Global Market Attractiveness Analysis by Thickness
- Figure 9: Global Market Value Share and BPS Analysis by Glass Type, 2026 and 2036
- Figure 10: Global Market Y-o-Y Growth Comparison by Glass Type, 2026-2036
- Figure 11: Global Market Attractiveness Analysis by Glass Type
- Figure 12: Global Market Value Share and BPS Analysis by End-Use Industry, 2026 and 2036
- Figure 13: Global Market Y-o-Y Growth Comparison by End-Use Industry, 2026-2036
- Figure 14: Global Market Attractiveness Analysis by End-Use Industry
- Figure 15: Global Market Value (USD Million) Share and BPS Analysis by Region, 2026 and 2036
- Figure 16: Global Market Y-o-Y Growth Comparison by Region, 2026-2036
- Figure 17: Global Market Attractiveness Analysis by Region
- Figure 18: North America Market Incremental Dollar Opportunity, 2026-2036
- Figure 19: Latin America Market Incremental Dollar Opportunity, 2026-2036
- Figure 20: Western Europe Market Incremental Dollar Opportunity, 2026-2036
- Figure 21: Eastern Europe Market Incremental Dollar Opportunity, 2026-2036
- Figure 22: East Asia Market Incremental Dollar Opportunity, 2026-2036
- Figure 23: South Asia and Pacific Market Incremental Dollar Opportunity, 2026-2036
- Figure 24: Middle East and Africa Market Incremental Dollar Opportunity, 2026-2036
- Figure 25: North America Market Value Share and BPS Analysis by Country, 2026 and 2036
- Figure 26: North America Market Value Share and BPS Analysis by Application, 2026 and 2036
- Figure 27: North America Market Y-o-Y Growth Comparison by Application, 2026-2036
- Figure 28: North America Market Attractiveness Analysis by Application
- Figure 29: North America Market Value Share and BPS Analysis by Thickness, 2026 and 2036
- Figure 30: North America Market Y-o-Y Growth Comparison by Thickness, 2026-2036
- Figure 31: North America Market Attractiveness Analysis by Thickness
- Figure 32: North America Market Value Share and BPS Analysis by Glass Type, 2026 and 2036
- Figure 33: North America Market Y-o-Y Growth Comparison by Glass Type, 2026-2036
- Figure 34: North America Market Attractiveness Analysis by Glass Type
- Figure 35: North America Market Value Share and BPS Analysis by End-Use Industry, 2026 and 2036
- Figure 36: North America Market Y-o-Y Growth Comparison by End-Use Industry, 2026-2036
- Figure 37: North America Market Attractiveness Analysis by End-Use Industry
- Figure 38: Latin America Market Value Share and BPS Analysis by Country, 2026 and 2036
- Figure 39: Latin America Market Value Share and BPS Analysis by Application, 2026 and 2036
- Figure 40: Latin America Market Y-o-Y Growth Comparison by Application, 2026-2036
- Figure 41: Latin America Market Attractiveness Analysis by Application
- Figure 42: Latin America Market Value Share and BPS Analysis by Thickness, 2026 and 2036
- Figure 43: Latin America Market Y-o-Y Growth Comparison by Thickness, 2026-2036
- Figure 44: Latin America Market Attractiveness Analysis by Thickness
- Figure 45: Latin America Market Value Share and BPS Analysis by Glass Type, 2026 and 2036
- Figure 46: Latin America Market Y-o-Y Growth Comparison by Glass Type, 2026-2036
- Figure 47: Latin America Market Attractiveness Analysis by Glass Type
- Figure 48: Latin America Market Value Share and BPS Analysis by End-Use Industry, 2026 and 2036
- Figure 49: Latin America Market Y-o-Y Growth Comparison by End-Use Industry, 2026-2036
- Figure 50: Latin America Market Attractiveness Analysis by End-Use Industry
- Figure 51: Western Europe Market Value Share and BPS Analysis by Country, 2026 and 2036
- Figure 52: Western Europe Market Value Share and BPS Analysis by Application, 2026 and 2036
- Figure 53: Western Europe Market Y-o-Y Growth Comparison by Application, 2026-2036
- Figure 54: Western Europe Market Attractiveness Analysis by Application
- Figure 55: Western Europe Market Value Share and BPS Analysis by Thickness, 2026 and 2036
- Figure 56: Western Europe Market Y-o-Y Growth Comparison by Thickness, 2026-2036
- Figure 57: Western Europe Market Attractiveness Analysis by Thickness
- Figure 58: Western Europe Market Value Share and BPS Analysis by Glass Type, 2026 and 2036
- Figure 59: Western Europe Market Y-o-Y Growth Comparison by Glass Type, 2026-2036
- Figure 60: Western Europe Market Attractiveness Analysis by Glass Type
- Figure 61: Western Europe Market Value Share and BPS Analysis by End-Use Industry, 2026 and 2036
- Figure 62: Western Europe Market Y-o-Y Growth Comparison by End-Use Industry, 2026-2036
- Figure 63: Western Europe Market Attractiveness Analysis by End-Use Industry
- Figure 64: Eastern Europe Market Value Share and BPS Analysis by Country, 2026 and 2036
- Figure 65: Eastern Europe Market Value Share and BPS Analysis by Application, 2026 and 2036
- Figure 66: Eastern Europe Market Y-o-Y Growth Comparison by Application, 2026-2036
- Figure 67: Eastern Europe Market Attractiveness Analysis by Application
- Figure 68: Eastern Europe Market Value Share and BPS Analysis by Thickness, 2026 and 2036
- Figure 69: Eastern Europe Market Y-o-Y Growth Comparison by Thickness, 2026-2036
- Figure 70: Eastern Europe Market Attractiveness Analysis by Thickness
- Figure 71: Eastern Europe Market Value Share and BPS Analysis by Glass Type, 2026 and 2036
- Figure 72: Eastern Europe Market Y-o-Y Growth Comparison by Glass Type, 2026-2036
- Figure 73: Eastern Europe Market Attractiveness Analysis by Glass Type
- Figure 74: Eastern Europe Market Value Share and BPS Analysis by End-Use Industry, 2026 and 2036
- Figure 75: Eastern Europe Market Y-o-Y Growth Comparison by End-Use Industry, 2026-2036
- Figure 76: Eastern Europe Market Attractiveness Analysis by End-Use Industry
- Figure 77: East Asia Market Value Share and BPS Analysis by Country, 2026 and 2036
- Figure 78: East Asia Market Value Share and BPS Analysis by Application, 2026 and 2036
- Figure 79: East Asia Market Y-o-Y Growth Comparison by Application, 2026-2036
- Figure 80: East Asia Market Attractiveness Analysis by Application
- Figure 81: East Asia Market Value Share and BPS Analysis by Thickness, 2026 and 2036
- Figure 82: East Asia Market Y-o-Y Growth Comparison by Thickness, 2026-2036
- Figure 83: East Asia Market Attractiveness Analysis by Thickness
- Figure 84: East Asia Market Value Share and BPS Analysis by Glass Type, 2026 and 2036
- Figure 85: East Asia Market Y-o-Y Growth Comparison by Glass Type, 2026-2036
- Figure 86: East Asia Market Attractiveness Analysis by Glass Type
- Figure 87: East Asia Market Value Share and BPS Analysis by End-Use Industry, 2026 and 2036
- Figure 88: East Asia Market Y-o-Y Growth Comparison by End-Use Industry, 2026-2036
- Figure 89: East Asia Market Attractiveness Analysis by End-Use Industry
- Figure 90: South Asia and Pacific Market Value Share and BPS Analysis by Country, 2026 and 2036
- Figure 91: South Asia and Pacific Market Value Share and BPS Analysis by Application, 2026 and 2036
- Figure 92: South Asia and Pacific Market Y-o-Y Growth Comparison by Application, 2026-2036
- Figure 93: South Asia and Pacific Market Attractiveness Analysis by Application
- Figure 94: South Asia and Pacific Market Value Share and BPS Analysis by Thickness, 2026 and 2036
- Figure 95: South Asia and Pacific Market Y-o-Y Growth Comparison by Thickness, 2026-2036
- Figure 96: South Asia and Pacific Market Attractiveness Analysis by Thickness
- Figure 97: South Asia and Pacific Market Value Share and BPS Analysis by Glass Type, 2026 and 2036
- Figure 98: South Asia and Pacific Market Y-o-Y Growth Comparison by Glass Type, 2026-2036
- Figure 99: South Asia and Pacific Market Attractiveness Analysis by Glass Type
- Figure 100: South Asia and Pacific Market Value Share and BPS Analysis by End-Use Industry, 2026 and 2036
- Figure 101: South Asia and Pacific Market Y-o-Y Growth Comparison by End-Use Industry, 2026-2036
- Figure 102: South Asia and Pacific Market Attractiveness Analysis by End-Use Industry
- Figure 103: Middle East and Africa Market Value Share and BPS Analysis by Country, 2026 and 2036
- Figure 104: Middle East and Africa Market Value Share and BPS Analysis by Application, 2026 and 2036
- Figure 105: Middle East and Africa Market Y-o-Y Growth Comparison by Application, 2026-2036
- Figure 106: Middle East and Africa Market Attractiveness Analysis by Application
- Figure 107: Middle East and Africa Market Value Share and BPS Analysis by Thickness, 2026 and 2036
- Figure 108: Middle East and Africa Market Y-o-Y Growth Comparison by Thickness, 2026-2036
- Figure 109: Middle East and Africa Market Attractiveness Analysis by Thickness
- Figure 110: Middle East and Africa Market Value Share and BPS Analysis by Glass Type, 2026 and 2036
- Figure 111: Middle East and Africa Market Y-o-Y Growth Comparison by Glass Type, 2026-2036
- Figure 112: Middle East and Africa Market Attractiveness Analysis by Glass Type
- Figure 113: Middle East and Africa Market Value Share and BPS Analysis by End-Use Industry, 2026 and 2036
- Figure 114: Middle East and Africa Market Y-o-Y Growth Comparison by End-Use Industry, 2026-2036
- Figure 115: Middle East and Africa Market Attractiveness Analysis by End-Use Industry
- Figure 116: Global Market - Tier Structure Analysis
- Figure 117: Global Market - Company Share Analysis
Frequently Asked Questions
How big is the Aluminosilicate Glass Market in 2026?
Future Market Insights estimates the global aluminosilicate glass market at USD 3.2 billion in 2026, projected to reach USD 5.7 billion by 2036.
How fast is the Aluminosilicate Glass Market expected to grow through 2036?
FMI projects a 6.0% CAGR from 2026 to 2036, taking the global market from USD 3.2 billion in 2026 to USD 5.7 billion by 2036.
Which application segment leads the Aluminosilicate Glass Market?
Smartphones lead the application segment with a 62.4% share in 2026, driven by the need for impact resistance and optical clarity across frequent mobile device design cycles.
Which thickness band leads the Aluminosilicate Glass Market?
The 0.5 to 0.7 mm thickness band accounts for 46.0% of the market in 2026, reflecting its suitability for conventional rigid smartphone covers and production requirements.
Which countries are expected to grow fastest in the Aluminosilicate Glass Market?
Vietnam is projected to record the fastest growth at a 7.9% CAGR from 2026 to 2036, followed by the United States at 5.9% over the same period.
Which companies are profiled in the Aluminosilicate Glass Market?
The key companies profiled in the aluminosilicate glass market include Corning, AGC, Nippon Electric Glass, Schott, Lens Technology, and Biel Crystal Manufactory. Their market positions span glass chemistry, precision finishing, and automotive component applications.
Preview the report firsthand - request a free sample
Get SampleGet the brochure for pricing and purchase details.
Get PDF
