
- Market Size (2026)
- USD 54.6 Bn
- Forecast (2036)
- USD 110.4 Bn
- CAGR (2026 to 2036)
- 7.3%
How big is the Aromatic Polyesters Market in 2026?
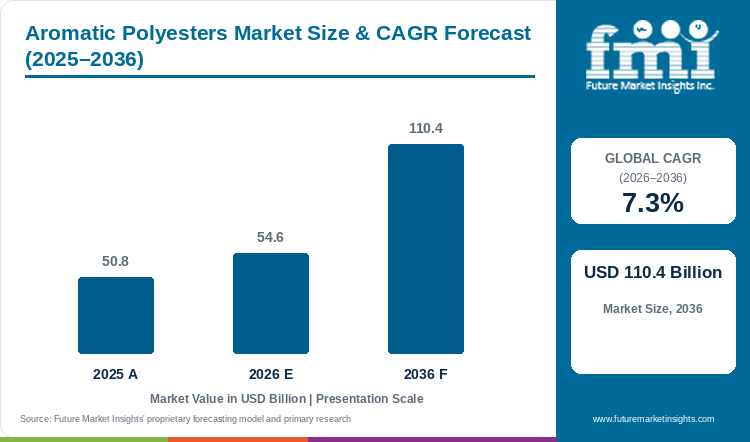
The Aromatic Polyesters Market is projected to reach USD 110.4 billion by 2036, growing at a 7.3% CAGR from 2026 to 2036. The market is estimated at USD 54.6 billion in 2026. The market was valued at USD 50.8 billion in 2025. The largest producer of PET, Indorama Ventures, reported first-half 2026 EBITDA of THB 29.7 billion, up 61%, on 11 August 2026 [1]. Its China integrated PET spread averaged USD 279.0 per tonne in the second quarter, against USD 132.0 a year earlier [1]. Its third-quarter 2026 results briefing is set for 9 November 2026 [19].
Feedstock cost and recycled-content rules set the pace. Indorama Ventures prices its PET margin against the cost of purified terephthalic acid (PTA) and monoethylene glycol. Brent crude averaged USD 97.0 a barrel in the second quarter of 2026, up from USD 68.0 a year earlier [1]. On its second-quarter FY2027 call, held with results dated 30 October 2026, Reliance Industries said paraxylene prices rose 33% and PTA prices 15%. About 32 million tonnes of PTA capacity, roughly 25% of the global total, was affected by the oil turmoil [7]. Directive (EU) 2019/904 requires 25% recycled plastic in PET beverage bottles from 2025 [12].
Key Market Trends & Insights
- On 11 November 2025, Indorama Ventures' Fibers business announced a joint venture with Jiaren Chemical Recycling. It aims to add up to 100,000 tonnes a year of textile-recycled PET spinning capacity. Closing is subject to regulatory approvals [2].
- Fibre makers are adding capacity for differentiated polyester. On 18 May 2026, Teijin Frontier announced new equipment at its Matsuyama Plant for OCTAIR polyester insulation fibre. Production is scheduled to begin in March 2027 and reach about 1,000 tons a year by 2030 [3].
- Chemical restrictions are shaping engineering grades. On 28 September 2026, Teijin added PFAS-free sliding grades of its SOLFIGA PPS compounds. It noted that it already supplies polybutylene naphthalate (PBN) resin as a PFAS-free sliding material [6].
Regional Highlights
- Asia Pacific: the China integrated PET spread rose to USD 279.0 per tonne in the second quarter of 2026. It was USD 176.0 in the first quarter and USD 132.0 a year earlier. It stood at USD 184.0 in July 2026 [1].
- North America: the NAPCOR 2024 PET Recycling Report, dated 10 December 2025, puts the US PET bottle collection rate at 30.2%. The North American rate is 39.2%. Recycled content in US bottles averages 15.9% [14].
- Europe: Directive (EU) 2019/904 sets 25% recycled content for PET beverage bottles from 2025 [12]. Regulation (EU) 2025/40 has applied since 12 August 2026 [13].
Aromatic Polyesters Market Size and Forecast
Table 1: Aromatic Polyesters Market Size and Forecast
| Market size and forecast | Value |
|---|---|
| Market size in 2025 | USD 50.8 billion |
| Estimated market size in 2026 | USD 54.6 billion |
| Projected market size by 2036 | USD 110.4 billion |
| CAGR from 2026 to 2036 | 7.3% |
Source: Future Market Insights analysis of the aromatic polyesters market, 2026.
Analyst Perspective
“Spreads, not volumes, drove the latest earnings in this market. Integrated PET producers gained when supply tightened. Fibre and tyre-cord sellers still face weak orders. Buyers who tie contracts to a visible feedstock reference will handle price swings better than spot buyers. The more durable signals are recycled-content rules in Europe and North America, new chemical-recycling capacity for textiles and PFAS-free engineering grades. Suppliers that can document recycled content and origin will hold their position as these rules take effect.”
- Nikhil Kaitwade, Principal Consultant, FMI
How is the Aromatic Polyesters Market segmented?
- By application: Packaging, Electrical & Electronics, Automotive, Textiles & Technical Fibres and Other Applications
- By region: Asia Pacific, North America and Europe
Why does Packaging lead by Application in the Aromatic Polyesters Market in 2026?
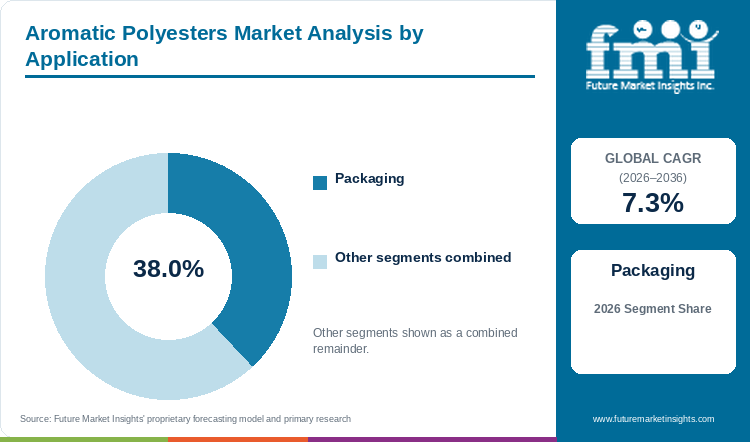
Packaging is estimated to account for 38.0% of the Aromatic Polyesters Market by application in 2026. Indorama Ventures' first-half volumes show the difference in scale between PET and fibres. Its integrated PET business sold 3.85 million tonnes in the first half of 2026, against 0.75 million tonnes in its Fibers business [1]. That integrated business runs from paraxylene and purified terephthalic acid through to PET and recycling. Its Indovida packaging segment, described as having a market-leading position in packaging, sold 0.17 million tonnes in the same half, 10% more than a year earlier [1]. Indovida started a greenfield facility in Tanzania in March 2025 [1]. Recycled-content and collection rules shape bottle demand. Directive (EU) 2019/904 sets a 77% separate collection target for plastic bottles by 2025, rising to 90% by 2029 [12]. Germany has charged a deposit on many one-way PET, glass and metal beverage containers since 2003. The deposit operator says almost 100% of the PET can be kept within a single cycle [18]. In Japan, 580,917 tons of designated PET bottles were sold in 2021 and 546,335 tons were collected, a 94.0% collection rate [17]. The PET Bottle Recycling Council reports a recycling rate of 86.0% for that year [16]. Brand owners are redesigning bottles too. Indorama Ventures reported support for a US concentrate bottle with 20% recycled PET and a 12-month shelf life [1]. The bottle uses oxygen barrier technology from the company's CPET Specialty Polymers unit [1].
Table 2: Application, 2026 Share
| Leading Share | 2026 market share |
|---|---|
| Packaging | 38.0% |
| All Other Segments Combined Share | 62.0% |
Source: Future Market Insights analysis of the aromatic polyesters market, 2026.
What are the key drivers, restraints and opportunities?
Driver
Recycled-content mandates. Packaging demand shifts toward PET that can be collected and reprocessed. Directive (EU) 2019/904 requires 25% recycled plastic in PET beverage bottles from 2025 and 30% in all plastic beverage bottles from 2030 [12]. Regulation (EU) 2025/40 entered into force on 11 February 2025 and has applied since 12 August 2026 [13]. In the United States, NAPCOR reports that the bottle sector consumed about 61% of the recycled PET used in US and Canadian markets in 2024 [14]. Indorama Ventures' recycling vertical delivered a positive EBITDA swing of USD 17.2 million in the first half of 2026 [1].
Performance and fibre upgrades. Producers are moving up the value chain with grades that carry a price premium. BASF's Ultradur RC1 grades serve connectors, electrical housings, gears and structural components. The page describes them as glass-fibre reinforced, with up to 30% post-consumer recycled PET [11]. On 6 April 2026, Teijin Frontier announced a stretch polyester yarn. It says the yarn gives all-polyester fabrics a recovery comparable to polyurethane-based elastic fibres, with sales starting in 2027 [5]. On 2 June 2026, the company announced a polyester textile for thermal apparel, positioned for the fall and winter 2027 season [4].
Restraint
Feedstock and supply shocks. Margins swing with crude oil prices and with disruptions in the paraxylene and PTA chain. Indorama Ventures said earnings are expected to moderate as temporary market tailwinds normalise from the exceptionally strong second quarter. It deliberately cut operating rates from 76% in the first quarter to 74% in the second, to protect margin quality [1]. Reliance management said about 32 million tonnes of PTA capacity was affected by the oil turmoil [7]. Converters that buy PET or fibre at spot prices carry that volatility directly.
Weak fibre and tyre-cord demand. Indorama Ventures' Fibers business ran at a 59% operating rate in the second quarter of 2026, against 71% a year earlier. Its Lifestyle volume fell to 0.44 million tonnes in the first half from 0.56 million tonnes in the first half of 2025, on cautious consumer spending and customer destocking [1]. The same filing says the Mobility vertical faces structural pressure from weaker automotive demand and excess global tyre cord capacity, particularly in China [1]. Reliance management described filament and staple demand as weaker in the quarter to September 2026 [7].
Opportunity
Textile-to-textile recycling. Chemical recycling lets polyester garments return as fibre, not as lower-grade products. Indorama Ventures and Jiaren announced their joint venture on 11 November 2025 [2]. Indorama also showed recycled polyester fibres and filament yarns made from textile waste and PET bottle feedstock at Indo Intertex 2026 in Jakarta and the Textiles Recycling Expo in Brussels [1]. Teijin Frontier says its new thermal textile can be made from recycled polyester [4]. Its stretch yarn lets fabrics be made from 100% polyester, which makes recycling easier [5].
PFAS-free and electronic grades. Customers are looking for sliding and wear materials without intentionally added PFAS. Teijin positions its PBN resin as one answer [6]. Indorama Ventures lists naphthalene dicarboxylate (NDC) among its specialty chemicals for optical displays and industrial and mobility uses [1]. Celanese said on 2 November 2026 that it is beginning commissioning of a liquid crystal polymer production facility in Asia [8].
Aromatic Polyesters Market by Country (2026 to 2036)
Table 3: Aromatic Polyesters Market Country Growth Forecast
| Country | CAGR, 2026 to 2036 |
|---|---|
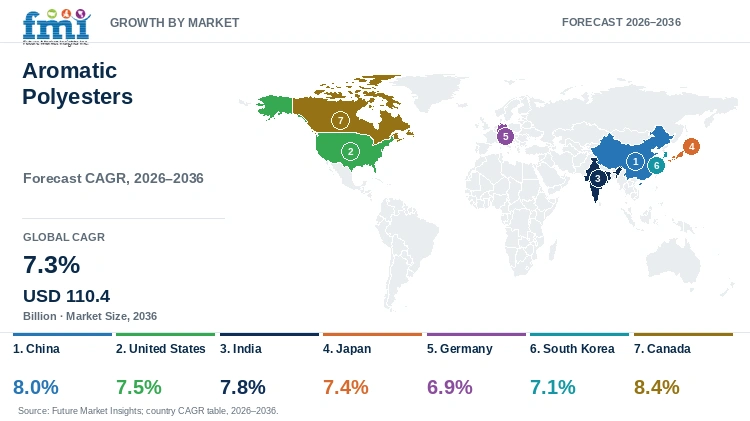
| China | 8.0% |
| United States | 7.5% |
| India | 7.8% |
| Japan | 7.4% |
| Germany | 6.9% |
| South Korea | 7.1% |
| Canada | 8.4% |
Source: Future Market Insights analysis of the aromatic polyesters market, 2026.
China
China sets the benchmark that Indorama Ventures uses for its PET margin. The China integrated PET spread averaged USD 132.0 per tonne in the second quarter of 2025. It was USD 176.0 in the first quarter of 2026 and USD 279.0 in the second quarter of 2026. The company links the rise to tighter industry operating rates, limited new capacity additions and temporary supply disruptions tied to geopolitical events [1]. By July 2026 the spread had eased to USD 184.0 [1].
Fibres and tyre cord have not shared that recovery. The China lifestyle polyester spread was USD 135.0 per tonne in the second quarter of 2025. It was USD 128.0 in both the first and second quarters of 2026, and USD 132.0 in July 2026 [1]. Indorama Ventures names excess global tyre cord capacity, particularly in China, as a pressure on its Mobility business [1]. Packaging PET and fibres follow different price cycles in the country.
Recycling capacity is being built around textiles. The Indorama Ventures and Jiaren joint venture, announced on 11 November 2025, with a dateline in Zhejiang, targets up to 100,000 tonnes a year of textile-recycled PET spinning capacity [2]. Closing depends on regulatory approvals. Jiaren says it is already among the largest PET textile chemical recyclers in the world [2]. Brands that need traceable recycled polyester should track whether the capacity arrives on schedule.
United States
Indorama Ventures says its North American PET margins benefit from full value chain integration linked to shale gas. That integration kept cost inflation muted in the first half of 2026, while crude-related feedstocks rose elsewhere [1]. Its integrated PET business sold 3.85 million tonnes in the half. The company says its local-for-local model let it reallocate production and capture pricing opportunities across regions [1]. For US bottlers, a domestic integrated source reduces exposure to import disruptions.
Recycling is the main policy and supply question. NAPCOR's 2024 PET Recycling Report, dated 10 December 2025, shows a US PET bottle collection rate of 30.2%. That is down from 32.5% in 2023 but above the ten-year average of 29.5% [14]. Average recycled PET content in US bottles was 15.9%, above the prior three-year average of 13.7% [14]. When collection falls short of demand for recycled flake, bottlers compete for the same bales.
Engineering grades are the other US thread. Celanese, headquartered in Irving, Texas, reported third-quarter 2026 net sales of USD 2.6 billion on 2 November 2026 [8]. Its Engineered Materials segment reported USD 1.4 billion of net sales and USD 161.0 million of operating profit [8]. The segment covers more than polyesters, but Celanese lists its Hytrel TPC range among its products [21]. The company also said it is on track to commercialise all three Engineered Materials projects in the first half of 2027 [8].
India
Reliance Industries reported its second-quarter FY2027 results on 30 October 2026. Oil to Chemicals EBITDA was INR 25,203 crore, up about 69%. Management said polyester chain margins rose 33%, led by paraxylene and purified terephthalic acid [7]. The same feedstock-led upswing seen in China shows up in these figures.
Demand was uneven by product. Reliance management said PET was driven mainly by beverage sector demand, while filament and staple demand was weaker. It also said domestic demand in India was strong [7]. The split mirrors packaging's lead in the global application mix. In the same quarter, fibre buyers had more room to negotiate than bottle-resin buyers.
Reliance reports its polyester chain margins together with paraxylene and PTA [7]. Its commentary on the global PTA base matters for Indian converters. It said about 32 million tonnes of PTA capacity, about 25% of global capacity, was affected by the oil turmoil [7]. Buyers on PTA-linked formulas will see that disruption in their prices before they see it in volumes.
Japan
Japanese producers are concentrating on differentiated fibre and resin. On 6 April 2026, Teijin Frontier announced a stretch polyester yarn. Textile sales to domestic and overseas outdoor and sports apparel markets start in 2027, with targets of 100,000 metres in fiscal 2027 and 500,000 metres in fiscal 2029 [5]. On 18 May 2026, the company announced new OCTAIR equipment at Matsuyama, in Ehime Prefecture [3]. The investment was several hundred million yen.
Toray lists PBT resin under the Toraycon name, Lumirror polyester film and polyester fibres among its products [10]. Teijin says it already supplies PBN resin with good sliding properties as a PFAS-free product. It expanded its PFAS-free resin lineup on 28 September 2026 [6]. Teijin's consolidated results for the six months ended 30 September 2026 were published on 5 November 2026 [20].
Collection is a strength of the home market. For 2021 the PET Bottle Recycling Council reports 580,917 tons of designated PET bottles sold, a 94.0% collection rate and an 86.0% recycling rate [16][17]. Collected bottles can feed recycled polyester fibre production. Teijin Frontier says its new thermal textile can be made from recycled polyester [4].
Germany
Germany is a centre for engineering polyesters. BASF markets Ultradur, a partially crystalline PBT, in standard, reinforced, impact-modified and flame-retardant variants [11]. The range also includes an RC1 grade with up to 30% post-consumer recycled PET, an HR grade resistant to hydrolysis and a LUX grade for laser transmission welding [11]. The page names connectors, electrical housings, gears, structural components, eMobility and circuit protection as applications [11].
EU rules set the commercial frame. Directive (EU) 2019/904 requires 25% recycled plastic in PET beverage bottles from 2025, rising to 30% in all plastic beverage bottles from 2030 [12]. The European Commission reports that 42.4% of plastic packaging waste generated in 2024 was recycled [13]. Regulation (EU) 2025/40 has applied since 12 August 2026 [13].
Germany's deposit system gives it a clean PET stream. A deposit has applied to many one-way beverage containers since 2003. The operator DPG says almost 100% of the PET plastic can be kept within a single cycle [18]. Compounders that want recycled PET for PBT-type grades, such as Ultradur RC1, draw on that collection [11][18].
South Korea
Kolon Industries is the clearest verified Korean participant. It says it started its tire cord business in 1973. It calls itself the global number two maker and operates plants in South Korea and Vietnam [9]. The page describes polyester tire cord with high modulus and good heat resistance and adhesion. It also describes a hybrid cord that combines aramid, nylon and polyester for premium original-equipment and electric vehicle tyres [9].
The company describes vertical integration from chip to fabric [9]. That matters because tyre-cord demand is under pressure. Indorama Ventures cites weaker automotive demand and excess global tyre cord capacity, particularly in China [1]. A supplier focused on high-performance and hybrid cords should face less price pressure than commodity cord makers.
A global peer shows the backdrop. Indorama Ventures' Mobility vertical sold 0.10 million tonnes in the first half of 2026, 7% less than in the first half of 2025 [1]. In that setting, a premium hybrid cord for electric vehicle tyres [9] can hold its price. Tyre makers will want qualification data from their own tests before switching suppliers.
Canada
Canada is moving packaging costs onto producers. Ontario's Blue Box programmes shift to the new framework between 1 July 2023 and 31 December 2025. New Brunswick began on 1 November 2023, and Nova Scotia on 1 December 2025. Alberta fully transitioned to extended producer responsibility on 1 October 2026 [15].
Alberta's transition covers 287 communities. Producers now cover about $110.0 million a year in costs previously funded by municipalities and taxpayers [15]. Producers that carry end-of-life costs have a financial reason to specify bottles and trays that are easy to collect and reprocess.
Canada shares its bottle market with the United States. NAPCOR says the bottle sector consumed about 61% of the recycled PET used across US and Canadian markets in 2024 [14]. Indorama Ventures' shale-linked integrated PET platform in North America is one supply route into that market [1]. Canadian bottlers draw on that shared continental pool of recycled PET.
Who are the notable companies in the Aromatic Polyesters Market?
Notable companies in the Aromatic Polyesters Market include Indorama Ventures, Toray Industries, Teijin Group, Reliance Industries and Celanese Corporation.
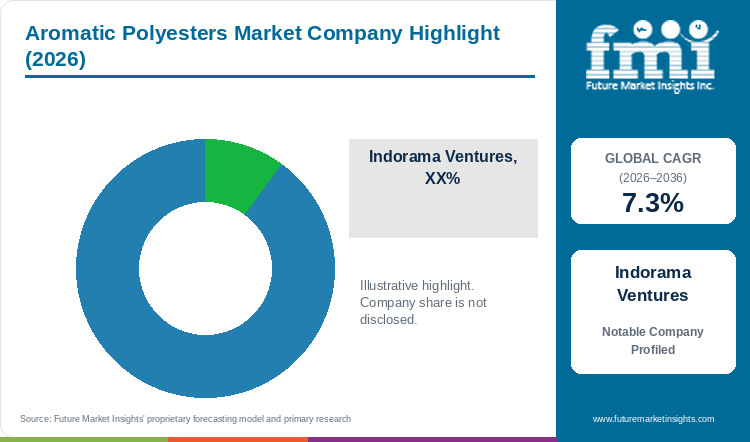
Position in the chain is the clearest difference between suppliers. Indorama Ventures, with an estimated 11.5% of the market in 2026, and Reliance Industries, at 7.8%, report the paraxylene, PTA and polyester stages together. Their earnings therefore follow feedstock spreads and operating rates. Indorama Ventures reported first-half 2026 EBITDA of THB 29.7 billion, with Combined PET contributing THB 19.9 billion [1]. It says its PET premium depends on a local-for-local footprint [1]. Reliance reported polyester chain margins up 33% in the latest quarter, with weaker filament and staple demand [7].
A second group sells grades, not tonnes. Toray Industries (10.1%) lists Toraycon PBT resin, Lumirror polyester film and polyester fibres [10]. Teijin Group (8.9%) supplies PBN resin as a PFAS-free sliding material [6]. Celanese Corporation (6.1%) lists its Hytrel TPC range [21]. It is also commissioning a liquid crystal polymer facility in Asia [8]. BASF sells Ultradur PBT in reinforced, flame-retardant, hydrolysis-resistant and recycled-content variants [11]. These suppliers compete on property data, regulatory documentation and application support.
Fibre and cord sellers compete on specification and recycling. Teijin Frontier is adding OCTAIR insulation fibre capacity, with production scheduled to start in March 2027 [3]. Kolon Industries (5.3%) positions its polyester and hybrid tyre cords on integration and performance [9]. Indorama Ventures' Fibers business runs at lower operating rates than its PET business [1]. It is pursuing portfolio optimisation and textile recycling [1][2].
Key Developments in the Aromatic Polyesters Market
- On 11 August 2026, Indorama Ventures filed its second-quarter 2026 results. It reported first-half EBITDA of THB 29.7 billion, up 61%, and said it is confident of meeting its 2026 estimates [1]. Its third-quarter results briefing is scheduled for 9 November 2026 [19].
- On 18 May 2026, Teijin Frontier announced new equipment at its Matsuyama Plant to expand OCTAIR insulation fibre capacity. Production is scheduled to start in March 2027 [3].
- On 28 September 2026, Teijin added SOLFIGA PPS sliding grades to its PFAS-free high-performance resin lineup. It already supplies PBN resin as a PFAS-free product [6].
- On 2 November 2026, Celanese reported third-quarter results. It said it is beginning commissioning of a liquid crystal polymer facility in Asia. It also said it remains on track to commercialise all three Engineered Materials projects in the first half of 2027 [8].
Key Players in the Aromatic Polyesters Market
- Indorama Ventures
- Toray Industries
- Teijin Group
- Reliance Industries
- Celanese Corporation
- Kolon Industries
- BASF
Aromatic Polyesters Market Report Scope
Table 4: Aromatic Polyesters Market Report Scope
| Coverage field | Report scope |
|---|---|
| Market definition | Aromatic polyesters, including PET, PBT, PTT and PBN resins, polyester fibres and films, and related engineering grades, measured by value of sales to end-use applications |
| Application | Packaging, Electrical & Electronics, Automotive, Textiles & Technical Fibres, Other Applications |
| Regions and profiled countries | Asia Pacific, North America and Europe. Profiled countries: China, United States, India, Japan, Germany, South Korea, Canada |
| Companies covered | Indorama Ventures, Toray Industries, Teijin Group, Reliance Industries, Celanese Corporation, Kolon Industries, BASF |
| Forecast period | 2026 to 2036, with 2025 as the historical base year |
| Quantitative Units | USD billion |
Source: Future Market Insights analysis of the aromatic polyesters market, 2026.
Aromatic Polyesters Market by Segments
Aromatic Polyesters Market segmented by Application:
- Packaging
- Electrical & Electronics
- Automotive
- Textiles & Technical Fibres
- Other Applications
Aromatic Polyesters Market by Region
- Asia Pacific
- North America
- Europe
- China
- United States
- India
- Japan
- Germany
- South Korea
- Canada
Research Sources and Bibliography
- [1] Indorama Ventures Public Company Limited. (2026, August 11). Management Discussion and Analysis, Quarter 2/2026 (submission to the Stock Exchange of Thailand). https://hub.optiwise.io/storage/5/mdna/2026/ivl-mdna-2q2026-en.pdf
- [2] Indorama Ventures Public Company Limited. (2025, November 11). Indorama Ventures Fibers business and Jiaren Chemical Recycling form joint venture to enhance global textile circularity. https://www.indoramaventures.com/en/investor-relations/newsroom/press-releases/2304/indorama-ventures-fibers-business-and-jiaren-chemical-recycling-form-joint-venture-to-enhance-global-textile-circularity
- [3] Teijin Limited. (2026, May 18). Teijin Frontier to Expand Production Capacity for OCTAIR Insulation Fiber at Matsuyama Plant. https://www.teijin.com/news/2026/05/18/20260518_01.pdf
- [4] Teijin Limited. (2026, June 2). Teijin Frontier's New Polyester Fiber-based, Multi-functional Textile. https://www.teijin.com/news/2026/06/02/20260602_01.pdf
- [5] Teijin Limited. (2026, April 6). Teijin Frontier Announces New Stretch Polyester Yarn Offering. https://www.teijin.com/news/2026/04/06/20260406_01.pdf
- [6] Teijin Limited. (2026, September 28). Teijin Expands PFAS-Free High-performance Resin Lineup. https://www.teijin.com/news/2026/09/28/20260928_01.pdf
- [7] Reliance Industries Limited. (2026, October 30). Financial reporting: Q2 FY2026-27 results and earnings call transcript. https://www.ril.com/investors/financial-reporting
- [8] Celanese Corporation. (2026, November 2). Celanese Reports Third Quarter 2026 Results (Form 8-K, Exhibit 99.1). https://www.sec.gov/Archives/edgar/data/1306830/000130683026000129/q320268-kex991.htm
- [9] Kolon Industries, Inc. (n.d.). Tire Cord. https://www.kolonindustries.com/en/product/TIRECORD
- [10] Toray Industries, Inc. (n.d.). Products. https://www.toray.com/global/products/index.html
- [11] BASF SE. (n.d.). Ultradur (PBT). https://plastics-rubber.basf.com/global/en/performance_polymers/products/ultradur
- [12] European Commission. (n.d.). Single-use plastics (Directive (EU) 2019/904). https://environment.ec.europa.eu/topics/plastics/single-use-plastics_en
- [13] European Commission. (n.d.). Packaging waste (Regulation (EU) 2025/40). https://environment.ec.europa.eu/topics/waste-and-recycling/packaging-waste_en
- [14] NAPCOR. (2025, December 10). 2024 PET Recycling Report. https://napcor.com/reports-resources/
- [15] Circular Materials. (n.d.). Extended producer responsibility programmes in Canada. https://www.circularmaterials.ca/
- [16] Council for PET Bottle Recycling. (n.d.). Recycling Rate of PET Bottles. https://www.petbottle-rec.gr.jp/english/actual2.html
- [17] Council for PET Bottle Recycling. (n.d.). Actual Volume of Collected PET Bottles and Collection Rate. https://www.petbottle-rec.gr.jp/english/actual.html
- [18] DPG Deutsche Pfandsystem GmbH. (n.d.). The German deposit system for one-way beverage packaging. https://dpg-pfandsystem.de/index.php/en/
- [19] Indorama Ventures Public Company Limited. (n.d.). Investor relations: latest announcements and upcoming events. https://www.indoramaventures.com/en/investor-relations
- [20] Teijin Limited. (n.d.). News. https://www.teijin.com/news/
- [21] Celanese Corporation. (n.d.). Hytrel TPC. https://www.celanese.com/products/hytrel
Table of Content
Table of Content
- Key Takeaways
- Market Size and CAGR
- Top Growth Driver
- Fastest Growing Segment
- Leading Region
- Key Companies
- Emerging Opportunities
- Executive Summary
- Global Market Outlook
- Demand-side Trends
- Supply-side Trends
- Technology Roadmap Analysis
- Analysis and Recommendations
- Analyst Perspective (What is happening? Why now? What should investors know?)
- Key Questions Answered
- How large is the market?
- What is the CAGR?
- What are key trends?
- Which region dominates?
- Who are the leaders?
Read More...
- Market Overview
- Market Coverage / Taxonomy
- Market Definition / Scope / Limitations
- Research Methodology
- Chapter Orientation
- Analytical Lens and Working Hypotheses
- Market Structure, Signals, and Trend Drivers
- Benchmarking and Cross-market Comparability
- Market Sizing, Forecasting, and Opportunity Mapping
- Research Design and Evidence Framework
- Desk Research Programme (Secondary Evidence)
- Expert Input and Fieldwork (Primary Evidence)
- Tooling, Models, and Reference Databases
- Data Engineering and Model Build
- Quality Assurance and Audit Trail
- Market Background
- Market Dynamics (Drivers, Restraints, Opportunity, Trends)
- Scenario Forecast (Optimistic, Likely, Conservative)
- Impact Analysis
- AI Impact
- Sustainability Impact
- Regulatory Impact
- Technology Impact
- Consumer / Buyer Analysis
- Purchase Drivers
- Adoption Barriers
- Buyer Journey
- Opportunity Map Analysis
- Product Life Cycle Analysis
- Supply Chain Analysis
- Investment Feasibility Matrix
- Value Chain Analysis
- PESTLE and Porter's Analysis
- Regulatory Landscape
- Regional Parent Market Outlook
- Production and Consumption Statistics
- Import and Export Statistics
- Global Market Analysis and Forecast, 2021 to 2036
- Historical Market Size Value (USD Billion) Analysis, 2021 to 2025
- Current and Future Market Size Value (USD Billion) Projections, 2026 to 2036
- Y-o-Y Growth Trend Analysis
- Absolute $ Opportunity Analysis
- Global Market Pricing Analysis, 2021 to 2036
- Global Market Analysis and Forecast, By Application, 2021 to 2036
- Introduction / Key Findings
- Historical Market Size Value (USD Billion) Analysis By Application, 2021 to 2025
- Current and Future Market Size Value (USD Billion) Analysis and Forecast By Application, 2026 to 2036
- Packaging
- Electrical & Electronics
- Automotive
- Textiles & Technical Fibres
- Other Applications
- Y-o-Y Growth Trend Analysis By Application, 2021 to 2025
- Absolute $ Opportunity Analysis By Application, 2026 to 2036
- Global Market Analysis and Forecast, By Region, 2021 to 2036
- Introduction
- Historical Market Size Value (USD Billion) Analysis By Region, 2021 to 2025
- Current Market Size Value (USD Billion) Analysis and Forecast By Region, 2026 to 2036
- Asia Pacific
- North America
- Europe
- Market Attractiveness Analysis By Region
- Asia Pacific Market Analysis and Forecast, By Country
- Historical Market Size Value (USD Billion) Trend Analysis By Market Taxonomy, 2021 to 2025
- Market Size Value (USD Billion) Forecast By Market Taxonomy, 2026 to 2036
- By Country
- By Application
- Market Attractiveness Analysis
- By Country
- By Application
- Key Takeaways
- North America Market Analysis and Forecast, By Country, 2021 to 2036
- Historical Market Size Value (USD Billion) Trend Analysis By Market Taxonomy, 2021 to 2025
- Market Size Value (USD Billion) Forecast By Market Taxonomy, 2026 to 2036
- By Country
- By Application
- Market Attractiveness Analysis
- By Country
- By Application
- Key Takeaways
- Europe Market Analysis and Forecast, By Country
- Historical Market Size Value (USD Billion) Trend Analysis By Market Taxonomy, 2021 to 2025
- Market Size Value (USD Billion) Forecast By Market Taxonomy, 2026 to 2036
- By Country
- China
- United States
- India
- Japan
- Germany
- South Korea
- Canada
- By Application
- By Country
- Market Attractiveness Analysis
- By Country
- By Application
- Key Takeaways
- Key Countries Market Analysis
- United States
- Pricing Analysis
- Market Share Analysis, 2025
- By Application
- Canada
- Pricing Analysis
- Market Share Analysis, 2025
- By Application
- Germany
- Pricing Analysis
- Market Share Analysis, 2025
- By Application
- India
- Pricing Analysis
- Market Share Analysis, 2025
- By Application
- China
- Pricing Analysis
- Market Share Analysis, 2025
- By Application
- Japan
- Pricing Analysis
- Market Share Analysis, 2025
- By Application
- South Korea
- Pricing Analysis
- Market Share Analysis, 2025
- By Application
- United States
- Market Structure Analysis
- Competition Dashboard
- Competition Benchmarking
- Market Share Analysis of Top Players
- By Regional
- By Application
- Emerging Startups
- Innovation Benchmarking
- Competition Analysis
- Competition Deep Dive
- Indorama Ventures
- Overview
- Product Portfolio
- Profitability by Market Segments
- Sales Footprint
- Strategy Overview
- Marketing Strategy
- Product Strategy
- Channel Strategy
- Toray Industries
- Teijin Group
- Reliance Industries
- Celanese Corporation
- Kolon Industries
- BASF
- Indorama Ventures
- Case Studies
- Success Stories
- Recent Developments
- Competition Deep Dive
- Assumptions & Acronyms Used
List of Tables
- Table 1: Global Market Value (USD Billion) Forecast by Region, 2021 to 2036
- Table 2: Global Market Value (USD Billion) Forecast by Application, 2021 to 2036
- Table 3: Asia Pacific Market Value (USD Billion) Forecast by Country, 2021 to 2036
- Table 4: Asia Pacific Market Value (USD Billion) Forecast by Application, 2021 to 2036
- Table 5: North America Market Value (USD Billion) Forecast by Country, 2021 to 2036
- Table 6: North America Market Value (USD Billion) Forecast by Application, 2021 to 2036
- Table 7: Europe Market Value (USD Billion) Forecast by Country, 2021 to 2036
- Table 8: Europe Market Value (USD Billion) Forecast by Application, 2021 to 2036
List of Figures
- Figure 1: Global Market Pricing Analysis
- Figure 2: Global Market Value (USD Billion) Forecast 2021-2036
- Figure 3: Global Market Value Share and BPS Analysis by Application, 2026 and 2036
- Figure 4: Global Market Y-o-Y Growth Comparison by Application, 2026-2036
- Figure 5: Global Market Attractiveness Analysis by Application
- Figure 6: Global Market Value (USD Billion) Share and BPS Analysis by Region, 2026 and 2036
- Figure 7: Global Market Y-o-Y Growth Comparison by Region, 2026-2036
- Figure 8: Global Market Attractiveness Analysis by Region
- Figure 9: Asia Pacific Market Incremental Dollar Opportunity, 2026-2036
- Figure 10: North America Market Incremental Dollar Opportunity, 2026-2036
- Figure 11: Europe Market Incremental Dollar Opportunity, 2026-2036
- Figure 12: Asia Pacific Market Value Share and BPS Analysis by Country, 2026 and 2036
- Figure 13: Asia Pacific Market Value Share and BPS Analysis by Application, 2026 and 2036
- Figure 14: Asia Pacific Market Y-o-Y Growth Comparison by Application, 2026-2036
- Figure 15: Asia Pacific Market Attractiveness Analysis by Application
- Figure 16: North America Market Value Share and BPS Analysis by Country, 2026 and 2036
- Figure 17: North America Market Value Share and BPS Analysis by Application, 2026 and 2036
- Figure 18: North America Market Y-o-Y Growth Comparison by Application, 2026-2036
- Figure 19: North America Market Attractiveness Analysis by Application
- Figure 20: Europe Market Value Share and BPS Analysis by Country, 2026 and 2036
- Figure 21: Europe Market Value Share and BPS Analysis by Application, 2026 and 2036
- Figure 22: Europe Market Y-o-Y Growth Comparison by Application, 2026-2036
- Figure 23: Europe Market Attractiveness Analysis by Application
- Figure 24: Global Market - Tier Structure Analysis
- Figure 25: Global Market - Company Share Analysis
Frequently Asked Questions
How big is the aromatic polyesters market in 2026?
The Aromatic Polyesters Market is estimated at USD 54.6 billion in 2026, up from USD 50.8 billion in 2025. It is projected to reach USD 110.4 billion by 2036, a 7.3% CAGR from 2026 to 2036. Indorama Ventures reported first-half 2026 EBITDA of THB 29.7 billion, up 61% on the year [1].
Which application leads the aromatic polyesters market?
Packaging leads with 38.0% of the market in 2026. Indorama Ventures sold 3.85 million tonnes through its integrated PET business in the first half of 2026 against 0.75 million tonnes in its Fibers business [1]. Directive (EU) 2019/904 requires 25% recycled plastic in PET beverage bottles from 2025 [12].
Which other applications matter?
Electrical & Electronics holds 22.0%, Automotive 16.0%, Textiles & Technical Fibres 13.0% and Other Applications 11.0%. BASF lists Ultradur PBT for connectors and electrical housings [11]. Teijin Frontier is adding OCTAIR polyester fibre capacity, with production scheduled for March 2027 [3]. Kolon Industries sells polyester and hybrid tyre cord [9].
Which profiled country is forecast to grow fastest?
Canada has the highest forecast CAGR of the seven profiled countries, at 8.4% from 2026 to 2036. China is at 8.0% and India at 7.8%. Alberta fully transitioned to extended producer responsibility on 1 October 2026 [15]. The US and Canadian markets share a recycled PET supply, and the bottle sector used about 61% of it in 2024 [14].
What regulation is shaping demand?
In the European Union, Directive (EU) 2019/904 requires 25% recycled plastic in PET beverage bottles from 2025 and 30% in all plastic beverage bottles from 2030 [12]. Regulation (EU) 2025/40 on packaging and packaging waste entered into force on 11 February 2025 and has applied since 12 August 2026 [13].
What should a buyer check when choosing a supplier?
Check the pricing reference first. Indorama Ventures defines its PET spread against PTA and monoethylene glycol cost [1]. Then check recycled content and documentation. BASF's Ultradur RC1 grades contain up to 30% post-consumer recycled PET [11]. Check chemical status too. Teijin offers PBN and PPS sliding grades without intentionally added PFAS [6].
Preview the report firsthand - request a free sample
Get SampleGet the brochure for pricing and purchase details.
Get PDF
