Reports

- Global Locations -

Headquarters

Future Market Insights, Inc.

Christiana Corporate, 200
Continental Drive, Suite 401,
Newark, Delaware - 19713,
United States

T: +1-845-579-5705

Americas

Future Market Insights, Inc.

616 Corporate Way, Suite 2-9018,
Valley Cottage, NY 10989, United States

T: +1-347-918-3531

MEA

Future Market Insights

1602-6 Jumeirah Bay X2 Tower, Plot No: JLT-PH2-X2A,
Jumeirah Lakes Towers, Dubai,
United Arab Emirates

Europe

Future Market Insights

3rd Floor, 207 Regent Street,
W1B 3HH London
United Kingdom

T: + 44 (0) 20 8123 9659
D: +44 (0) 20 3287 4268

Asia Pacific

Future Market Insights

IndiaLand Global Tech Park, Unit UG-1, Behind Grand HighStreet, Phase 1, Hinjawadi, MH, Pune – 411057, India

Arthropod-borne Viral Infections Testing Market Outlook (2022-2029)

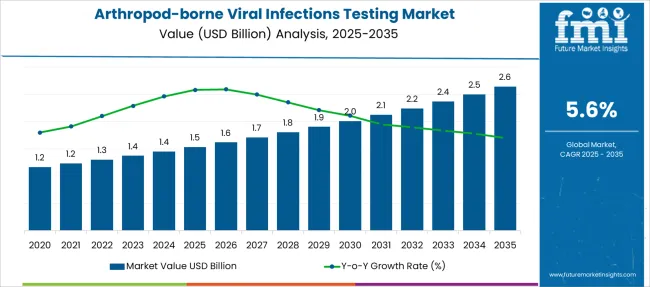
[206 Pages Report] Rising at a CAGR of 5.6% from 2022 to 2029, arthropod-borne viral infections testing demand is estimated to attain a valuation of US$ 1.3 Bn by end of the forecast period. The global Arthropod-Borne Viral Infections Testing Market is worth US$ 1.9 Bn in 2022.

Attribute Details
Arthropod-borne Viral Infections Testing Market Size (2022) US$ 1.3 Bn
Predicted Net Worth (2029) US$ 1.9 Bn
Global Market Growth Metrics (2022-2029) 5.6% CAGR
Market Share of ELISA-based Tests 52%

Arboviral diseases are infections caused by virus spread among humans through the bites of arthropods. Common arthropods through which diseases are spread are mosquitoes and ticks. Arthropod-borne viral infections testing accounts for 4.4% of the global infectious disease diagnostics market, which stood at US$ 28 Bn in 2021.

Don't pay for what you don't need

Customize your report by selecting specific countries or regions and save 30%!

How The Market Progressed Till June 2022?

Particulars Details
H1, 2021 5.64%
H1, 2022 Projected 5.63%
H1, 2022 Outlook 3.83%
BPS Change - H1, 2022 (O) – H1, 2022 (P) (-) 180 ↓
BPS Change – H1, 2022 (O) – H1, 2021 (-) 181 ↓

The variation between the BPS values observed within the arthropod-borne viral infections testing market in H1, 2022 - outlook over H1, 2022 projected reflects a decline by 180 BPS units. Additionally, a value BPS decline in H1-2022 over H1-2021 by 181 Basis Point Share (BPS) is demonstrated by the market.

The market observes a decline in the BPS values owed to the poor accessibility of detection methods in low-income economies with a large disease burden. As a result, high costs of healthcare facilities along with a lack of awareness about infectious diseases are expected to restrain the market's growth.

The market is subjected to several macro economical and industry variables, which include disease epidemiology, biologics licensing, product patenting and distribution licensing. Factors such as climate change, urbanization, and global trade can expand the geographic distribution of vectors and associated arboviruses, thus increasing the potential disease burden in susceptible hosts. This factor can present an opportunity for a positive growth outlook for the market

Demand Analysis of Arthropod-borne Viral Infections Testing (2014 to 2021) Vs Market Metrics (2022 to 2029)

Healthcare has become an area of prime concern across the world and this is due to the rising diseases and infections across the world. There has been a substantial rise in arboviral diseases over the past few years and this has influenced demand for arthropod-borne viral infections testing.

Arthropod-borne viral infections testing demand rose at a CAGR of 4.9% from 2014 to 2021 and ended up with a market worth of US$ 1.2 Bn in 2021.

Most common arthropod-borne viral infection in the world according to WHO (World Health Organization) is dengue, with the potential risk to infect more than 30% of the world’s population.

Rising focus on public healthcare, increasing travel and trade activities on a global scale, changing lifestyle trends, environmental and climatic changes, rapid urbanization across the world, etc. are some major factors that influence arthropod-borne viral infections testing market potential on a global scale.

Arthropod-borne Viral Infections Testing Market

The market for arthropod-borne viral infections testing is anticipated to rise at a CAGR of 5.6% over the forecast period of 2022 to 2029.

Which Factors Favor Arthropod-borne Viral Infections Testing Market Potential?

“Re-emergence of Arthropod-borne Viral Infections to Drive Demand”

Arthropod-borne infections have proven to be responsible for widespread epidemics across the world. Some of the notable arboviral epidemics are of dengue and Zika virus which led to further complications in the population infected.

These epidemics have been dealt with to a certain extent but have proven their re-emergence in recent times which is a major factor that drives demand for arthropod-borne viral infections testing on a global level. The unpredictable nature of these infections promotes arthropod-borne viral infections testing providers to develop better diagnostic solutions to detect and avoid a community spread of these infections.

“Increasing Government Initiatives to Limit Risk of Arboviral Infections”

Governments across the world are working in sync with health organizations to mitigate the risk of arthropod-borne viral infections. As a matter of public safety, the focus on these diseases is increasing in the past few years with severe outbreaks being recorded across the world. The emergence of coronavirus in 2020 has further bolstered the importance of government inclusion in matters of public health.

  • For instance, a pilot program funded by Global Emerging Infectious Surveillance (GEIS) a division of Armed Forces Health Surveillance Branch of the U.S. is set to launch in spring of 2022 to identify emerging infectious diseases and mitigate risk. This is expected to be attained by a global laboratory network that is designed to enhance global health security.

Which Regions Should Arthropod-borne Viral Infections Testing Providers Focus On?

“MEA and Latin America to Provide Major Opportunities for Market Players”

This FMI industry analysis provides metrics for the arthropod-borne viral infections testing market across regions such as North America, Latin America, Europe, East Asia, South Asia & Pacific, and the Middle East & Africa (MEA).

The market for arthropod-borne viral infections testing in Latin America is anticipated to see high demand over the forecast period as it accounts for a notable number of infections across the world.

Developing healthcare infrastructure and rising awareness about arthropod-borne infections is anticipated to influence arthropod-borne viral infections testing demand in this region.

Demand for arthropod-borne viral infections testing in North America is expected to be low as the incidence of arboviral infections and diseases in this region is low. Advanced healthcare infrastructure and proper preventive care reduce the chances of infection in this region.

East Asia and South Asia are expected to see high demand for arthropod-borne viral infections testing over the forecast period. Implementation of stringent regulations to curb the spread of infectious diseases in this region is anticipated to drive market potential in these regions.

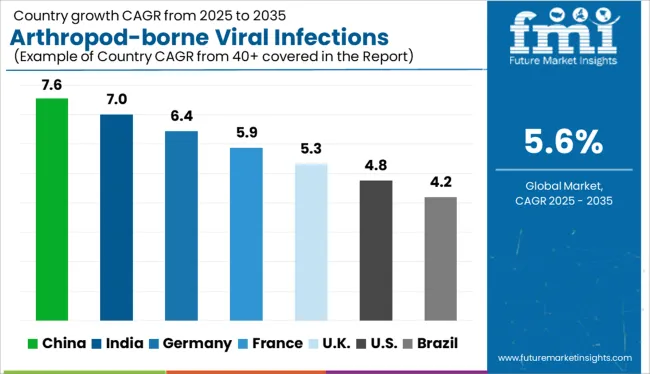
Densely populated countries like India and China are expected to emerge as highly lucrative markets for arthropod-borne viral infections testing vendors.

Rising instances of arboviral infections and epidemics in the MEA region are expected to majorly drive demand for arthropod-borne viral infections testing in this region. This region is expected to be one of the most important markets on a global level owing to the re-emergence of multiple infections like Zika virus and others.

Underdeveloped healthcare infrastructure is a major restraining factor for arthropod-borne viral infections testing market in the MEA region.
Sabyasachi Ghosh
Sabyasachi Ghosh

Principal Consultant

Talk to Analyst

Find your sweet spots for generating winning opportunities in this market.

Country-wise Analysis

Why is the U.K. a Lucrative Market for Arthropod-borne Viral Infections Testing Providers?

“Increasing Threat of Arboviral Infections Augmenting Market Expansion”

Instances of arthropod-borne viral infections have been increasing in the U.K. in recent times and this is anticipated to drive arthropod-borne viral infections testing demand in the nation. Lyme disease has become a prominent issue in the U.K. over recent years and other arthropod-borne diseases have also seen an increase in incidence.

Increasing global travel and trade are expected to fuel the adoption of arthropod-borne viral infections testing in the U.K.

What is the Outlook for Arthropod-borne Viral Infections Testing in Brazil?

“Developing Healthcare Infrastructure to Provide Lucrative Market Opportunities”

Brazil is anticipated to be a highly rewarding market for arthropod-borne viral infections testing vendors due to high incidence of multiple arthropod-borne viral infections like Zika virus and dengue. Brazil is a developing economy and has an emerging healthcare infrastructure that has a lot of untapped potential that arthropod-borne viral infections testing providers can unlock if they enter this market.

Category-wise Analysis

Which Test Type is Expected to Perform the Best?

“High Preference for ELISA-based Test Kits to Drive Sales through 2029”

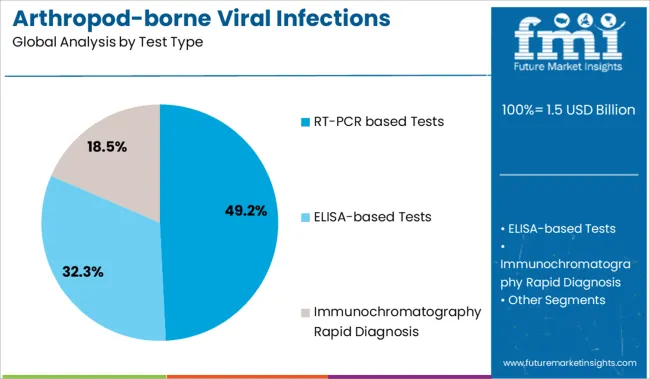
Enzyme-linked immunosorbent assay (ELISA)-based tests have been immensely popular in the arthropod-borne viral infections testing marketplace over the past few years and currently account for a dominant market share of 52% in the global landscape.

Increasing preference for use of ELISA-based test kits by patients, healthcare professionals, researchers, etc. is expected to propel its popularity further.

In 2022, reverse-transcription polymerase chain reaction (RT-PCR) kits hold a market share of 33.5% in the global arthropod-borne viral infections testing industry. The COVID-19 pandemic boosted demand for RT-PCR test kits and this trend is expected to be prevalent over the forecast period as well.
Get the data you need at a Fraction of the cost

Personalize your report by choosing insights you need
and save 40%!

COVID-19 Crisis Survey

The COVID-19 pandemic invigorated demand for arthropod-borne viral infections testing and revolutionized our view on infectious diseases and infections. Increasing uncertainties in these diseases and their re-emergence are anticipated to play a major role in the coming years.

Sales of arthropod-borne viral infections testing kits dropped in 2020 as lockdown mandates were put in place and supply and logistic chains were disrupted. The market is expected to make a steady recovery in the post-pandemic era as restrictions are lifted across the world.

Competitive Landscape

Arthropod-borne viral infections testing providers are investing in the research and development of rapid test kits that are effective in diagnosing infections in a short period of time with minimal error.

  • In November 2021, Achico, a healthcare technology firm headquartered in Switzerland, announced the development of dengue fever diagnostic kits. This new testing kit would be based on the company’s DNA aptamer technology platform that has proven its efficiency in COVID-19 diagnosis.

Arthropod-borne Viral Infections Testing Industry Report Scope

Attribute Details
Forecast Period 2022-2029
Historical Data Available for 2014-2021
Market Analysis US$ Mn for Value
Key Regions Covered
  • North America
  • Latin America
  • Europe
  • East Asia
  • South Asia & Pacific
  • Middle East & Africa (MEA)
Key Countries Covered
  • United States
  • Canada
  • Brazil
  • Mexico
  • Germany
  • U.K.
  • France
  • Spain
  • Italy
  • China
  • Japan
  • South Korea
  • India
  • Indonesia
  • Malaysia
  • Singapore
  • Australia
  • New Zealand
  • Turkey
  • South Africa
  • and GCC Countries
Key Market Segments Covered
  • Test Type
  • End User
  • Region
Key Companies Profiled
  • Thermo Fisher Scientific Inc.
  • Roche Molecular Systems Inc.
  • bioMérieux SA
  • InBios International Inc.
  • NovaTec Immundiagnostica GmbH
  • Euroimmun AG (Sub. PerkinElmer)
  • Quest Diagnostics
  • Certest Biotec S.L.
  • Response Biomedical Corp.
  • Chembio Diagnostic Systems Inc.
  • Abbott Laboratories
Pricing Available upon Request

Key Segments of Arthropod-borne Viral Infections Testing Industry Survey

Arthropod-borne Viral Infections Testing Market by Test Type:

  • ELISA-based Tests for Arthropod-borne Viral Infections Testing
  • RT-PCR-based Tests for Arthropod-borne Viral Infections Testing
  • Immunochromatography Rapid Diagnosis for Arthropod-borne Viral Infections Testing

Arthropod-borne Viral Infections Testing Market by End User:

  • Arthropod-borne Viral Infections in Testing Hospitals
  • Arthropod-borne Viral Infections in Public Health Laboratories
  • Arthropod-borne Viral Infections in Diagnostic Centres
  • Others

Arthropod-borne Viral Infections Testing Market by Region:

  • North America Arthropod-borne Viral Infections Testing Market
  • Latin America Arthropod-borne Viral Infections Testing Market
  • Europe Arthropod-borne Viral Infections Testing Market
  • East Asia Arthropod-borne Viral Infections Testing Market
  • South Asia & Pacific Arthropod-borne Viral Infections Testing Market
  • Middle East & Africa (MEA) Arthropod-borne Viral Infections Testing Market

Frequently Asked Questions

What is the arthropod-borne viral infections testing market worth?

The global arthropod-borne viral infections testing market holds a valuation of US$ 1.3 Bn in 2022.

What market share is held by ELISA-based tests in 2022?

ELISA-based tests account for 52% of the global arthropod-borne viral infections testing market share.

At what CAGR is the arthropod-borne viral infections testing industry anticipated to progress going forward?

Demand for arthropod-borne viral infections testing is predicted to evolve at a CAGR of 5.6% from 2022 to 2029.

What market statistics are forecasted for 2029?

Sales of arthropod-borne viral infections testing kits are projected to reach US$ 1.9 Bn by 2029.

Which key players are profiled in this arthropod-borne viral infections testing industry survey?

Leading arthropod-borne viral infections testing companies are Roche Molecular Systems Inc., bioMérieux SA, InBios International Inc., NovaTec Immundiagnostica GmbH, Euroimmun AG (Sub. PerkinElmer), Quest Diagnostics, Certest Biotec S.L., Response Biomedical Corp., Chembio Diagnostic Systems Inc., and Abbott Laboratories.

Table of Content

1. Executive Summary

     1.1. Global Market Outlook

     1.2. Demand Side Trends

     1.3. Supply Side Trends

     1.4. Technology Roadmap

     1.5. Analysis and Recommendations

2. Market Overview

     2.1. Market Coverage / Taxonomy

     2.2. Market Definition / Scope / Limitations

3. Key Market Trends

     3.1. Key Trends Impacting the Market

     3.2. Product Innovation / Development Trends

     3.3. Macro-Economic Factors

4. Key Success Factors

     4.1. Product Adoption / Usage Analysis

     4.2. Disease Epidemiology, By Key countries

     4.3. Strategic Promotional Strategies

     4.4. Regulatory Scenario

     4.5. Opportunity Analysis

5. Global Arthropod-borne Viral Infections Testing Market Demand Analysis 2014-2021 and Forecast, 2022-2029

     5.1. Historical Market Volume (Mn Units) Analysis, 2014-2021

     5.2. Current and Future Market Volume (Mn Units) Projections, 2022-2029

     5.3. Y-o-Y Growth Trend Analysis

6. Global Arthropod-borne Viral Infections Testing Market - Pricing Analysis

     6.1. Regional Pricing Analysis By Test Type

     6.2. Pricing Break-up

          6.2.1. Manufacturer Level Pricing

          6.2.2. Distributor Level Pricing

     6.3. Global Average Pricing Analysis Benchmark

7. Global Arthropod-borne Viral Infections Testing Market Demand (in Value or Size in US$ Mn) Analysis 2014-2021 and Forecast, 2022-2029

     7.1. Historical Market Value (US$ Mn) Analysis, 2014-2021

     7.2. Current and Future Market Value (US$ Mn) Projections, 2022-2029

          7.2.1. Y-o-Y Growth Trend Analysis

          7.2.2. Absolute $ Opportunity Analysis

8. Market Background

     8.1. Macro-Economic Factors

          8.1.1. Global GDP Growth Outlook

          8.1.2. Global Internet Penetration Outlook

          8.1.3. Global Media and Entertainment Industry Outlook

     8.2. Forecast Factors - Relevance & Impact

          8.2.1. Top Companies Historical Growth

          8.2.2. Global Healthcare Industry Outlook

          8.2.3. Global GDP Growth Outlook

          8.2.4. Research and Developmental Activities

          8.2.5. Global Diagnostic Industry Outlook

     8.3. Value Chain

     8.4. Market Dynamics

          8.4.1. Drivers

          8.4.2. Restraints

          8.4.3. Opportunity Analysis

9. Global Arthropod-borne Viral Infections Testing Market Analysis 2014-2021 and Forecast 2022-2029, by Test Type

     9.1. Introduction / Key Findings

     9.2. Historical Market Size (US$ Mn) and Volume Analysis By Test Type, 2014-2021

     9.3. Current and Future Market Size (US$ Mn) and Volume Analysis and Forecast By Test Type, 2021 - 2021

          9.3.1. ELISA-based Tests

          9.3.2. RT-PCR based Tests

          9.3.3. Immunochromatography Rapid Diagnosis

     9.4. Market Attractiveness Analysis By Test Type

10.Global Arthropod-borne Viral Infections Testing Market Analysis 2014-2021 and Forecast 2022-2029, by End User

     10.1. Introduction / Key Findings

     10.2. Historical Market Size (US$ Mn) and Volume Analysis By End User, 2014-2021

     10.3. Current and Future Market Size (US$ Mn) and Volume Analysis and Forecast By End User, 2021 - 2021

          10.3.1. Hospitals

          10.3.2. Public Health Laboratory

          10.3.3. Diagnostic Centers

          10.3.4. Others

     10.4. Market Attractiveness Analysis By End User

11.Global Arthropod-borne Viral Infections Testing Market Analysis 2014-2021 and Forecast 2022-2029, by Region

     11.1. Introduction

     11.2. Historical Market Size (US$ Mn) and Volume Analysis By Region, 2014-2021

     11.3. Current Market Size (US$ Mn) and Volume Analysis and Forecast By Region, 2021 - 2021

          11.3.1. North America

          11.3.2. Latin America

          11.3.3. Europe

          11.3.4. Middle East and Africa (MEA)

          11.3.5. East Asia

          11.3.6. South Asia

          11.3.7. Oceania

     11.4. Market Attractiveness Analysis By Region

12. North America Arthropod-borne Viral Infections Testing Market Analysis 2014-2021 and Forecast 2022-2029

     12.1. Introduction

     12.2. Pricing Analysis

     12.3. Historical Market Size (US$ Mn) and Volume Trend Analysis By Market Taxonomy, 2014-2021

     12.4. Market Size (US$ Mn) and Volume Forecast By Market Taxonomy, 2022-2029

          12.4.1.By Country

               12.4.1.1. U.S.

               12.4.1.2. Canada

          12.4.2. By Test Type

          12.4.3. By End User

     12.5. Market Attractiveness Analysis

          12.5.1. By Country

          12.5.2. By Test Type

          12.5.3. By End User

     12.6. Market Trends

     12.7. Key Market Participants - Intensity Mapping

     12.8. Drivers and Restraints - Impact Analysis

13. Latin America Arthropod-borne Viral Infections Testing Market Analysis 2014-2021 and Forecast 2022-2029

     13.1. Introduction

     13.2. Pricing Analysis

     13.3. Historical Market Size (US$ Mn) and Volume Trend Analysis By Market Taxonomy, 2014-2021

     13.4. Market Size (US$ Mn) and Volume Forecast By Market Taxonomy, 2022-2029

          13.4.1.By Country

               13.4.1.1. Brazil

               13.4.1.2. Mexico

               13.4.1.3. Rest of Latin America

          13.4.2. By Test Type

          13.4.3. By End User

     13.5. Market Attractiveness Analysis

          13.5.1. By Country

          13.5.2. By Test Type

          13.5.3. By End User

     13.6. Market Trends

     13.7. Key Market Participants - Intensity Mapping

     13.8. Drivers and Restraints - Impact Analysis

14.Europe Arthropod-borne Viral Infections Testing Market Analysis 2014-2021 and Forecast 2022-2029

     14.1. Introduction

     14.2. Pricing Analysis

     14.3. Historical Market Size (US$ Mn) and Volume Trend Analysis By Market Taxonomy, 2014-2021

     14.4. Market Size (US$ Mn) and Volume Forecast By Market Taxonomy, 2022-2029

          14.4.1.By Country

               14.4.1.1. Germany

               14.4.1.2. Italy

               14.4.1.3. France

               14.4.1.4. U.K.

               14.4.1.5. Spain

               14.4.1.6. BENELUX

               14.4.1.7. Russia

               14.4.1.8. Rest of Europe

          14.4.2. By Test Type

          14.4.3. By End User

     14.5. Market Attractiveness Analysis

          14.5.1. By Country

          14.5.2. By Test Type

          14.5.3. By End User

     14.6. Market Trends

     14.7. Key Market Participants - Intensity Mapping

     14.8. Drivers and Restraints - Impact Analysis

15.South Asia Arthropod-borne Viral Infections Testing Market Analysis 2014-2021 and Forecast 2022-2029

     15.1. Introduction

     15.2. Pricing Analysis

     15.3. Historical Market Size (US$ Mn) and Volume Trend Analysis By Market Taxonomy, 2014-2021

     15.4. Market Size (US$ Mn) and Volume Forecast By Market Taxonomy, 2022-2029

          15.4.1.By Country

               15.4.1.1. India

               15.4.1.2. Thailand

               15.4.1.3. Indonesia

               15.4.1.4. Malaysia

               15.4.1.5. Rest of South Asia

          15.4.2. By Test Type

          15.4.3. By End User

     15.5. Market Attractiveness Analysis

          15.5.1. By Country

          15.5.2. By Test Type

          15.5.3. By End User

     15.6. Market Trends

     15.7. Key Market Participants - Intensity Mapping

     15.8. Drivers and Restraints - Impact Analysis

16.East Asia Arthropod-borne Viral Infections Testing Market Analysis 2014-2021 and Forecast 2022-2029

     16.1. Introduction

     16.2. Pricing Analysis

     16.3. Historical Market Size (US$ Mn) and Volume Trend Analysis By Market Taxonomy, 2014-2021

     16.4. Market Size (US$ Mn) and Volume Forecast By Market Taxonomy, 2022-2029

          16.4.1.By Country

               16.4.1.1. China

               16.4.1.2. Japan

               16.4.1.3. South Korea

          16.4.2. By Test Type

          16.4.3. By End User

     16.5. Market Attractiveness Analysis

          16.5.1. By Country

          16.5.2. By Test Type

          16.5.3. By End User

     16.6. Market Trends

     16.7. Key Market Participants - Intensity Mapping

     16.8. Drivers and Restraints - Impact Analysis

17.Oceania Arthropod-borne Viral Infections Testing Market Analysis 2014-2021 and Forecast 2022-2029

     17.1. Introduction

     17.2. Pricing Analysis

     17.3. Historical Market Size (US$ Mn) and Volume Trend Analysis By Market Taxonomy, 2014-2021

     17.4. Market Size (US$ Mn) and Volume Forecast By Market Taxonomy, 2022-2029

          17.4.1.By Country

               17.4.1.1. Australia

               17.4.1.2. New Zealand

          17.4.2. By Test Type

          17.4.3. By End User

     17.5. Market Attractiveness Analysis

          17.5.1. By Country

          17.5.2. By Test Type

          17.5.3. By End User

     17.6. Market Trends

     17.7. Key Market Participants - Intensity Mapping

     17.8. Drivers and Restraints - Impact Analysis

18.Middle East and Africa Arthropod-borne Viral Infections Testing Market Analysis 2014-2021 and Forecast 2022-2029

     18.1. Introduction

     18.2. Pricing Analysis

     18.3. Historical Market Size (US$ Mn) and Volume Trend Analysis By Market Taxonomy, 2014-2021

     18.4. Market Size (US$ Mn) and Volume Forecast By Market Taxonomy, 2022-2029

          18.4.1. By Country

               18.4.1.1. GCC Countries

               18.4.1.2. Turkey

               18.4.1.3. Northern Africa

               18.4.1.4. South Africa

               18.4.1.5. Rest of Middle East and Africa

          18.4.2. By Test Type

          18.4.3. By End User

     18.5. Market Attractiveness Analysis

          18.5.1. By Country

          18.5.2. By Test Type

          18.5.3. By End User

     18.6. Market Trends

     18.7. Key Market Participants - Intensity Mapping

     18.8. Drivers and Restraints - Impact Analysis

19. Key and Emerging Countries Arthropod-borne Viral Infections Testing Market Analysis 2014-2021 and Forecast 2022-2029

     19.1. Introduction

          19.1.1. Market Value Proportion Analysis, By Key Countries

          19.1.2. Global Vs. Country Growth Comparison

     19.2. U.S. Arthropod-borne Viral Infections Testing Market Analysis

          19.2.1. By Test Type

          19.2.2. By End User

     19.3. Canada Arthropod-borne Viral Infections Testing Market Analysis

          19.3.1. By Test Type

          19.3.2. By End User

     19.4. Mexico Arthropod-borne Viral Infections Testing Market Analysis

          19.4.1. By Test Type

          19.4.2. By End User

     19.5. Brazil Arthropod-borne Viral Infections Testing Market Analysis

          19.5.1. By Test Type

          19.5.2. By End User

     19.6. U.K. Arthropod-borne Viral Infections Testing Market Analysis

          19.6.1. By Test Type

          19.6.2. By End User

     19.7. Germany Arthropod-borne Viral Infections Testing Market Analysis

          19.7.1. By Test Type

          19.7.2. By End User

     19.8. France Arthropod-borne Viral Infections Testing Market Analysis

          19.8.1. By Test Type

          19.8.2. By End User

     19.9. Italy Arthropod-borne Viral Infections Testing Market Analysis

          19.9.1. By Test Type

          19.9.2. By End User

     19.10. Spain Arthropod-borne Viral Infections Testing Market Analysis

          19.10.1. By Test Type

          19.10.2. By End User

     19.11. BENELUX Arthropod-borne Viral Infections Testing Market Analysis

          19.11.1. By Test Type

          19.11.2. By End User

     19.12. Russia Arthropod-borne Viral Infections Testing Market Analysis

          19.12.1. By Test Type

          19.12.2. By End User

     19.13. China Arthropod-borne Viral Infections Testing Market Analysis

          19.13.1. By Test Type

          19.13.2. By End User

     19.14. Japan Arthropod-borne Viral Infections Testing Market Analysis

          19.14.1. By Test Type

          19.14.2. By End User

     19.15. South Korea Arthropod-borne Viral Infections Testing Market Analysis

          19.15.1. By Test Type

          19.15.2. By End User

     19.16. India Arthropod-borne Viral Infections Testing Market Analysis

          19.16.1. By Test Type

          19.16.2. By End User

     19.17. ASEAN Arthropod-borne Viral Infections Testing Market Analysis

          19.17.1. By Test Type

          19.17.2. By End User

     19.18. Australia Arthropod-borne Viral Infections Testing Market Analysis

          19.18.1. By Test Type

          19.18.2. By End User

     19.19. New Zealand Arthropod-borne Viral Infections Testing Market Analysis

          19.19.1. By Test Type

          19.19.2. By End User

     19.20. GCC Countries Arthropod-borne Viral Infections Testing Market Analysis

          19.20.1. By Test Type

          19.20.2. By End User

     19.21. Turkey Arthropod-borne Viral Infections Testing Market Analysis

          19.21.1. By Test Type

          19.21.2. By End User

     19.22. South Africa Arthropod-borne Viral Infections Testing Market Analysis

          19.22.1. By Test Type

          19.22.2. By End User

20.Market Structure Analysis

     20.1. Market Analysis by Tier of Companies (Arbovirus Testing)

     20.2. Market Concentration

     20.3. Market Share Analysis of Top Players

     20.4. Market Presence Analysis

          20.4.1. By Regional footprint of Players

          20.4.2. Product foot print by Players

          20.4.3. Channel Foot Print by Players

21.Competition Analysis

     21.1. Competition Dashboard

     21.2. Competition Benchmarking

     21.3. Competition Deep Dive

          21.3.1. Thermo Fisher Scientific, Inc.

               21.3.1.1. Overview

               21.3.1.2. Product Portfolio

               21.3.1.3. Profitability by Market Segments (Product/Channel/Region)

               21.3.1.4. Sales Footprint

               21.3.1.5. Strategy Overview

                     21.3.1.5.1. Marketing Strategy

                     21.3.1.5.2. Product Strategy

                     21.3.1.5.3. Channel Strategy

          21.3.2. Roche Molecular Systems Inc.

               21.3.2.1. Overview

               21.3.2.2. Product Portfolio

               21.3.2.3. Profitability by Market Segments (Product/Channel/Region)

               21.3.2.4. Sales Footprint

               21.3.2.5. Strategy Overview

                     21.3.2.5.1. Marketing Strategy

                     21.3.2.5.2. Product Strategy

                     21.3.2.5.3. Channel Strategy

          21.3.3. bioMérieux SA

               21.3.3.1. Overview

               21.3.3.2. Product Portfolio

               21.3.3.3. Profitability by Market Segments (Product/Channel/Region)

               21.3.3.4. Sales Footprint

               21.3.3.5. Strategy Overview

                     21.3.3.5.1. Marketing Strategy

                     21.3.3.5.2. Product Strategy

                     21.3.3.5.3. Channel Strategy

          21.3.4. Abbott Laboratories

               21.3.4.1. Overview

               21.3.4.2. Product Portfolio

               21.3.4.3. Profitability by Market Segments (Product/Channel/Region)

               21.3.4.4. Sales Footprint

               21.3.4.5. Strategy Overview

                     21.3.4.5.1. Marketing Strategy

                     21.3.4.5.2. Product Strategy

                     21.3.4.5.3. Channel Strategy

          21.3.5. InBios International, Inc.

               21.3.5.1. Overview

               21.3.5.2. Product Portfolio

               21.3.5.3. Profitability by Market Segments (Product/Channel/Region)

               21.3.5.4. Sales Footprint

               21.3.5.5. Strategy Overview

                     21.3.5.5.1. Marketing Strategy

                     21.3.5.5.2. Product Strategy

                     21.3.5.5.3. Channel Strategy

          21.3.6. NovaTec Immundiagnostica GmbH

               21.3.6.1. Overview

               21.3.6.2. Product Portfolio

               21.3.6.3. Profitability by Market Segments (Product/Channel/Region)

               21.3.6.4. Sales Footprint

               21.3.6.5. Strategy Overview

                     21.3.6.5.1. Marketing Strategy

                     21.3.6.5.2. Product Strategy

                     21.3.6.5.3. Channel Strategy

          21.3.7. Euroimmun AG (Sub. PerkinElmer)

               21.3.7.1. Overview

               21.3.7.2. Product Portfolio

               21.3.7.3. Profitability by Market Segments (Product/Channel/Region)

               21.3.7.4. Sales Footprint

               21.3.7.5. Strategy Overview

                     21.3.7.5.1. Marketing Strategy

                     21.3.7.5.2. Product Strategy

                     21.3.7.5.3. Channel Strategy

          21.3.8. Quest Diagnostics

               21.3.8.1. Overview

               21.3.8.2. Product Portfolio

               21.3.8.3. Profitability by Market Segments (Product/Channel/Region)

               21.3.8.4. Sales Footprint

               21.3.8.5. Strategy Overview

                     21.3.8.5.1. Marketing Strategy

                     21.3.8.5.2. Product Strategy

                     21.3.8.5.3. Channel Strategy

          21.3.9. Certest Biotec S.L.

               21.3.9.1. Overview

               21.3.9.2. Product Portfolio

               21.3.9.3. Profitability by Market Segments (Product/Channel/Region)

               21.3.9.4. Sales Footprint

               21.3.9.5. Strategy Overview

                     21.3.9.5.1. Marketing Strategy

                     21.3.9.5.2. Product Strategy

                     21.3.9.5.3. Channel Strategy

          21.3.10. Response Biomedical Corp.

               21.3.10.1. Overview

               21.3.10.2. Product Portfolio

               21.3.10.3. Profitability by Market Segments (Product/Channel/Region)

               21.3.10.4. Sales Footprint

               21.3.10.5. Strategy Overview

                     21.3.10.5.1. Marketing Strategy

                     21.3.10.5.2. Product Strategy

                     21.3.10.5.3. Channel Strategy

          21.3.11. Chembio Diagnostic Systems, Inc.

               21.3.11.1. Overview

               21.3.11.2. Product Portfolio

               21.3.11.3. Profitability by Market Segments (Product/Channel/Region)

               21.3.11.4. Sales Footprint

               21.3.11.5. Strategy Overview

                     21.3.11.5.1. Marketing Strategy

                     21.3.11.5.2. Product Strategy

                     21.3.11.5.3. Channel Strategy

22.Assumptions and Acronyms Used

23. Research Methodology

Don't pay for what you don't need

Customize your report by selecting specific countries or regions and save 30%!

List of Tables

Table 1 : Global Arthropod-borne Viral Infections Testing Market Size (US$ Mn) 2014-2021 and Forecast 2022-2029 By Test Type, 

Table 2 : Global Arthropod-borne Viral Infections Testing Market Size (US$ Mn) 2014-2021 and Forecast 2022-2029 By End User, 

Table 3 : Global Arthropod-borne Viral Infections Testing Market Size (US$ Mn) 2014-2021 and Forecast 2022-2029 By Region 

Table 4 : North America Arthropod-borne Viral Infections Testing Market Size Analysis (US$ Mn) Analysis 2014-2021 and Forecast 2022-2029, By Country

Table 5 : North America Arthropod-borne Viral Infections Testing Market Size Analysis (US$ Mn) Analysis 2014-2021 and Forecast 2022-2029, By Test Type

Table 6 : North America Arthropod-borne Viral Infections Testing Market Size Analysis (US$ Mn) Analysis 2014-2021 and Forecast 2022-2029, By End User

Table 7 : Latin America Arthropod-borne Viral Infections Testing Market Size Analysis (US$ Mn) Analysis 2014-2021 and Forecast 2022-2029, By Country

Table 8 : Latin America Arthropod-borne Viral Infections Testing Market Size Analysis (US$ Mn) Analysis 2014-2021 and Forecast 2022-2029, By Test Type

Table 9: Latin America Arthropod-borne Viral Infections Testing Market Size Analysis (US$ Mn) Analysis 2014-2021 and Forecast 2022-2029, By End User

Table 10 : Europe Arthropod-borne Viral Infections Testing Market Size Analysis (US$ Mn) Analysis 2014-2021 and Forecast 2022-2029, By Country

Table 11 : Europe Arthropod-borne Viral Infections Testing Market Size Analysis (US$ Mn) Analysis 2014-2021 and Forecast 2022-2029, By Test Type

Table 12 : Europe Arthropod-borne Viral Infections Testing Market Size Analysis (US$ Mn) Analysis 2014-2021 and Forecast 2022-2029, By End User

Table 13 : South Asia Arthropod-borne Viral Infections Testing Market Size Analysis (US$ Mn) Analysis 2014-2021 and Forecast 2022-2029, By Country

Table 14 : South Asia Arthropod-borne Viral Infections Testing Market Size Analysis (US$ Mn) Analysis 2014-2021 and Forecast 2022-2029, By Test Type

Table 15 : South Asia Arthropod-borne Viral Infections Testing Market Size Analysis (US$ Mn) Analysis 2014-2021 and Forecast 2022-2029, By End User

Table 16 : East Asia Arthropod-borne Viral Infections Testing Market Size Analysis (US$ Mn) Analysis 2014-2021 and Forecast 2022-2029, By Country

Table 17 : East Asia Arthropod-borne Viral Infections Testing Market Size Analysis (US$ Mn) Analysis 2014-2021 and Forecast 2022-2029, By Test Type

Table 18 : East Asia Arthropod-borne Viral Infections Testing Market Size Analysis (US$ Mn) Analysis 2014-2021 and Forecast 2022-2029, By End User

Table 19 : Oceania Arthropod-borne Viral Infections Testing Market Size Analysis (US$ Mn) Analysis 2014-2021 and Forecast 2022-2029, By Country

Table 20 : Oceania Arthropod-borne Viral Infections Testing Market Size Analysis (US$ Mn) Analysis 2014-2021 and Forecast 2022-2029, By Test Type

Table 21 : Oceania Arthropod-borne Viral Infections Testing Market Size Analysis (US$ Mn) Analysis 2014-2021 and Forecast 2022-2029, By End User

Table 22 : Middle East & Africa Arthropod-borne Viral Infections Testing Market Size Analysis (US$ Mn) Analysis 2014-2021 and Forecast 2022-2029, By Country

Table 23 : Middle East & Africa Arthropod-borne Viral Infections Testing Market Size Analysis (US$ Mn) Analysis 2014-2021 and Forecast 2022-2029, By Test Type

Table 24 : Middle East & Africa Arthropod-borne Viral Infections Testing Market Size Analysis (US$ Mn) Analysis 2014-2021 and Forecast 2022-2029, By End User
Sabyasachi Ghosh
Sabyasachi Ghosh

Principal Consultant

Talk to Analyst

Find your sweet spots for generating winning opportunities in this market.

List of Charts

Figure 01: Global Arthropod-Borne Viral Infections Testing Market Value Share, By Test Type (2021)

Figure 02: Global Arthropod-Borne Viral Infections Testing Market Value Share, by End User(2021)

Figure 03: Global Arthropod-Borne Viral Infections Testing Market Value Share, by Region (2021)

Figure 04: Global Arthropod-Borne Viral Infections Testing Market Value Analysis (US$ Mn), 2014-2021

Figure 05: Global Arthropod-Borne Viral Infections Testing Market Value Analysis (US$ Mn), 2022-2029

Figure 06: Global Arthropod-Borne Viral Infections Testing Market Absolute $ Opportunity, 2014-2021

Figure 07: Global Arthropod-Borne Viral Infections Testing Market Absolute $ Opportunity, 2022-2029

Figure 08 : Global Arthropod-Borne Viral Infections Testing Market Attractiveness Analysis By Test Type, 2022-2029

Figure 09 : Global Arthropod-Borne Viral Infections Testing Market Attractiveness Analysis By End User, 2022-2029

Figure 10 : Global Arthropod-Borne Viral Infections Testing Market Attractiveness Analysis By Region, 2022-2029

Figure 11 : North America Arthropod-Borne Viral Infections Testing Market Split By End User (2019E)

Figure 12 : North America Arthropod-Borne Viral Infections Testing Market Split By Test Type (2019E)

Figure 13 : North America Arthropod-Borne Viral Infections Testing Market Split By Region (2019E)

Figure 14 : North America Arthropod-Borne Viral Infections Testing Market Size (US$ Mn) Analysis, 2014-2021

Figure 15 : North America Arthropod-Borne Viral Infections Testing Market Size (US$ Mn) & Y-o-Y Growth (%), 2022-2029

Figure 16 : North America Arthropod-Borne Viral Infections Testing Market Attractiveness Analysis, By Country

Figure 17 : North America Arthropod-Borne Viral Infections Testing Market Attractiveness Analysis, By Test Type

Figure 18 : North America Arthropod-Borne Viral Infections Testing Market Attractiveness Analysis, By End User

Figure 19 : Latin America Arthropod-Borne Viral Infections Testing Market Split By Test Type (2019E)

Figure 20 : Latin America Arthropod-Borne Viral Infections Testing Market Split By End User (2019E)

Figure 21 : Latin America Arthropod-Borne Viral Infections Testing Market Split By Region (2019E)

Figure 22 : Latin America Arthropod-Borne Viral Infections Testing Market Size (US$ Mn) Analysis, 2014-2021

Figure 23 : Latin America Arthropod-Borne Viral Infections Testing Market Size (US$ Mn) & Y-o-Y Growth (%), 2022-2029

Figure 24 : Latin America Arthropod-Borne Viral Infections Testing Market Attractiveness Analysis, By Country

Figure 25 : Latin America Arthropod-Borne Viral Infections Testing Market Attractiveness Analysis, By Test Type

Figure 26 : Latin America Arthropod-Borne Viral Infections Testing Market Attractiveness Analysis, By End User

Figure 27 : Europe Arthropod-Borne Viral Infections Testing Market Split By End User (2019E)

Figure 28 : Europe Arthropod-Borne Viral Infections Testing Market Split By Test Type (2019E)

Figure 29 : Europe Arthropod-Borne Viral Infections Testing Market Split By Region (2019E)

Figure 30 : Europe Arthropod-Borne Viral Infections Testing Market Size (US$ Mn) Analysis, 2014-2021

Figure 31 : Europe Arthropod-Borne Viral Infections Testing Market Size (US$ Mn) & Y-o-Y Growth (%), 2022-2029

Figure 32 : Europe Arthropod-Borne Viral Infections Testing Market Attractiveness Analysis, By Country

Figure 33 : Europe Arthropod-Borne Viral Infections Testing Market Attractiveness Analysis, By Test Type

Figure 34 : Europe Arthropod-Borne Viral Infections Testing Market Attractiveness Analysis, By End User

Figure 35 : South Asia Arthropod-Borne Viral Infections Testing Market Split By End User (2019E)

Figure 36 : South Asia Arthropod-Borne Viral Infections Testing Market Split By Test Type (2019E)

Figure 37 : South Asia Arthropod-Borne Viral Infections Testing Market Split By Region (2019E)

Figure 38 : South Asia Arthropod-Borne Viral Infections Testing Market Size (US$ Mn) Analysis, 2014-2021

Figure 39 : South Asia Arthropod-Borne Viral Infections Testing Market Size (US$ Mn) & Y-o-Y Growth (%), 2022-2029

Figure 40 : South Asia Arthropod-Borne Viral Infections Testing Market Attractiveness Analysis, By Country

Figure 41 : South Asia Arthropod-Borne Viral Infections Testing Market Attractiveness Analysis, By Test Type

Figure 42 : South Asia Arthropod-Borne Viral Infections Testing Market Attractiveness Analysis, By End User

Figure 43 : East Asia Arthropod-Borne Viral Infections Testing Market Split By End User (2019E)

Figure 44 : East Asia Arthropod-Borne Viral Infections Testing Market Split By Test Type (2019E)

Figure 45 : East Asia Arthropod-Borne Viral Infections Testing Market Split By Region (2019E)

Figure 46 : East Asia Arthropod-Borne Viral Infections Testing Market Size (US$ Mn) Analysis, 2014-2021

Figure 47 : East Asia Arthropod-Borne Viral Infections Testing Market Size (US$ Mn) & Y-o-Y Growth (%), 2022-2029

Figure 48 : East Asia Arthropod-Borne Viral Infections Testing Market Attractiveness Analysis, By Country

Figure 49 : East Asia Arthropod-Borne Viral Infections Testing Market Attractiveness Analysis, By Test Type

Figure 50 : East Asia Arthropod-Borne Viral Infections Testing Market Attractiveness Analysis, By End User

Figure 51 : Oceania Arthropod-Borne Viral Infections Testing Market Split By End User (2019E)

Figure 52 : Oceania Arthropod-Borne Viral Infections Testing Market Split By Test Type (2019E)

Figure 53 : Oceania Arthropod-Borne Viral Infections Testing Market Split By Region (2019E)

Figure 54 : Oceania Arthropod-Borne Viral Infections Testing Market Size (US$ Mn) Analysis, 2014-2021

Figure 55 : Oceania Arthropod-Borne Viral Infections Testing Market Size (US$ Mn) & Y-o-Y Growth (%), 2022-2029

Figure 56 : Oceania Arthropod-Borne Viral Infections Testing Market Attractiveness Analysis, By Country

Figure 57 : East Asia Arthropod-Borne Viral Infections Testing Market Attractiveness Analysis, By Test Type

Figure 58 : Oceania Arthropod-Borne Viral Infections Testing Market Attractiveness Analysis, By End User

Figure 59 : Middle East & Africa Arthropod-Borne Viral Infections Testing Market Split By End User (2019E)

Figure 60 : Middle East & Africa Arthropod-Borne Viral Infections Testing Market Split By Test Type (2019E)

Figure 61 : Middle East & Africa Arthropod-Borne Viral Infections Testing Market Split By Region (2019E)

Figure 62 : Middle East & Africa Arthropod-Borne Viral Infections Testing Market Size (US$ Mn) Analysis, 2014-2021

Figure 63 : Middle East & Africa Arthropod-Borne Viral Infections Testing Market Size (US$ Mn) & Y-o-Y Growth (%), 2022-2029

Figure 64 : Middle East & Africa Arthropod-Borne Viral Infections Testing Market Attractiveness Analysis, By Country

Figure 65 : East Asia Arthropod-Borne Viral Infections Testing Market Attractiveness Analysis, By Test Type

Figure 66 : Middle East & Africa Arthropod-Borne Viral Infections Testing Market Attractiveness Analysis, By End User

Figure 67: U.S Market Value Proportion Analysis, 2021

Figure 68: U.S. Arthropod-Borne Viral Infections Testing Market Analysis by Test Type, 2022 & 2029

Figure 69 : U.S. Arthropod-Borne Viral Infections Testing Market Analysis by End User, 2022 & 2029 

Figure 70: Global Vs. U.S Growth Comparison, 2022-2029

Figure 71: Canada Market Value Proportion Analysis, 2021

Figure 72: Canada Arthropod-Borne Viral Infections Testing Market Analysis by Test Type, 2022 & 2029

Figure 73: Canada Arthropod-Borne Viral Infections Testing Market Analysis by End User, 2022 & 2029 

Figure 74: Global Vs. Canada Growth Comparison, 2022-2029

Figure 75: Brazil Market Value Proportion Analysis, 2021

Figure 76: Brazil Arthropod-Borne Viral Infections Testing Market Analysis by Test Type, 2022 & 2029

Figure 77: Brazil Arthropod-Borne Viral Infections Testing Market Analysis by End User, 2022 & 2029 

Figure 78: Global Vs. Brazil Growth Comparison, 2022-2029

Figure 79: Mexico Market Value Proportion Analysis, 2021

Figure 80: Mexico Arthropod-Borne Viral Infections Testing Market Analysis by Test Type, 2022 & 2029

Figure 81: Mexico Arthropod-Borne Viral Infections Testing Market Analysis by End User, 2022 & 2029 

Figure 82: Global Vs. Mexico Growth Comparison, 2022-2029

Figure 83: Argentina Market Value Proportion Analysis, 2021

Figure 84: Argentina Arthropod-Borne Viral Infections Testing Market Analysis by Test Type, 2022 & 2029

Figure 85: Argentina Arthropod-Borne Viral Infections Testing Market Analysis by End User, 2022 & 2029 

Figure 86: Global Vs. Argentina Growth Comparison, 2022-2029

Figure 87: Germany Market Value Proportion Analysis, 2021

Figure 88: Germany Arthropod-Borne Viral Infections Testing Market Analysis by Test Type, 2022 & 2029

Figure 89: Germany Arthropod-Borne Viral Infections Testing Market Analysis by End User, 2022 & 2029 

Figure 90: Global Vs. Germany Growth Comparison, 2022-2029

Figure 91: France Market Value Proportion Analysis, 2021

Figure 92: France Arthropod-Borne Viral Infections Testing Market Analysis by Test Type, 2022 & 2029

Figure 93: Figure: France Arthropod-Borne Viral Infections Testing Market Analysis by End User, 2022 & 2029 

Figure 94: Global Vs. France Growth Comparison, 2022-2029

Figure 95: Spain Market Value Proportion Analysis, 2021

Figure 96: Spain Arthropod-Borne Viral Infections Testing Market Analysis by Test Type, 2022 & 2029

Figure 97: Spain Arthropod-Borne Viral Infections Testing Market Analysis by End User, 2022 & 2029 

Figure 98: Global Vs. Spain Growth Comparison, 2022-2029

Figure 99: Italy Market Value Proportion Analysis, 2021

Figure 100: Italy Arthropod-Borne Viral Infections Testing Market Analysis by Test Type, 2022 & 2029

Figure 101: Italy Arthropod-Borne Viral Infections Testing Market Analysis by End User, 2022 & 2029 

Figure 102: Global Vs. Italy Growth Comparison, 2022-2029

Figure 104: Russia Arthropod-Borne Viral Infections Testing Market Analysis by Test Type, 2022 & 2029

Figure 105: Russia Arthropod-Borne Viral Infections Testing Market Analysis by End User, 2022 & 2029 

Figure 106: Global Vs. Russia Growth Comparison, 2022-2029

Figure 107: India Market Value Proportion Analysis, 2021

Figure 108: India Arthropod-Borne Viral Infections Testing Market Analysis by Test Type, 2022 & 2029

Figure 110: Global Vs. India Growth Comparison, 2022-2029

Figure 111: Thailand Market Value Proportion Analysis, 2021

Figure 112: Thailand Arthropod-Borne Viral Infections Testing Market Analysis by Test Type, 2022 & 2029

Figure 113: Thailand Arthropod-Borne Viral Infections Testing Market Analysis by End User, 2022 & 2029 

Figure 114: Global Vs. Thailand Growth Comparison, 2022-2029

Figure 115: Malaysia Market Value Proportion Analysis, 2021

Figure 116: Malaysia Arthropod-Borne Viral Infections Testing Market Analysis by Test Type, 2022 & 2029

Figure 117: Malaysia Arthropod-Borne Viral Infections Testing Market Analysis by End User, 2022 & 2029 

Figure 118: Global Vs. Malaysia Growth Comparison, 2022-2029

Figure 119: Indonesia Market Value Proportion Analysis, 2021

Figure 120: Indonesia Arthropod-Borne Viral Infections Testing Market Analysis by Test Type, 2022 & 2029

Figure 121: Indonesia Arthropod-Borne Viral Infections Testing Market Analysis by End User, 2022 & 2029 

Figure 122: Global Vs. Indonesia Growth Comparison, 2022-2029

Figure 123: China Market Value Proportion Analysis, 2021

Figure 124: China Arthropod-Borne Viral Infections Testing Market Analysis by Test Type, 2022 & 2029

Figure 125: China Arthropod-Borne Viral Infections Testing Market Analysis by End User, 2022 & 2029 

Figure 126: Global Vs. China Growth Comparison, 2022-2029

Figure 127: Japan Market Value Proportion Analysis, 2021

Figure 128: Japan Arthropod-Borne Viral Infections Testing Market Analysis by Test Type, 2022 & 2029

Figure 129: Japan Arthropod-Borne Viral Infections Testing Market Analysis by End User, 2022 & 2029 

Figure 130: Global Vs. Japan Growth Comparison, 2022-2029

Figure 132: South Korea Arthropod-Borne Viral Infections Testing Market Analysis by Test Type, 2022 & 2029

Figure 133: South Korea Arthropod-Borne Viral Infections Testing Market Analysis by End User, 2022 & 2029 

Figure 134: Global Vs. South Korea Growth Comparison, 2022-2029

Figure 135: Australia Market Value Proportion Analysis, 2021

Figure 136: Australia Arthropod-Borne Viral Infections Testing Market Analysis by Test Type, 2022 & 2029

Figure 137: Australia Arthropod-Borne Viral Infections Testing Market Analysis by End User, 2022 & 2029 

Figure 138: Global Vs. Australia Growth Comparison, 2022-2029

Figure 139: South Africa Market Value Proportion Analysis, 2021

Figure 140: South Africa Arthropod-Borne Viral Infections Testing Market Analysis by Test Type, 2022 & 2029

Figure 141: South Africa Arthropod-Borne Viral Infections Testing Market Analysis by End User, 2022 & 2029 

Figure 142: Global Vs. South Africa Growth Comparison, 2022-2029

Figure 143: Turkey Market Value Proportion Analysis, 2021

Figure 144: Turkey Arthropod-Borne Viral Infections Testing Market Analysis by Test Type, 2022 & 2029

Figure 145: Turkey Arthropod-Borne Viral Infections Testing Market Analysis by End User, 2022 & 2029 

Figure 146: Global Vs. Turkey Growth Comparison, 2022-2029

Recommendations

Healthcare

Infection Prevention Market

Published : December 2023

Healthcare

Swab and Viral Transport Medium Market

Published : March 2023

Healthcare

Eye Infections Treatment Market

Published : July 2022

Healthcare

Corneal Ulcer Treatment Market

Published : June 2022

Explore Healthcare Insights

View Reports

Arthropod-borne Viral Infections Testing Market