

- Market Size (2026)
- USD 159.4 Mn
- Forecast (2036)
- USD 554.8 Mn
- CAGR (2026 to 2036)
- 13.3%
Autonomous Shuttle Transit-Grade Floor Module Systems Market Size, Market Forecast and Outlook By FMI
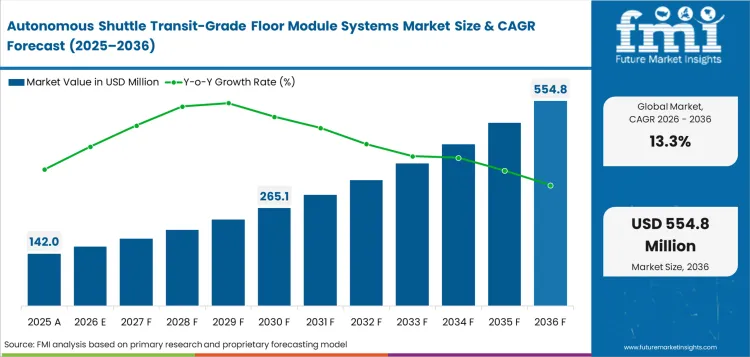
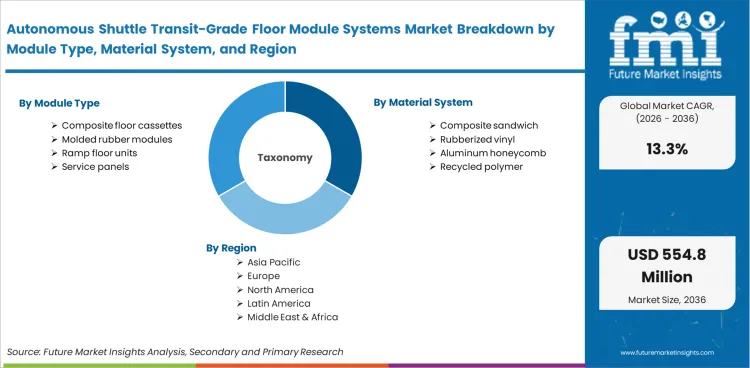
Autonomous shuttle transit-grade floor module systems market was valued at USD 142.0 million in 2025 and is projected to reach USD 159.4 million in 2026. It is forecast to reach USD 554.8 million by 2036 at 13.3% CAGR. Composite floor cassettes are projected to lead module type demand with 46.0% share. OEM integrated modules are expected to hold 55.0% share by sales model in 2026.
Summary of the Autonomous Shuttle Transit-Grade Floor Module Systems Market
- Demand and Growth Drivers
- Demand is rising as shuttle makers design flat walk-through cabins with wheelchair access and fast cleaning routines.
- Transit-grade floor modules gain use where shared vehicles face wet shoes, rolling loads and frequent boarding cycles.
- Fleet trials are moving toward daily service, which raises the need for floor modules that support repeat maintenance.
- Electric shuttle platforms need low-profile floors since battery trays and sensor wiring compete for space below the cabin.
- Product and Segment View
- Composite floor cassettes are projected to account for 46.0% share in 2026 as makers seek light panels with mounting points.
- Rubberized vinyl is forecast to account for 31.0% share of material demand in 2026 due to slip resistance and cleanability.
- Passenger saloons are expected to hold 48.0% share of application demand in 2026 since open cabins need durable walking surfaces.
- OEM integrated modules are projected to account for 55.0% share in 2026 as flooring moves into the vehicle platform design stage.
- Geography and Competitive Outlook
- China is projected to record 15.1% CAGR through 2036 as robobus deployments link with electric bus supply depth.
- The United Kingdom is expected to post 14.8% CAGR through 2036 as the Automated Vehicles Act supports pilot routes.
- Key companies include Forbo Flooring Systems, Gerflor, Altro, BENTELER and Röchling Automotive.
- Competition is shaped by fire performance and module integration support.
- Analyst Opinion
- Nikhil Kaitwade, Principal Consultant at FMI says, “Autonomous shuttle flooring is evolving from a material choice into a system-level requirement linked to vehicle architecture and service operations. As low-floor electric platforms scale under public transit funding programs, floor modules are being specified earlier in the design cycle to support weight targets and underfloor system integration.”
- Autonomous Shuttle Transit-Grade Floor Module Systems Market Value Analysis
- Expansion of low-floor electric shuttle platforms is increasing the need for integrated, lightweight floor modules that support vehicle efficiency and packaging constraints.
- Transition from pilot projects to daily transit operations is driving demand for durable flooring that can withstand frequent passenger use and cleaning cycles.
- Increasing public funding for electric and autonomous mobility is indirectly accelerating floor module demand by expanding the installed base of shuttle fleets
- Growth in shared mobility and accessible shuttle designs is raising the requirement for flat, modular floors that support wheelchair access and passenger movement.
Key Takeaways, Market Size, and Forecast
- The autonomous shuttle transit-grade floor module systems market was valued at USD 142.0 million in 2025.
- By 2036, the market is expected to be worth USD 554.8 million as autonomous shuttle fleets move into repeat transit use.
- From 2026 to 2036, the market is projected to expand at 13.3% CAGR across global shuttle and campus mobility programs.
- The market is projected to create an incremental opportunity of USD 395.4 million between 2026 and 2036.
- Composite floor cassettes are projected to account for 46.0% share of module type demand in 2026.
- OEM integrated modules are expected to account for 55.0% share of sales model demand in 2026.
- China at 15.1% CAGR and the United Kingdom at 14.8% CAGR show significant demand outlook.
Transit agencies are shifting shuttle interiors from pilot buildouts to service-ready layouts. In parallel, public funding is accelerating the adoption of low-floor electric transit platforms, as seen in the United States Federal Transit Administration’s USD 1.5 billion allocation for 117 bus projects in July 2024 and the United Kingdom’s GBP 143 million investment for 955 zero-emission buses in March 2024. While these programs do not directly procure floor modules, they expand the installed base of low-floor electric vehicles where durable, modular flooring becomes an integrated requirement during the design freeze stage.
Autonomous Shuttle Transit-Grade Floor Module Systems Market Definition
The autonomous shuttle transit-grade floor module systems market covers modular floor panels, coverings and access assemblies made for autonomous public mobility vehicles. Scope includes passenger saloon floor cassettes, entry zone modules, ramp flooring, service access panels and battery tunnel covers. The market excludes standard passenger car carpets, building flooring and conventional bus flooring sold without autonomous shuttle specification. Revenue covers module-ready assemblies, integrated kits and service replacement parts used in autonomous shuttle platforms.
Autonomous Shuttle Transit-Grade Floor Module Systems Market Inclusions
Market scope includes floor modules used in low-speed autonomous shuttles, airport people movers, campus circulators and robotaxi pods with transit-style interiors. Included products cover composite cassette floors, rubberized flooring modules, raised access floors, removable panels and entryway ramp surfaces. The scope includes assemblies supplied to OEMs, Tier-1 interior integrators and fleet retrofit partners. Materials include composite sandwich panels, rubberized vinyl, aluminum honeycomb and recycled polymer surfaces. The scope connects with automotive interiors because shuttle floors are specified as part of the cabin system rather than as loose trim.
Autonomous Shuttle Transit-Grade Floor Module Systems Market Exclusions
Scope does not include standard bus vinyl sheets sold for conventional driver-operated buses. Passenger car carpets, residential flooring, rail flooring and marine flooring are excluded unless the product is adapted for an autonomous shuttle cabin. Structural battery enclosures are excluded when they are sold as powertrain parts only. Building accessibility ramps and station platform flooring are outside the market boundary.
Autonomous Shuttle Transit-Grade Floor Module Systems Market Research Methodology
- Primary Research: FMI analysts reviewed shuttle platform needs, transit flooring specifications, OEM module design practices and fleet cleaning requirements.
- Desk Research: The study used government transit funding data, automated vehicle policy updates and official company development releases.
- Market sizing and forecasting: Market size was estimated through shuttle build assumptions, module value per vehicle and retrofit service cycles.
- Data validation: Forecast checks compared electric bus funding, autonomous shuttle trials, interior module pricing and adjacent automotive flooring data.
Why is the Autonomous Shuttle Transit-Grade Floor Module Systems Market Growing?
- Autonomous shuttle cabins need flat walk-through floors that allow standing passengers and wheelchair users to move safely.
- Transit pilots are moving toward scheduled service, which raises the need for flooring that tolerates wet cleaning and high foot traffic.
- Electric platform packaging creates demand for thin modules that protect wiring and service panels below the walking surface.
Growth in the industry is driven by the shift from demonstration vehicles to vehicles designed for daily service. The Federal Transit Administration announced USD 1.5 billion for 117 bus projects in July 2024. This affects suppliers because agencies that buy cleaner buses also start to update depot, charging and cabin specifications. Shuttle floor module suppliers benefit when low-floor electric platforms move into planned transit programs.
Autonomous operation changes the cabin layout because the driver area is reduced or removed. That creates more open walking space and more reliance on floor-level service access. The floor module therefore becomes a safety and maintenance part as much as an interior surface. Suppliers with tested slip ratings and panel repair data are better placed in fleet tenders. The demand is reinforced by the electric low entry bus sector in which low-floor access and public service durability guide design.
Market Segmentation Analysis
- Composite floor cassettes are projected to reach 46.0% share in 2026 as shuttle makers need light modular panels.
- Composite sandwich materials are expected to represent 41.0% share in 2026 because weight reduction supports electric range.
- Passenger saloon floors are forecast to account for 48.0% share in 2026 due to open cabin layouts.
- Low-speed autonomous shuttles are projected to capture 52.0% share in 2026 as early deployments focus on short routes.
- OEM integrated modules are expected to hold 55.0% share in 2026 as design teams specify floors before body assembly.
- Cassette floors are estimated to account for 43.0% share in 2026 as removable sections improve service access.
The market is divided into six primary segment groups based on module type, material system, application, vehicle platform, sales model and installation format. Module type explains how the product is delivered to the vehicle maker. Material system explains how weight, wear and cleaning needs are balanced. Application and vehicle platform show where the floor module creates the most value. Sales model and installation format explain how suppliers enter the vehicle program.
Insights into the Composite Floor Cassettes Module Type Segment
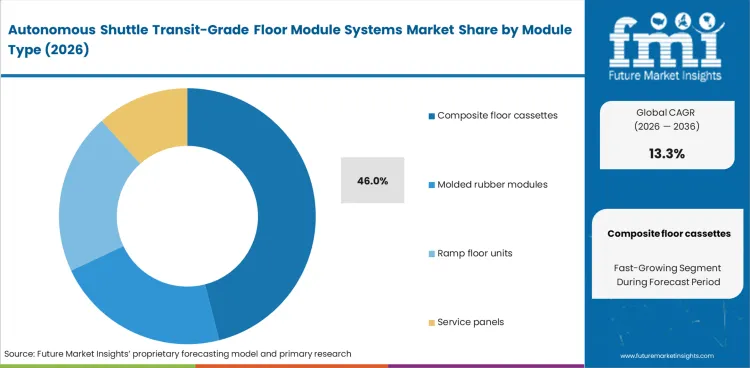
- Composite floor cassettes are projected to account for 46.0% share of module type demand in 2026. Shuttle makers prefer panels that combine surface finish and fixed mounting points.
- Molded rubber modules and ramp floor units remain useful in entry zones. Composite cassettes lead because they simplify assembly and reduce repeat fitting work.
Insights into the Composite Sandwich Material System Segment
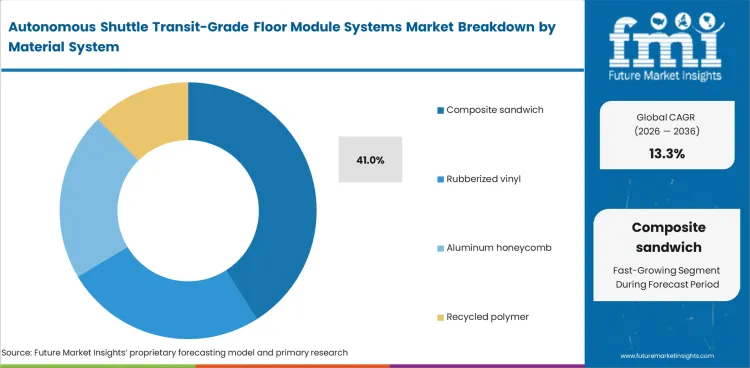
- Composite sandwich materials are expected to hold 41.0% share of material demand in 2026. Lightweight panels help protect range on small electric shuttle platforms.
- Rubberized vinyl remains important for slip resistance and cleaning. Aluminum honeycomb is used where stiffness and service access matter most.
Insights into the Passenger Saloon Application Segment
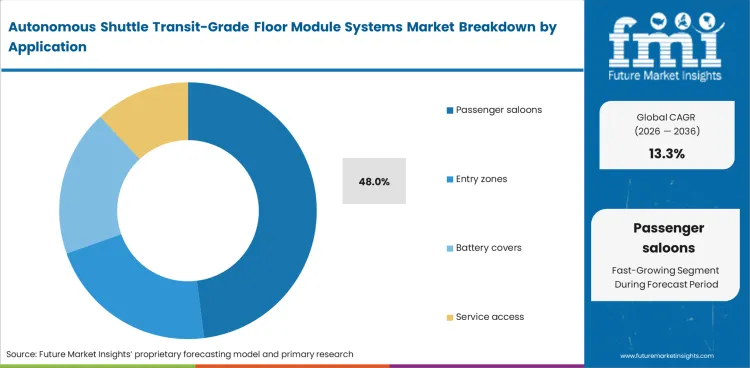
- Passenger saloon floors are forecast to account for 48.0% share of application demand in 2026. Open cabins need durable surfaces across most of the interior footprint.
- Entry zones carry higher wear but cover smaller areas. Battery covers and service panels grow as more wiring moves under the floor.
Insights into the Low-Speed Autonomous Shuttles Vehicle Platform Segment
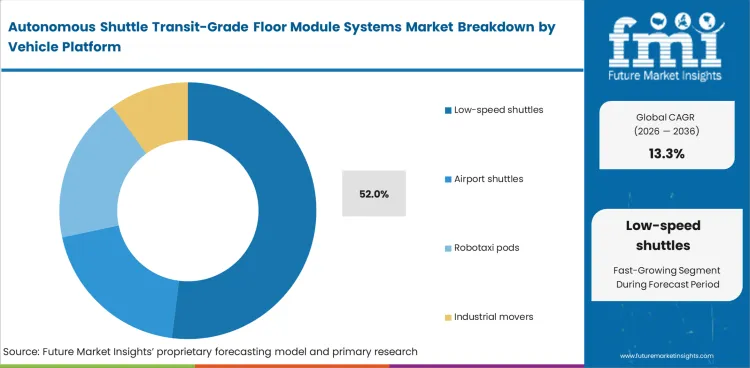
- Low-speed autonomous shuttles are projected to account for 52.0% share of platform demand in 2026. Short-route vehicles use low floors and wide access paths.
- Airport shuttles and industrial movers add demand in controlled routes. Robotaxi pods remain smaller but require high visual finish for passenger acceptance.
Insights into the OEM Integrated Modules Sales Model Segment
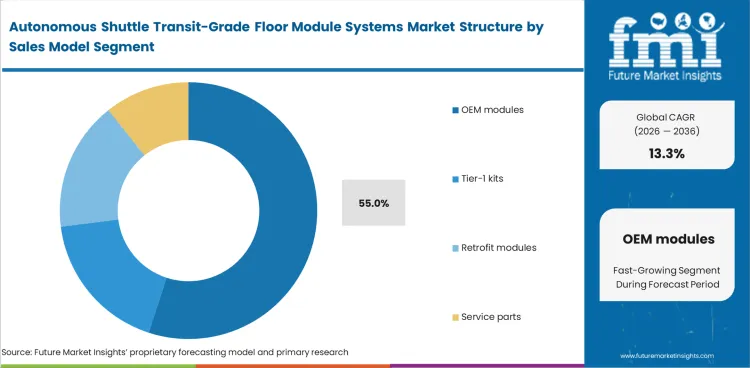
- OEM integrated modules are expected to account for 55.0% share of sales model demand in 2026. Vehicle makers prefer flooring that is validated before production drawings close.
- Tier-1 kits support platform variants and fleet trials. Retrofit modules serve pilots where existing vehicles need serviceable floor upgrades.
Insights into the Cassette Floors Installation Format Segment
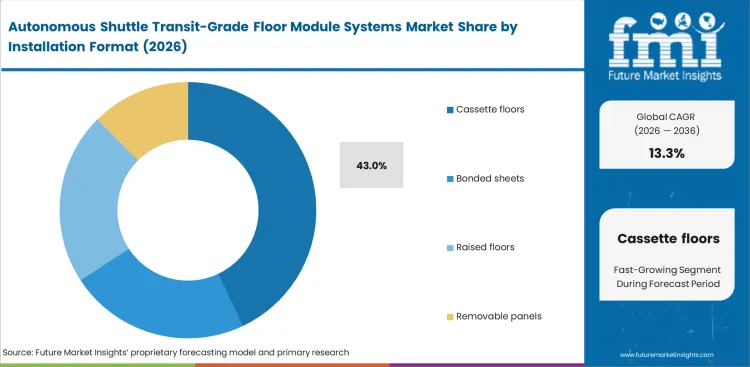
- Cassette floors are estimated to account for 43.0% share of installation format demand in 2026. Removable modules improve maintenance access under the cabin.
- Bonded sheets remain common for low-cost surfaces. Raised service floors grow where wiring and drainage need protected routing.
Autonomous Shuttle Transit-Grade Floor Module Systems Market Drivers, Restraints, and Opportunities
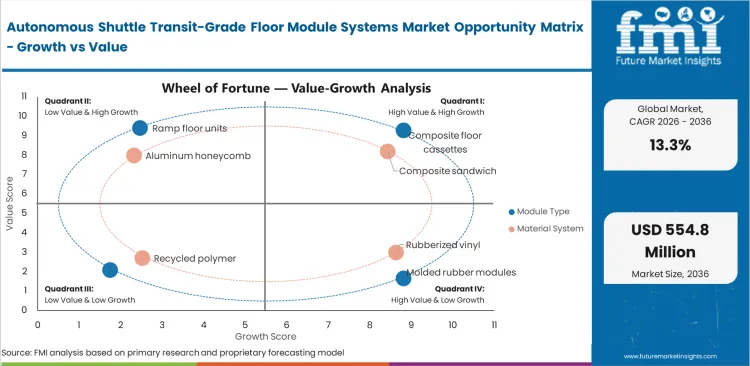
- Low-floor shuttle layouts are raising demand for modular surfaces that support public access and quick cabin cleaning.
- Qualification cost slows adoption because fleet operators need fire, slip and wear evidence before repeat orders.
- Serviceable cassette design creates opportunity as floor modules protect wiring and hidden access points under the cabin.
Transit floor modules are moving from a trim choice to a service design choice. The United Kingdom introduced the Automated Vehicles Act in May 2024 to support self-driving vehicle use on public roads. Shuttle suppliers now need interiors that match public service rules and passenger comfort expectations. Floor systems with safe entry zones and clear wheelchair access are better suited to this next phase.
Cost remains the main restraint in low-volume autonomous shuttle builds. A modular cassette floor costs more than a bonded sheet because it includes a panel substrate, edge finishing and access design. The higher cost is accepted when service access or safety testing cuts future downtime. Suppliers that document cleaning cycles and repair steps can defend the premium.
Service Access Is Creating Module Value
An expansion opportunity is in floor modules that allow fast access to underfloor wiring and battery cover areas. Autonomous shuttles rely on sensors and communication systems that add hidden interfaces. A damaged floor cannot be treated as cosmetic in these vehicles. Module suppliers that design removable panels with repeat fastening can help fleets reduce service time and protect sensitive systems. This opportunity also overlaps with electric vehicle battery housings since battery protection and interior service access increasingly share vehicle packaging space. Bonding and sealing needs bring the market close to automotive adhesives and sealants where low-odor and durable joints affect cabin build quality.
Analysis of Autonomous Shuttle Transit-Grade Floor Module Systems Market by Key Countries
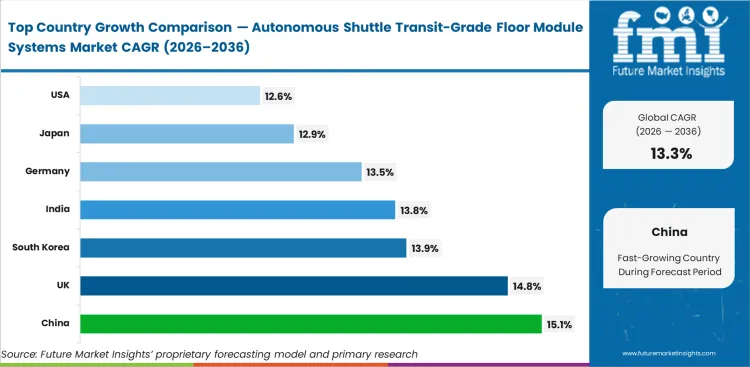
.webp "Top Country Growth Comparison Autonomous Shuttle Transit Grade Floor Module Systems Market Cagr (2026 2036)")
| Country | CAGR |
|---|---|
| United States | 12.6% |
| China | 15.1% |
| India | 13.8% |
| Germany | 13.5% |
| Japan | 12.9% |
| South Korea | 13.9% |
| United Kingdom | 14.8% |
Source: Future Market Insights, 2026.
Autonomous Shuttle Transit-Grade Floor Module Systems Market CAGR Analysis by Country
- China is expected to expand at 15.1% CAGR by 2036 as robobus trials scale near electric bus manufacturing clusters.
- The United Kingdom is expected to post 14.8% CAGR by 2036 as self-driving passenger pilots gain a clearer legal route.
- South Korea is projected to rise at 13.9% CAGR by 2036 as electronics and vehicle software suppliers support shuttle development.
- India is forecast to grow at 13.8% CAGR by 2036 as e-bus programs widen low-floor electric platform familiarity.
- Germany and Japan remain stable qualification markets with 13.5% CAGR and 12.9% CAGR across transport automation programs.
Demand for autonomous shuttle transit-grade floor module systems is forecast to rise at 13.3% CAGR from 2026 to 2036. Country-level analysis covers markets where autonomous mobility policy, electric bus funding and shuttle trials support early use. China and the United Kingdom track above the global rate because public road trials and city mobility programs create faster platform learning.
Demand Outlook for Autonomous Shuttle Transit-Grade Floor Module Systems in the United States
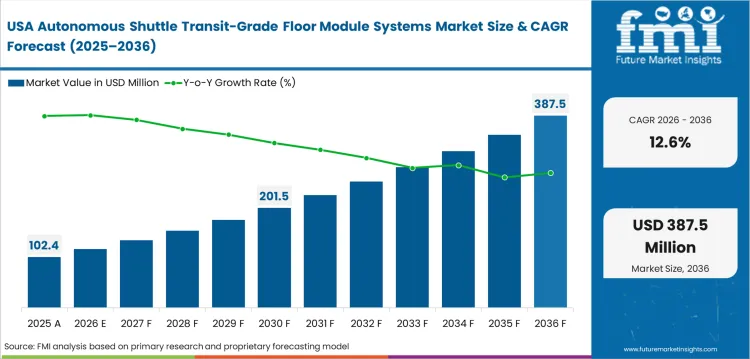
The United States market is shaped by transit grant activity and local shuttle pilots. The Federal Transit Administration announced USD 1.5 billion for 117 projects in July 2024. The United States is projected to record 12.6% CAGR through 2036 as agencies modernize bus and shuttle fleets. Suppliers are expected to need proof of slip resistance and fast replacement because public agencies compare lifecycle cost before approving new cabin materials.
- Jacksonville gives HOLON a local launch base after the company announced a 500,000 square foot autonomous shuttle plant in September 2024.
- Minnesota supports shuttle validation after SouthWest Transit and May Mobility announced autonomous microtransit service in Eden Prairie in July 2024.
- Peachtree Corners in Georgia creates a driver-out route signal because May Mobility launched a commercial service there in February 2025.
Sales Analysis of Autonomous Shuttle Transit-Grade Floor Module Systems in China
China has a large electric bus base that helps suppliers move shuttle components into public mobility programs. The State Council reported over 530,000 electric buses in urban areas in October 2024. China is expected to expand at 15.1% CAGR through 2036 as robobus operations connect with this supply base. Local suppliers gain an edge when module designs fit fast assembly and short urban routes.
- Guangzhou supports robobus floor demand because WeRide inaugurated the Tianhe BRT robobus shuttle line in December 2024.
- Shenzhen remains important because bus and electronics supply chains sit close to autonomous mobility developers.
- Luohu District adds service relevance after WeRide and Shenzhen Bus Group launched a driverless public transport robobus line in August 2025.
Demand Outlook for Autonomous Shuttle Transit-Grade Floor Module Systems in India
Indian demand starts from electric bus platform buildout before autonomous shuttle scale develops. The Press Information Bureau said 10,000 buses were sanctioned across 116 cities in March 2026. India is forecast to grow at 13.8% CAGR through 2036 as public transport agencies add electric bus experience. Floor module suppliers are projected to gain competitive edge through low-cost durability and simple replacement systems.
- Delhi and Bengaluru can act as early evaluation cities because large urban fleets need accessible low-floor interiors.
- Gujarat offers an industrial base for EV parts where modular floors can be localized for shuttle and bus makers.
- Maharashtra transit agencies will favor replaceable surfaces because monsoon cleaning and passenger volume raise wear levels.
Opportunity Analysis of Autonomous Shuttle Transit-Grade Floor Module Systems in Germany
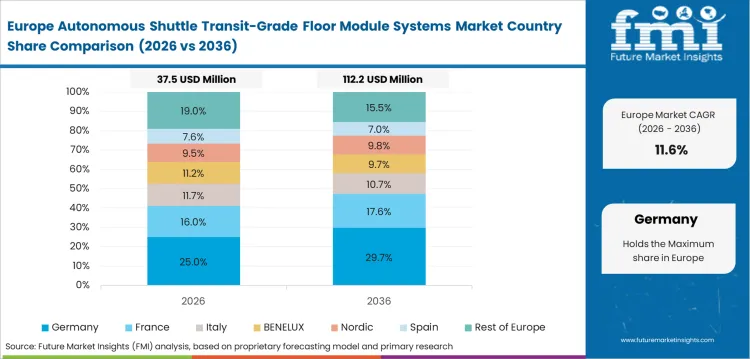
Germany approaches autonomous shuttles through structured public transport trials. The Federal Ministry for Digital and Transport said the KIRA project introduced autonomous shuttles in test operations from June 2024. Germany is expected to advance at 13.5% CAGR through 2036 as trials test vehicles inside normal local transport. Suppliers that meet safety documentation and repair process needs are better placed here.
- Darmstadt and Offenbach are central because KIRA integrates autonomous shuttles into Rhein-Main local public transport operations.
- Munich supports demand through the MINGA project as it studies ride pooling and automated bus operations in local transport.
- Paderborn adds rural mobility relevance through the NeMo.bil project and its modular autonomous shuttle fleet concept.
Future Outlook for Autonomous Shuttle Transit-Grade Floor Module Systems in Japan
Japan links autonomous shuttles with rural mobility and aging population needs. The Ministry of Land, Infrastructure, Transport and Tourism said Iyotetsu Bus began Japan’s first Level 4 autonomous local bus service in 2024. Japan is forecast at 12.9% CAGR through 2036 as compact route vehicles gain local service roles. Suppliers will need low-noise surfaces and precise module fit for small vehicle cabins.
- Eiheiji in Fukui Prefecture remains a reference point because Level 4 automated driving service started there before wider route learning.
- Matsuyama gains relevance because the Iyotetsu Bus Level 4 service runs 66 trips per day over an 800 meter route.
- Fukuoka supports platform learning after May Mobility tested Toyota e-Palette technology at Toyota Motor Kyushu’s Miyata factory.
Sales Analysis of Autonomous Shuttle Transit-Grade Floor Module Systems in South Korea
South Korea has vehicle electronics capability that supports autonomous shuttle content development. South Korea is projected to rise at 13.9% CAGR through 2036 as sensor hardware and vehicle software supply overlap. The country does not lead volume today. It offers a useful qualification base where interior modules must support electronics access and passenger safety.
- Seoul offers the clearest early buyer base because connected mobility pilots and dense transit corridors create shuttle test needs.
- Gyeonggi manufacturing clusters support module suppliers that need electronics partners and automotive-grade assembly capability.
- Daegu and Busan can test airport or waterfront shuttles where compact route vehicles operate under controlled conditions.
Future Outlook for Autonomous Shuttle Transit-Grade Floor Module Systems in the United Kingdom
The United Kingdom has a clear legal pathway for automated passenger services. The Automated Vehicles Act became law in May 2024 and implementation work continues toward 2027. The United Kingdom is expected to post 14.8% CAGR through 2036 as self-driving passenger services move from trials into regulated use. Floor module demand is expected to favor products that support wheelchair access and inspection-ready interiors.
- Milton Keynes remains relevant because autonomous shuttle and last-mile mobility trials gave suppliers early route experience.
- Coventry and the West Midlands can support floor module demand as automotive suppliers work near public mobility testbeds.
- England’s ZEBRA 2 program adds fleet context after GBP 143 million was allocated for 955 zero emission buses in March 2024.
Competitive Landscape and Strategic Positioning
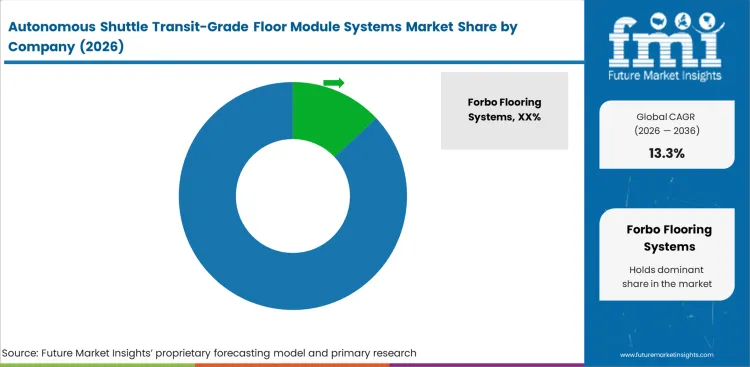
- The market is concentrated around transport flooring knowledge and vehicle module integration rather than standard flooring distribution.
- Large flooring suppliers lead on certified surface ranges and global approvals for bus and rail interiors.
- Vehicle platform suppliers gain influence when floor modules are tied to body structure and underfloor service access.
- Entry barriers include fire testing, slip performance, acoustic behavior and proof that modules survive fleet cleaning cycles.
Key players such as Forbo Flooring Systems, Gerflor and Altro shape the transport flooring side of the market because they already serve bus and rail interiors. Their advantage is in surface performance and certified product ranges. Autonomous shuttle projects add a new requirement because the floor must protect service access and support open cabin movement. Flooring suppliers that partner with module makers can move beyond material supply into validated assemblies.
BENTELER and HOLON influence the platform side because the autonomous shuttle itself is being designed for public service. A floor system that fits body tolerances and ramp geometry becomes part of production planning. Röchling Automotive and Sika focus on material engineering and bonding capability. Vehicle module suppliers are also watching the autonomous vehicles space as shuttle programs move closer to public transport procurement. The robotaxi services outlook remains relevant because pod-style vehicles use similar flat cabin and service access ideas. Material choices connect with automotive composites since lightweight panels help protect range in compact electric shuttle platforms.
Key Companies in the Autonomous Shuttle Transit-Grade Floor Module Systems Market
Competition is best read by role because flooring materials, structural modules and shuttle platforms solve different buyer needs.
- Transport Surface Specialists: Forbo Flooring Systems, Gerflor and Altro focus on transport-approved floor surfaces used in buses, rail and public mobility interiors.
- Vehicle Module and Platform Suppliers: BENTELER, HOLON and Röchling Automotive compete where the floor is tied to body structure and underfloor packaging.
- Material and Bonding Specialists: Sika and other adhesive specialists support the market through bonding, sealing and repair systems.
Competitive Benchmarking: Autonomous Shuttle Transit-Grade Floor Module Systems Market
| Company | Transit Surface Evidence | Module Integration Depth | Service Access Support | Geographic Footprint |
|---|---|---|---|---|
| Forbo Flooring Systems | High | Medium | Medium | Global with Europe depth |
| Gerflor | High | Medium | Medium | Global with transit flooring reach |
| Altro | High | Medium | Medium | Europe and North America |
| BENTELER | Medium | High | Strong | Europe and United States |
| HOLON | Medium | High | Strong | Europe and United States |
| Röchling Automotive | Medium | High | Strong | Global automotive footprint |
| Sika | Low | Strong | Strong | Global bonding and sealing reach |
| nora systems | Medium | Low | Medium | Europe and North America |
Source: Future Market Insights competitive analysis, 2026. Ratings reflect relative positioning based on transit surface evidence, module integration depth and service access support.
Key Developments in Autonomous Shuttle Transit-Grade Floor Module Systems Market
- In July 2024, May Mobility and SouthWest Transit announced autonomous microtransit service in Eden Prairie. The route showed how shuttle cabins move into public transit use.
- In September 2024, HOLON announced its Jacksonville autonomous shuttle plant with completion expected in 2026. The facility raises demand for repeatable floor module assemblies.
- In January 2025, WeRide announced autonomous Robobus deployment at Zurich Airport. Airport routes are relevant because flooring faces rolling bags and frequent boarding cycles.
Key Players in the Autonomous Shuttle Transit-Grade Floor Module Systems Market
Transport Surface Specialists
- Forbo Flooring Systems
- Gerflor
- Altro
- nora systems
Vehicle Module and Platform Suppliers
- BENTELER
- HOLON
- Röchling Automotive
- Material and Bonding Specialists
- Sika
Report Scope and Coverage
| Parameter | Details |
|---|---|
| Quantitative Units | USD 159.4 million in 2026 to USD 554.8 million by 2036, at 13.3% CAGR |
| Market Definition | Modular floor panels and access assemblies made for autonomous public mobility vehicles. |
| Regions Covered | North America, Latin America, Europe, East Asia, South Asia and Pacific, Middle East and Africa |
| Countries Covered | United States, China, India, Germany, Japan, South Korea and United Kingdom, 30+ countries |
| Key Companies Profiled | Forbo Flooring Systems, Gerflor, Altro, BENTELER, HOLON, Röchling Automotive, Sika and nora systems |
| Forecast Period | 2026 to 2036 |
| Approach | Hybrid bottom-up and top-down methodology using shuttle platform counts, module content and public transit policy signals |
Autonomous Shuttle Transit-Grade Floor Module Systems Market by Segments
Autonomous Shuttle Transit-Grade Floor Module Systems Market Segmented by Module Type:
- Composite floor cassettes
- Molded rubber modules
- Ramp floor units
- Service panels
Autonomous Shuttle Transit-Grade Floor Module Systems Market Segmented by Material System:
- Composite sandwich
- Rubberized vinyl
- Aluminum honeycomb
- Recycled polymer
Autonomous Shuttle Transit-Grade Floor Module Systems Market Segmented by Application:
- Passenger saloons
- Entry zones
- Battery covers
- Service access
Autonomous Shuttle Transit-Grade Floor Module Systems Market Segmented by Vehicle Platform:
- Low-speed shuttles
- Airport shuttles
- Robotaxi pods
- Industrial movers
Autonomous Shuttle Transit-Grade Floor Module Systems Market Segmented by Sales Model:
- OEM modules
- Tier-1 kits
- Retrofit modules
- Service parts
Autonomous Shuttle Transit-Grade Floor Module Systems Market Segmented by Installation Format:
- Cassette floors
- Bonded sheets
- Raised floors
- Removable panels
Autonomous Shuttle Transit-Grade Floor Module Systems Market by Region:
- North America
- United States
- Canada
- Mexico
- Latin America
- Brazil
- Chile
- Rest of Latin America
- Western Europe
- Germany
- United Kingdom
- France
- Italy
- Spain
- BENELUX
- Rest of Western Europe
- Eastern Europe
- Poland
- Hungary
- Balkan and Baltic
- Rest of Eastern Europe
- East Asia
- China
- Japan
- South Korea
- South Asia and Pacific
- India
- ASEAN
- Australia and New Zealand
- Rest of South Asia and Pacific
- Middle East and Africa
- Kingdom of Saudi Arabia
- Other GCC Countries
- Turkiye
- South Africa
- Rest of Middle East and Africa
Research Sources and Bibliography
- Federal Transit Administration. (2024, July 9). FY24 FTA competitive bus grants fact sheet. United States Department of Transportation.
- Federal Transit Administration. (2025, May 14). FY 2025 notice of funding opportunity: Low or No Emission Grant Program and Grants for Buses and Bus Facilities Program. United States Department of Transportation.
- United States Department of Transportation. (2025, April 14). Announcing the launch of the Rural Autonomous Vehicle Research Program.
- United States Department of Transportation. (2026, April 3). SMART Grants Program.
- Department for Transport. (2024, March 22). GBP 143 million for better bus journeys as almost a thousand zero emission buses to hit the road. Government of the United Kingdom.
- Department for Transport. (2024, May 20). Self-driving vehicles set to be on roads by 2026 as Automated Vehicles Act becomes law. Government of the United Kingdom.
- European Commission. (2024, May 12). Revised CO2 emission standards for heavy-duty vehicles.
- European Commission. (2025, March 5). Industrial action plan for the European automotive sector.
- State Council of the People’s Republic of China. (2024, October 7). From roads to railways, China builds up strength in transport services.
- National Bureau of Statistics of China. (2026, February 28). Statistical communique of the People’s Republic of China on the 2025 national economic and social development.
- Press Information Bureau. (2026, March 10). e-Bus service. Government of India.
- Press Information Bureau. (2024, December 6). Implementation of e-buses scheme. Government of India.
- Federal Ministry for Digital and Transport. (2025, April 14). The future of driving is autonomous. Government of Germany.
- Ministry of Economy, Trade and Industry. (2024, May 24). Mobility Digital Transformation Strategy formulated. Government of Japan.
- Ministry of Land, Infrastructure, Transport and Tourism. (2025). Summary of the White Paper on Land, Infrastructure, Transport and Tourism in Japan. Government of Japan.
- BENTELER International AG. (2024, February 7). BENTELER is about to secure a multi-million investment for autonomous HOLON Mover.
- BENTELER International AG. (2024, April 8). HOLON and Rhein-Main-Verkehrsverbund cooperate on autonomous mobility.
- BENTELER International AG. (2024, September 4). HOLON to establish autonomous shuttle manufacturing facility in Jacksonville, Florida.
- May Mobility, Inc. (2024, July 8). May Mobility and SouthWest Transit announce first autonomous microtransit service in the Twin Cities area.
- May Mobility, Inc. (2024, October 9). May Mobility and NTT Group collaborate to promote autonomous driving services.
- WeRide Inc. (2025, January 9). WeRide expands European presence with autonomous Robobus shuttle deployment at Zurich Airport.
- WeRide Inc. (2025, March 14). Pioneering autonomous technology drives global expansion and commercialization.
- WeRide Inc. (2025, July 17). WeRide launches Southeast Asia’s first fully driverless Robobus operations at Resorts World Sentosa.
- Toyota Motor Corporation. (2025, September 15). Toyota launches next-generation new mobility e-Palette.
The bibliography uses government, regulatory and official company sources relevant to transit funding, automated vehicle policy, shuttle deployment and vehicle platform signals.
This Report Answers
- What is the current and future size of the Autonomous Shuttle Transit-Grade Floor Module Systems Market?
- How fast is the Autonomous Shuttle Transit-Grade Floor Module Systems Market expected to expand between 2026 and 2036?
- Which module type is projected to lead Autonomous Shuttle Transit-Grade Floor Module Systems Market demand in 2026?
- Which application accounts for the largest floor module demand in autonomous shuttle interiors?
- Why do low-floor electric shuttle layouts raise demand for modular transit-grade floor systems?
- How do fire performance, slip resistance and cleaning cycles affect supplier selection in this market?
- Which countries are expected to record faster demand growth during the forecast period?
- Who are the key companies active in autonomous shuttle floor materials and module systems?
- How does FMI define the Autonomous Shuttle Transit-Grade Floor Module Systems Market scope?
- How does FMI estimate and validate the Autonomous Shuttle Transit-Grade Floor Module Systems Market forecast?
Frequently Asked Questions
What is the global market demand for Autonomous Shuttle Transit-Grade Floor Module Systems Market in 2026?
In 2026, the global Autonomous Shuttle Transit-Grade Floor Module Systems Market is expected to be worth USD 159.4 million as shuttle platforms move toward service-ready cabins.
How big will the Autonomous Shuttle Transit-Grade Floor Module Systems Market be in 2036?
By 2036, the Autonomous Shuttle Transit-Grade Floor Module Systems Market is expected to reach USD 554.8 million as autonomous shuttles gain repeat use in public mobility.
How much is demand for Autonomous Shuttle Transit-Grade Floor Module Systems Market expected to expand between 2026 and 2036?
Demand is projected to expand at 13.3% CAGR from 2026 to 2036 as fleet trials move into planned service programs.
Which module type is expected to lead the Autonomous Shuttle Transit-Grade Floor Module Systems Market by 2026?
Composite floor cassettes are projected to lead module type demand with 46.0% share in 2026 due to weight and assembly advantages.
Which application is expected to lead Autonomous Shuttle Transit-Grade Floor Module Systems Market demand in 2026?
Passenger saloon floors are expected to lead application demand with 48.0% share in 2026 as open cabins need durable walking surfaces.
Which country is forecast to grow fastest in the Autonomous Shuttle Transit-Grade Floor Module Systems Market?
China is expected to expand at 15.1% CAGR through 2036 as robobus trials benefit from electric bus manufacturing depth.
What does the Autonomous Shuttle Transit-Grade Floor Module Systems Market include?
The market includes modular floor panels, ramp floor units, service panels and access assemblies used in autonomous shuttle interiors.
How does FMI estimate the Autonomous Shuttle Transit-Grade Floor Module Systems Market forecast?
FMI uses shuttle platform counts, module content estimates, policy signals, company developments and adjacent vehicle interior checks to validate the forecast.
Preview the report firsthand - request a free sample
Get SampleGet the brochure for pricing and purchase details.
Get PDFTable of Content
- Global Market Outlook
- Demand-side Trends
- Supply-side Trends
- Technology Roadmap Analysis
- Analysis and Recommendations
- Market Overview
- Market Definition / Scope / Limitations
- Research Methodology
- Chapter Orientation
- Analytical Lens and Working Hypotheses
- Market Structure, Signals, and Trend Drivers
- Benchmarking and Cross-market Comparability
- Market Sizing, Forecasting, and Opportunity Mapping
- Research Design and Evidence Framework
- Desk Research Programme (Secondary Evidence)
- Company Annual and Sustainability Reports
- Peer-reviewed Journals and Academic Literature
- Trade Journals, Industry Magazines, and Analyst Briefs
- Conference Proceedings, Webinars, and Seminar Materials
- Government Statistics Portals and Public Data Releases
- Press Releases and Reputable Media Coverage
- Specialist Newsletters and Curated Briefings
- Sector Databases and Reference Repositories
- FMI Internal Proprietary Databases and Historical Market Datasets
- Subscription Datasets and Paid Sources
- Social Channels, Communities, and Digital Listening Inputs
- Additional Desk Sources
- Expert Input and Fieldwork (Primary Evidence)
- Primary Modes
- Qualitative Interviews and Expert Elicitation
- Quantitative Surveys and Structured Data Capture
- Blended Approach
- Why Primary Evidence is Used
- Field Techniques
- Interviews
- Surveys
- Focus Groups
- Observational and In-context Research
- Social and Community Interactions
- Stakeholder Universe Engaged
- C-suite Leaders
- Board Members
- Presidents and Vice Presidents
- R&D and Innovation Heads
- Technical Specialists
- Domain Subject-matter Experts
- Scientists
- Physicians and Other Healthcare Professionals
- Governance, Ethics, and Data Stewardship
- Research Ethics
- Data Integrity and Handling
- Primary Modes
- Tooling, Models, and Reference Databases
- Desk Research Programme (Secondary Evidence)
- Data Engineering and Model Build
- Data Acquisition and Ingestion
- Cleaning, Normalisation, and Verification
- Synthesis, Triangulation, and Analysis
- Demand in Optimistic Scenario
- Demand in Likely Scenario
- Demand in Conservative Scenario
- Opportunity Map Analysis
- Product Life Cycle Analysis
- Supply Chain Analysis
- Investment Feasibility Matrix
- Value Chain Analysis
- PESTLE and Porter’s Analysis
- Regulatory Landscape
- Regional Parent Market Outlook
- Production and Consumption Statistics
- Import and Export Statistics
- Global Market Analysis 2021 to 2025 and Forecast, 2026 to 2036
- Historical Market Size Value (USD Million) Analysis, 2021 to 2025
- Current and Future Market Size Value (USD Million) Projections, 2026 to 2036
- Y-o-Y Growth Trend Analysis
- Absolute $ Opportunity Analysis
- Global Market Pricing Analysis 2021 to 2025 and Forecast 2026 to 2036
- Global Market Analysis 2021 to 2025 and Forecast 2026 to 2036, By Architecture
- Introduction / Key Findings
- Historical Market Size Value (USD Million) Analysis By Architecture , 2021 to 2025
- Current and Future Market Size Value (USD Million) Analysis and Forecast By Architecture , 2026 to 2036
- Structural floors
- Pack carriers
- Skateboard chassis
- Split floors
- Structural floors
- Y-o-Y Growth Trend Analysis By Architecture , 2021 to 2025
- Absolute $ Opportunity Analysis By Architecture , 2026 to 2036
- Global Market Analysis 2021 to 2025 and Forecast 2026 to 2036, By Material System
- Introduction / Key Findings
- Historical Market Size Value (USD Million) Analysis By Material System, 2021 to 2025
- Current and Future Market Size Value (USD Million) Analysis and Forecast By Material System, 2026 to 2036
- Aluminum modules
- Steel hybrids
- Composite inserts
- Multi-material frames
- Aluminum modules
- Y-o-Y Growth Trend Analysis By Material System, 2021 to 2025
- Absolute $ Opportunity Analysis By Material System, 2026 to 2036
- Global Market Analysis 2021 to 2025 and Forecast 2026 to 2036, By Integration Level
- Introduction / Key Findings
- Historical Market Size Value (USD Million) Analysis By Integration Level, 2021 to 2025
- Current and Future Market Size Value (USD Million) Analysis and Forecast By Integration Level, 2026 to 2036
- Pack-to-floor
- Cell-to-pack
- Cell-to-chassis
- Serviceable floor
- Pack-to-floor
- Y-o-Y Growth Trend Analysis By Integration Level, 2021 to 2025
- Absolute $ Opportunity Analysis By Integration Level, 2026 to 2036
- Global Market Analysis 2021 to 2025 and Forecast 2026 to 2036, By Vehicle Type
- Introduction / Key Findings
- Historical Market Size Value (USD Million) Analysis By Vehicle Type, 2021 to 2025
- Current and Future Market Size Value (USD Million) Analysis and Forecast By Vehicle Type, 2026 to 2036
- Passenger cars
- Light vans
- Robotaxis
- Heavy vehicles
- Passenger cars
- Y-o-Y Growth Trend Analysis By Vehicle Type, 2021 to 2025
- Absolute $ Opportunity Analysis By Vehicle Type, 2026 to 2036
- Global Market Analysis 2021 to 2025 and Forecast 2026 to 2036, By Sales Model
- Introduction / Key Findings
- Historical Market Size Value (USD Million) Analysis By Sales Model, 2021 to 2025
- Current and Future Market Size Value (USD Million) Analysis and Forecast By Sales Model, 2026 to 2036
- OEM platform contracts
- Tier-one modules
- Body-shop supply
- Service spares
- OEM platform contracts
- Y-o-Y Growth Trend Analysis By Sales Model, 2021 to 2025
- Absolute $ Opportunity Analysis By Sales Model, 2026 to 2036
- Global Market Analysis 2021 to 2025 and Forecast 2026 to 2036, By Region
- Introduction
- Historical Market Size Value (USD Million) Analysis By Region, 2021 to 2025
- Current Market Size Value (USD Million) Analysis and Forecast By Region, 2026 to 2036
- North America
- Latin America
- Western Europe
- Eastern Europe
- East Asia
- South Asia and Pacific
- Middle East & Africa
- Market Attractiveness Analysis By Region
- North America Market Analysis 2021 to 2025 and Forecast 2026 to 2036, By Country
- Historical Market Size Value (USD Million) Trend Analysis By Market Taxonomy, 2021 to 2025
- Market Size Value (USD Million) Forecast By Market Taxonomy, 2026 to 2036
- By Country
- USA
- Canada
- Mexico
- By Architecture
- By Material System
- By Integration Level
- By Vehicle Type
- By Sales Model
- By Country
- Market Attractiveness Analysis
- By Country
- By Architecture
- By Material System
- By Integration Level
- By Vehicle Type
- By Sales Model
- Key Takeaways
- Latin America Market Analysis 2021 to 2025 and Forecast 2026 to 2036, By Country
- Historical Market Size Value (USD Million) Trend Analysis By Market Taxonomy, 2021 to 2025
- Market Size Value (USD Million) Forecast By Market Taxonomy, 2026 to 2036
- By Country
- Brazil
- Chile
- Rest of Latin America
- By Architecture
- By Material System
- By Integration Level
- By Vehicle Type
- By Sales Model
- By Country
- Market Attractiveness Analysis
- By Country
- By Architecture
- By Material System
- By Integration Level
- By Vehicle Type
- By Sales Model
- Key Takeaways
- Western Europe Market Analysis 2021 to 2025 and Forecast 2026 to 2036, By Country
- Historical Market Size Value (USD Million) Trend Analysis By Market Taxonomy, 2021 to 2025
- Market Size Value (USD Million) Forecast By Market Taxonomy, 2026 to 2036
- By Country
- Germany
- UK
- Italy
- Spain
- France
- Nordic
- BENELUX
- Rest of Western Europe
- By Architecture
- By Material System
- By Integration Level
- By Vehicle Type
- By Sales Model
- By Country
- Market Attractiveness Analysis
- By Country
- By Architecture
- By Material System
- By Integration Level
- By Vehicle Type
- By Sales Model
- Key Takeaways
- Eastern Europe Market Analysis 2021 to 2025 and Forecast 2026 to 2036, By Country
- Historical Market Size Value (USD Million) Trend Analysis By Market Taxonomy, 2021 to 2025
- Market Size Value (USD Million) Forecast By Market Taxonomy, 2026 to 2036
- By Country
- Russia
- Poland
- Hungary
- Balkan & Baltic
- Rest of Eastern Europe
- By Architecture
- By Material System
- By Integration Level
- By Vehicle Type
- By Sales Model
- By Country
- Market Attractiveness Analysis
- By Country
- By Architecture
- By Material System
- By Integration Level
- By Vehicle Type
- By Sales Model
- Key Takeaways
- East Asia Market Analysis 2021 to 2025 and Forecast 2026 to 2036, By Country
- Historical Market Size Value (USD Million) Trend Analysis By Market Taxonomy, 2021 to 2025
- Market Size Value (USD Million) Forecast By Market Taxonomy, 2026 to 2036
- By Country
- China
- Japan
- South Korea
- By Architecture
- By Material System
- By Integration Level
- By Vehicle Type
- By Sales Model
- By Country
- Market Attractiveness Analysis
- By Country
- By Architecture
- By Material System
- By Integration Level
- By Vehicle Type
- By Sales Model
- Key Takeaways
- South Asia and Pacific Market Analysis 2021 to 2025 and Forecast 2026 to 2036, By Country
- Historical Market Size Value (USD Million) Trend Analysis By Market Taxonomy, 2021 to 2025
- Market Size Value (USD Million) Forecast By Market Taxonomy, 2026 to 2036
- By Country
- India
- ASEAN
- Australia & New Zealand
- Rest of South Asia and Pacific
- By Architecture
- By Material System
- By Integration Level
- By Vehicle Type
- By Sales Model
- By Country
- Market Attractiveness Analysis
- By Country
- By Architecture
- By Material System
- By Integration Level
- By Vehicle Type
- By Sales Model
- Key Takeaways
- Middle East & Africa Market Analysis 2021 to 2025 and Forecast 2026 to 2036, By Country
- Historical Market Size Value (USD Million) Trend Analysis By Market Taxonomy, 2021 to 2025
- Market Size Value (USD Million) Forecast By Market Taxonomy, 2026 to 2036
- By Country
- Kingdom of Saudi Arabia
- Other GCC Countries
- Turkiye
- South Africa
- Other African Union
- Rest of Middle East & Africa
- By Architecture
- By Material System
- By Integration Level
- By Vehicle Type
- By Sales Model
- By Country
- Market Attractiveness Analysis
- By Country
- By Architecture
- By Material System
- By Integration Level
- By Vehicle Type
- By Sales Model
- Key Takeaways
- Key Countries Market Analysis
- USA
- Pricing Analysis
- Market Share Analysis, 2025
- By Architecture
- By Material System
- By Integration Level
- By Vehicle Type
- By Sales Model
- Canada
- Pricing Analysis
- Market Share Analysis, 2025
- By Architecture
- By Material System
- By Integration Level
- By Vehicle Type
- By Sales Model
- Mexico
- Pricing Analysis
- Market Share Analysis, 2025
- By Architecture
- By Material System
- By Integration Level
- By Vehicle Type
- By Sales Model
- Brazil
- Pricing Analysis
- Market Share Analysis, 2025
- By Architecture
- By Material System
- By Integration Level
- By Vehicle Type
- By Sales Model
- Chile
- Pricing Analysis
- Market Share Analysis, 2025
- By Architecture
- By Material System
- By Integration Level
- By Vehicle Type
- By Sales Model
- Germany
- Pricing Analysis
- Market Share Analysis, 2025
- By Architecture
- By Material System
- By Integration Level
- By Vehicle Type
- By Sales Model
- UK
- Pricing Analysis
- Market Share Analysis, 2025
- By Architecture
- By Material System
- By Integration Level
- By Vehicle Type
- By Sales Model
- Italy
- Pricing Analysis
- Market Share Analysis, 2025
- By Architecture
- By Material System
- By Integration Level
- By Vehicle Type
- By Sales Model
- Spain
- Pricing Analysis
- Market Share Analysis, 2025
- By Architecture
- By Material System
- By Integration Level
- By Vehicle Type
- By Sales Model
- France
- Pricing Analysis
- Market Share Analysis, 2025
- By Architecture
- By Material System
- By Integration Level
- By Vehicle Type
- By Sales Model
- India
- Pricing Analysis
- Market Share Analysis, 2025
- By Architecture
- By Material System
- By Integration Level
- By Vehicle Type
- By Sales Model
- ASEAN
- Pricing Analysis
- Market Share Analysis, 2025
- By Architecture
- By Material System
- By Integration Level
- By Vehicle Type
- By Sales Model
- Australia & New Zealand
- Pricing Analysis
- Market Share Analysis, 2025
- By Architecture
- By Material System
- By Integration Level
- By Vehicle Type
- By Sales Model
- China
- Pricing Analysis
- Market Share Analysis, 2025
- By Architecture
- By Material System
- By Integration Level
- By Vehicle Type
- By Sales Model
- Japan
- Pricing Analysis
- Market Share Analysis, 2025
- By Architecture
- By Material System
- By Integration Level
- By Vehicle Type
- By Sales Model
- South Korea
- Pricing Analysis
- Market Share Analysis, 2025
- By Architecture
- By Material System
- By Integration Level
- By Vehicle Type
- By Sales Model
- Russia
- Pricing Analysis
- Market Share Analysis, 2025
- By Architecture
- By Material System
- By Integration Level
- By Vehicle Type
- By Sales Model
- Poland
- Pricing Analysis
- Market Share Analysis, 2025
- By Architecture
- By Material System
- By Integration Level
- By Vehicle Type
- By Sales Model
- Hungary
- Pricing Analysis
- Market Share Analysis, 2025
- By Architecture
- By Material System
- By Integration Level
- By Vehicle Type
- By Sales Model
- Kingdom of Saudi Arabia
- Pricing Analysis
- Market Share Analysis, 2025
- By Architecture
- By Material System
- By Integration Level
- By Vehicle Type
- By Sales Model
- Turkiye
- Pricing Analysis
- Market Share Analysis, 2025
- By Architecture
- By Material System
- By Integration Level
- By Vehicle Type
- By Sales Model
- South Africa
- Pricing Analysis
- Market Share Analysis, 2025
- By Architecture
- By Material System
- By Integration Level
- By Vehicle Type
- By Sales Model
- USA
- Market Structure Analysis
- Competition Dashboard
- Competition Benchmarking
- Market Share Analysis of Top Players
- By Regional
- By Architecture
- By Material System
- By Integration Level
- By Vehicle Type
- By Sales Model
- Competition Analysis
- Competition Deep Dive
- CATL
- Overview
- Product Portfolio
- Profitability by Market Segments (Product/Age /Sales Channel/Region)
- Sales Footprint
- Strategy Overview
- Marketing Strategy
- Product Strategy
- Channel Strategy
- BYD Company Limited
- Tesla
- Magna International
- BENTELER International
- Gestamp Automoción
- Hyundai Mobis
- CATL
- Competition Deep Dive
- Assumptions & Acronyms Used


