

- Market Size (2026)
- USD 3.42 Bn
- Forecast (2036)
- USD 19.36 Bn
- CAGR (2026 to 2036)
- 18.9%
Battery-Integrated Vehicle Floor Module Systems Market Size, Market Forecast and Outlook By FMI
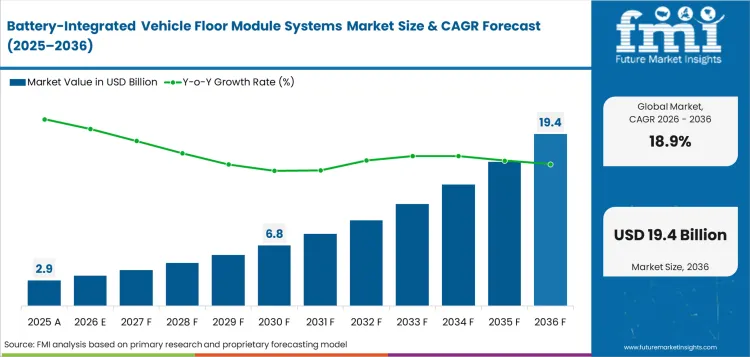
The battery-integrated vehicle floor module systems market was valued at USD 2.88 billion in 2025 and is projected to reach USD 3.42 billion in 2026. It is forecast to reach USD 19.36 billion by 2036 at 18.9% CAGR. Structural floors are projected to lead module architecture with 42.0% share in 2026. Aluminum modules are expected to hold 46.0% share by material system in 2026.
Summary of the Battery-Integrated Vehicle Floor Module Systems Market
- Demand and Growth Drivers
- Electric vehicle platform teams are using floor modules to reduce part count and protect battery packs under side impact loads.
- Market expansion is supported by stricter electric powertrain safety rules and higher battery capacity per vehicle platform.
- Automakers are testing structural battery floors as skateboard platforms move from pilot programs into repeat vehicle launches.
- Supplier selection is tied to crash validation and seal life across China, Europe and North America. Launch support also affects sourcing decisions.
- Product and Segment View
- Structural floors are projected to account for 42.0% share in 2026 due to the fact that automakers seek fewer underbody parts.
- Aluminum modules are forecast to hold 46.0% share in 2026 as weight control remains central to electric range.
- Pack-to-floor systems are expected to account for 39.0% share in 2026 because service access remains important.
- Liquid plate packages are projected to hold 52.0% share as heat control moves closer to floor design.
- Geography and Competitive Outlook
- India is expected to post 22.3% CAGR through 2036 as local electric vehicle programs shift into platform sourcing.
- China is projected to record 21.5% CAGR through 2036 because battery and vehicle production sit close together.
- United States and Germany demand is supported by safety compliance, local assembly and body-in-white engineering depth.
- CATL and BYD shape battery platform work as Magna, BENTELER and Gestamp support body module supply.
- Analyst Opinion
- Nikhil Kaitwade, Principal Consultant at FMI, says, “The market is driven by body engineering than battery design alone. Winning suppliers are expected to be those that deliver integrated floor systems capable of carrying crash loads and low-risk vehicle platform launches not simply supplying standalone battery trays.”
- Battery-Integrated Vehicle Floor Module Systems Market Value Analysis
- Adoption is increasing as electric vehicle platforms move from separate battery packs toward integrated floor structures that combine energy storage and underbody stiffness into a single engineered module.
- Growth is supported by stricter electric‑vehicle safety and validation requirements, which are pushing automakers to source floor modules that deliver proven crash protection and electrical isolation.
- Automakers are accelerating use of battery‑integrated floors to reduce part count and improve platform consistency across multiple vehicle body styles.
- Supplier value is rising as floor modules increasingly integrate thermal routing and sealing features early in the vehicle development cycle, reducing late‑stage design changes and launch risk.
Key Takeaways, Market Size, and Forecast
- The battery-integrated vehicle floor module systems market was valued at USD 2.88 billion in 2025.
- By 2036, the battery-integrated vehicle floor module systems market is projected to reach USD 19.36 billion.
- From 2026 to 2036, the market is projected to expand at 18.9% CAGR.
- The market is projected to create an incremental opportunity of USD 15.94 billion between 2026 and 2036.
- Structural floors are projected to account for 42.0% share in 2026.
- By material system, aluminum modules are expected to account for 46.0% share in 2026.
- India at 22.3% CAGR and China at 21.5% CAGR are forecast to record steady demand through 2036.
Electric vehicle platform design is moving from a separate pack under the body toward a floor system that carries energy and crash loads. The International Energy Agency stated that electric car sales exceeded 20 million units in 2025 and reached about one quarter of global car sales. This changes floor engineering from a body part decision into a battery safety decision.
Regulation is raising the bar for floor-integrated battery protection. The National Highway Traffic Safety Administration published Federal Motor Vehicle Safety Standard 305a in December 2024 for electric-powered vehicles. The rule covers propulsion battery performance and makes verified crash isolation more important for battery housing suppliers.
Supplier activity shows the same direction in vehicle floor systems. Contemporary Amperex Technology Co. Limited launched its Bedrock Chassis in December 2024 and reported a 120 km per hour frontal impact test without fire or explosion. Floor modules that combine battery protection, load paths and thermal routing are becoming a platform choice.
Battery-Integrated Vehicle Floor Module Systems Market Definition
The battery-integrated vehicle floor module systems market covers engineered floor structures that combine battery enclosure with underbody load paths. It also covers thermal routing, sealing and mounting points. Scope includes modules sold for electric passenger cars and light vans. It also covers robotaxis and selected heavy vehicles. Revenue includes structural floor frames and battery tray floors. It also includes crash shields, seal-ready assemblies and thermal plate interfaces supplied for vehicle platform programs.
Battery-Integrated Vehicle Floor Module Systems Market Inclusions
Market scope includes structural battery floors and pack carriers. It also includes skateboard chassis floors and floor modules with integrated battery thermal plates. The study includes seal-ready frames and coolant-ready plates. It also includes crash shields, vent routing and underbody mounting assemblies. Revenue includes original equipment manufacturer platform contracts and Tier-one module supply. Body-shop integrated floor systems are included when supplied as module assemblies.
Battery-Integrated Vehicle Floor Module Systems Market Exclusions
Scope does not include lithium-ion cells or standalone battery modules. It also excludes standard vehicle floor mats and non-structural trim panels. Battery electronics sold alone are excluded, although battery management systems are considered in the interface discussion. Stationary energy storage enclosures and charging infrastructure are outside the revenue base.
Battery-Integrated Vehicle Floor Module Systems Market Research Methodology
- Primary Research: FMI analysts reviewed platform sourcing needs and body engineering requirements. The review also covered module supplier capability and validation expectations in major vehicle countries.
- Desk Research: The study used public data from the International Energy Agency and national vehicle authorities. Transport agencies and company technical releases were reviewed separately.
- Market sizing and forecasting: Market size was estimated through qualifying electric vehicle platforms, estimated module content and structural floor penetration.
- Data validation: Forecast checks compared battery housing values and thermal plate demand. Electric vehicle sales and supplier platform announcements were reviewed separately.
Why is the Battery-Integrated Vehicle Floor Module Systems Market Growing?
- Automakers are using structural floors to reduce separate underbody parts and protect larger battery packs.
- New safety rules are making battery isolation and post-impact protection harder to treat as separate design tasks.
- Suppliers are packaging floor frames with thermal paths and sealing features before vehicle assembly begins.
Battery-integrated floor systems are moving into more electric vehicle programs because vehicles need both energy storage and crash structure in the same underbody area. The International Energy Agency reported that electric car sales exceeded 20 million units in 2025. Higher battery volume turns the floor into a safety boundary, not just a mounting surface. Thermal design pulls floor modules closer to battery system sourcing. Floor module suppliers that combine structural load management with EV thermal systems are better positioned to secure platform bids.
Market Segmentation Analysis
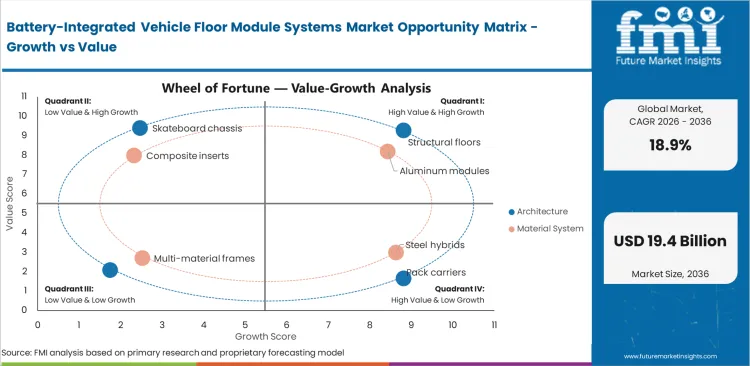
- Structural floors are projected to reach 42.0% share in 2026 as floor load paths become part of battery protection.
- Aluminum modules are expected to represent 46.0% share in 2026 because vehicle range targets reward lower weight.
- Pack-to-floor systems are forecast to account for 39.0% share as automakers balance integration with service access.
- Passenger cars are projected to capture 68.0% share in 2026 because high-volume electric platforms need repeat supply.
- Liquid plate packages are estimated to hold 52.0% share as cooling performance becomes part of floor design.
- Original equipment manufacturer platform contracts are projected to account for 57.0% share in 2026.
The market is divided into six primary segment groups based on module architecture and material system. It also covers integration level and vehicle type. Thermal safety package and sales model complete the segmentation view. Module architecture explains how the floor carries battery mass and crash load. Material system reflects weight and weldability. It also reflects corrosion control. Integration level shows how far the battery pack is built into the body floor.
Insights into the Structural Floors Module Architecture Segment
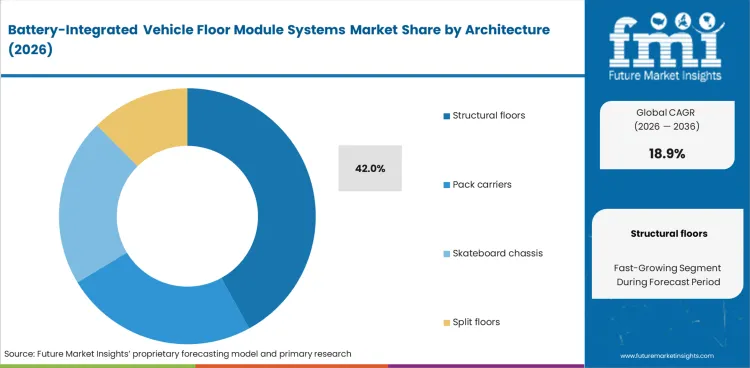
- Structural floors are projected to account for 42.0% share of module architecture demand in 2026. These systems carry battery mass and underbody loads through the same engineered floor frame.
- Pack carriers remain useful where automakers want battery service access. Skateboard chassis designs gain attention in programs that share one floor layout across body styles.
Insights into the Aluminum Modules Material System Segment
- Aluminum modules are expected to account for 46.0% share of material system demand in 2026. The material gives weight savings that help offset larger pack mass.
- Steel hybrids remain important where cost and crash stiffness matter more than range. Composite inserts are used around insulation, impact zones and corrosion control.
Insights into the Pack-to-Floor Integration Level Segment
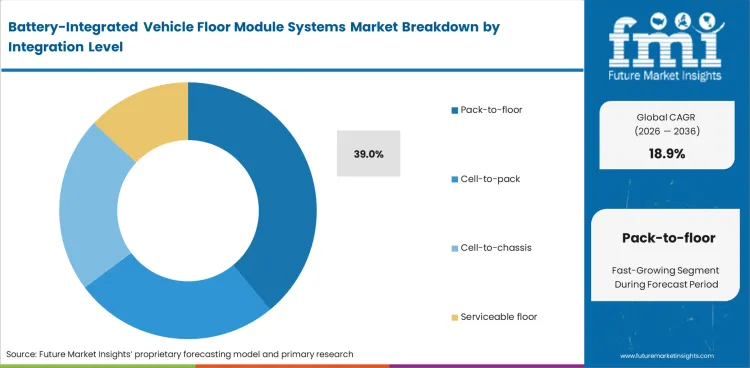
- Pack-to-floor systems are projected to account for 39.0% share of integration level demand in 2026. Automakers use this route when they need structure and repair access together.
- Cell-to-chassis systems have a longer qualification path because service and crash repair questions are harder. Cell-to-pack designs remain a bridge for current platforms.
Insights into the Passenger Cars Vehicle Type Segment
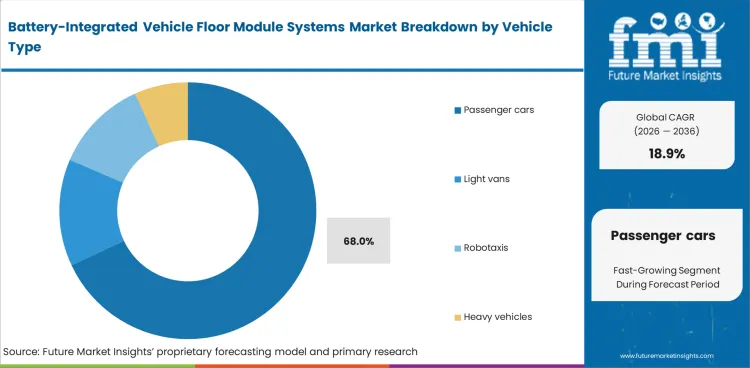
- Passenger cars are forecast to account for 68.0% share of vehicle type demand in 2026. High-volume electric car platforms create the largest repeat need for floor modules.
- Light vans use stronger floor modules because battery packs sit under cargo areas. Robotaxis may shift future demand toward flat floors and easier cabin reconfiguration.
Insights into the Liquid Plates Thermal Safety Package Segment
- Liquid plate packages are estimated to account for 52.0% share of thermal safety package demand in 2026. Cooling plates are moving closer to floor system engineering.
- Battery safety vents and fire barrier pads gain value where packs sit within the passenger floor envelope. Suppliers must show how heat and gases leave the module safely.
Insights into the OEM Platform Contracts Sales Model Segment
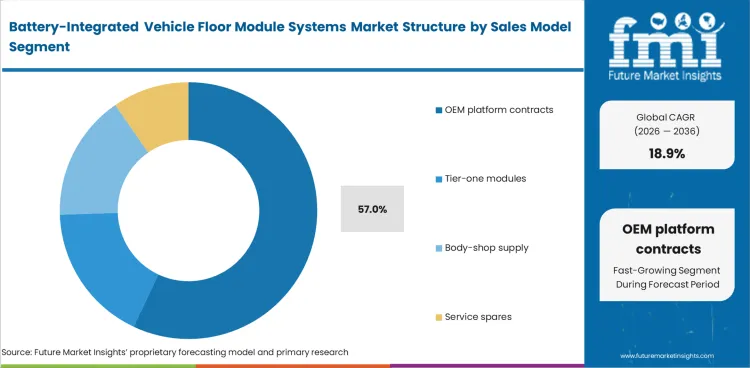
- Original equipment manufacturer platform contracts are projected to account for 57.0% share of sales model demand in 2026. Floor modules are specified before tooling decisions close.
- Tier-one module supply remains important for regional launches and low-volume variants. Body-shop supply grows when floor structures are welded or bonded near vehicle assembly.
Battery-Integrated Vehicle Floor Module Systems Market Drivers, Restraints, and Opportunities
- Battery pack mass is raising the need for floors that carry load and protect cells during crash events.
- Long validation cycles slow sourcing because floor modules affect crash tests and assembly sequence.
- Thermal and sealing packages create room for suppliers that can deliver validated modules before body tooling closes.
Battery-integrated floors are expanding because high-capacity packs occupy the same underbody space that once handled basic floor stiffness. The National Highway Traffic Safety Administration finalized Federal Motor Vehicle Safety Standard 305a in December 2024. This adds pressure for verified electric powertrain protection and makes floor module validation a purchase requirement. The primary restraint limiting adoption is the time needed to prove crash load paths and seal life before vehicle launch. Floor modules touch battery safety and body integrity, so design changes late in the program can raise cost sharply.
Thermal Sealing Creates Supplier Value
Supplier opportunity is present in modules that combine sealing and coolant interfaces into a ready assembly. Thermal interface materials and battery safety vents are becoming integral to battery‑integrated floor module design, as suppliers embed heat transfer control and controlled gas‑release pathways directly into the floor structure to manage thermal loads and protect the passenger compartment during abnormal events.
Analysis of Battery-Integrated Vehicle Floor Module Systems Market by Key Countries
.webp "Top Country Growth Comparison Battery Integrated Vehicle Floor Module Systems Market Cagr (2026 2036)")
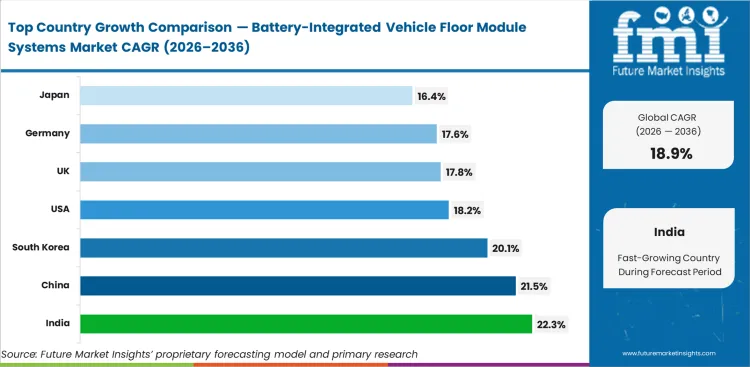
| Country | CAGR |
|---|---|
| China | 21.5% |
| India | 22.3% |
| South Korea | 20.1% |
| United States | 18.2% |
| Germany | 17.6% |
| United Kingdom | 17.8% |
| Japan | 16.4% |
Source: Future Market Insights, 2026.
Battery-Integrated Vehicle Floor Module Systems Market CAGR Analysis by Country
- India is expected to post 22.3% CAGR through 2036 as electric mobility schemes expand platform sourcing depth.
- China is projected to record 21.5% CAGR through 2036 because battery and vehicle production remain tightly linked.
- South Korea is expected to expand at 20.1% CAGR through 2036 as battery suppliers and vehicle makers work close together.
- The United States is forecast to grow at 18.2% CAGR through 2036 as safety rules and local assembly guide sourcing.
- Germany and the United Kingdom are forecast below China and India because platform conversion is steady but plant changes are slower.
Country-level demand is forecast to follow electric vehicle production depth, battery supply access and safety validation needs. China and India are above the global rate because local scale and policy support shorten the path from prototype floor modules to repeat platform supply.
Sales Analysis of Battery-Integrated Vehicle Floor Module Systems in China
China combines vehicle assembly scale with battery supply depth, which makes it the fastest large-country route for integrated floor modules. The National Bureau of Statistics of China reported 16.524 million new energy vehicles in 2025 and a 25.1% output rise. China is projected to record a 21.5% CAGR through 2036 as platform programs move toward battery-body integration. Suppliers that can serve Hefei, Shenzhen and Chongqing with local validation support will hold stronger launch access.
- Hefei battery and vehicle clusters support faster trials for structural floors near local pack lines.
- Shenzhen module buyers can test sealing and vent routing close to battery suppliers.
- Chongqing vehicle plants create volume routes for body-shop supplied floor modules once platform tools are fixed.
Demand Outlook for Battery-Integrated Vehicle Floor Module Systems in India
India is moving from electric two-wheelers into higher local content needs for electric cars and light vehicles. India is expected to post 22.3% CAGR through 2036 as the PM E-DRIVE scheme supports electric mobility with an INR 10,900 crore outlay through March 2026. Local floor module demand will remain uneven until more passenger vehicle platforms are tooled in India. Suppliers that offer modular designs can serve early programs before full local integration arrives.
- Gujarat battery and vehicle investments create a route for localized floor carrier supply.
- Tamil Nadu electric vehicle plants can use pack-to-floor modules where service access remains important.
- Pune engineering teams will need crash and corrosion proof before moving to deeper floor integration.
Opportunity Analysis of Battery-Integrated Vehicle Floor Module Systems in South Korea
South Korea has a compact supplier base where battery makers and vehicle manufacturers work within short engineering loops. South Korea is expected to expand at 20.1% CAGR through 2036 because local battery knowledge supports platform tests. The United States International Trade Administration reported 407,009 electric vehicles produced in South Korea in 2025. This production base supports floor modules that combine pack enclosure knowledge with body validation.
- Gyeonggi suppliers can link battery tray design with vehicle floor crash proof during early program work.
- Ulsan vehicle plants can convert underbody modules into repeat supply once launch timing is clear.
- Cheonan battery-related sites support thermal plate and sealing package validation for integrated floors.
Demand Outlook for Battery-Integrated Vehicle Floor Module Systems in the United States
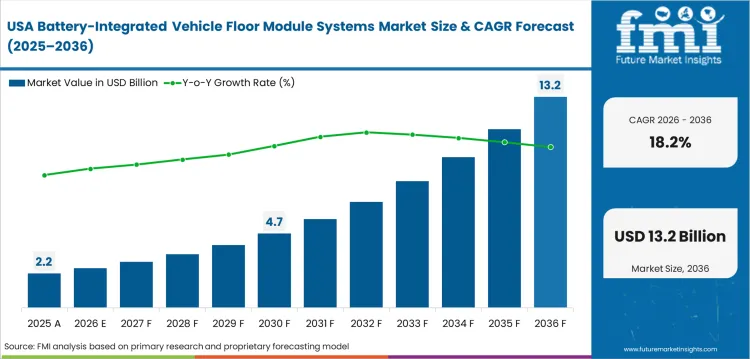
United States automakers are reviewing floor integration through the lens of safety compliance and local plant readiness. The United States is forecast to grow at 18.2% CAGR through 2036 as Federal Motor Vehicle Safety Standard 305a changes electric powertrain protection expectations. The United States Energy Information Administration reported that hybrid, battery electric and plug-in hybrid vehicles made up about 22% of new light-duty sales in 2025. The United States remains close to the global rate because validation needs are high but platform decisions move carefully.
- Michigan body and battery plants create demand for crash-tested floor modules tied to local programs.
- Tennessee and Kentucky facilities can use pack carriers where flexible assembly supports mixed powertrain output.
- California design teams influence early platform choices even when volume assembly occurs in other states.
Future Outlook for Battery-Integrated Vehicle Floor Module Systems in Germany
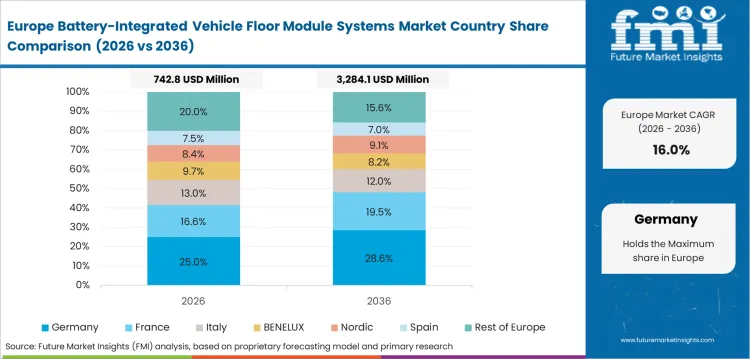
German buyers usually compare module suppliers on crash data, weld consistency and corrosion proof before cost. The German Federal Motor Transport Authority reported 545,142 battery electric passenger car registrations in 2025 with a 43.2% annual rise. Germany is expected to advance at 17.6% CAGR through 2036 because electric platform conversion is deep but qualification cycles remain strict.
- Bavaria engineering centers support early design work for structural floors and coolant-ready plates.
- Lower Saxony vehicle plants can use validated pack carriers during model change cycles.
- Saxony electric vehicle output gives suppliers a route for aluminum floor module trials.
Sales Analysis of Battery-Integrated Vehicle Floor Module Systems in the United Kingdom
United Kingdom demand is tied to zero-emission rules and smaller platform programs with higher engineering content per vehicle. The Department for Transport reported 473,000 zero-emission cars first registered in 2025 and a 23% new car share. The United Kingdom is forecast at 17.8% CAGR through 2036 as the zero emission vehicle mandate supports battery platform planning. Faster conversion depends on battery supply depth and local underbody module capacity.
- Midlands engineering firms can support prototype floors before larger European sourcing decisions are made.
- Oxford and Sunderland plants can use integrated floor modules where battery pack layout affects vehicle mix.
- Zero-emission fleet targets raise interest in serviceable floors for vans and passenger vehicles.
Future Outlook for Battery-Integrated Vehicle Floor Module Systems in Japan
Japan has strong battery quality controls and careful platform approval processes, which slow near-term floor integration. Japan is projected to rise at 16.4% CAGR through 2036 as automakers shift more electric programs into dedicated platforms. Panasonic Energy finalized preparations for 4680 cell mass production at Wakayama in September 2024. The country’s growth is below the global rate because hybrid platforms still influence floor design decisions.
- Wakayama battery activity supports testing of larger cell formats and floor packaging needs.
- Toyota City engineering teams can evaluate serviceable floor modules for mixed platform strategies.
- Kanagawa suppliers can support sealing, coolant and crash interface packages for high-specification programs.
Competitive Landscape and Strategic Positioning
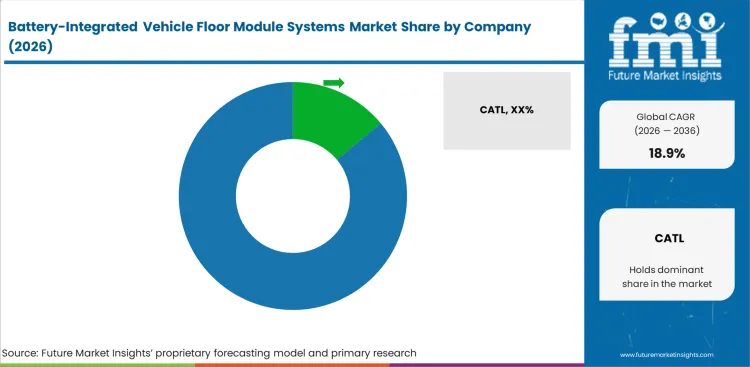
- Competition is grouped around battery-centered platform integrators, body module suppliers and electrification system firms.
- CATL and BYD influence platform thinking because they connect battery pack design with vehicle floor architecture.
- Magna, BENTELER and Gestamp compete through body structure know-how and crash validation. Regional launch support adds another selection filter.
- Entry barriers include crash proof and sealing life. Coolant routing and plant-level fit with body assembly add further qualification work.
Competition is defined by the ability to deliver crash‑validated, production‑ready integrated floor modules rather than standalone components, with CATL and BENTELER shaping capabilities across battery integration and manufacturing scale. For instance, CATL is shaping the technology direction through chassis-level battery integration. Its Bedrock Chassis launch in December 2024 moved the discussion from battery tray supply toward crash-tested floor architecture. That type of proof matters because automakers need evidence before they place the battery inside the structural floor path.
Body and enclosure suppliers compete on different strengths. Magna highlighted OptiForm in April 2025 and said the one-piece battery enclosure can increase available battery space by up to 10%. BENTELER added paint and e-mobility capacity in Germany and the United States during 2024. These moves show that floor module competition depends on production readiness as much as design ideas. Buyers judge suppliers on the ability to pass crash tests and support assembly with low late-stage change risk. Products such as pressure equalization membranes and battery pack sealants matter because small failures can affect the whole floor system. Suppliers that control these interfaces can defend price better than metal-only component makers.
Key Companies in the Battery-Integrated Vehicle Floor Module Systems Market
Competition is best read by supplier role because battery control, underbody structure and module assembly require different capability sets.
- Battery-Centered Platform Integrators: Contemporary Amperex Technology Co. Limited and BYD Company Limited connect pack design with floor-level architecture. Tesla also shapes the category through structural battery pack design and platform integration experience.
- Body and Enclosure Module Suppliers: Magna, BENTELER and Gestamp bring underbody stamping and aluminum forming to integrated floor work. Their strengths also include crash validation depth.
- Electrification Module Specialists: Hyundai Mobis supports battery system assembly and vehicle electrification programs. Panasonic Energy remains an adjacent cell-format enabler through larger cylindrical cell production.
Competitive Benchmarking: Battery-Integrated Vehicle Floor Module Systems Market
| Company | Floor Integration Depth | Crash Validation Support | Thermal Sealing Capability | Geographic Footprint |
|---|---|---|---|---|
| CATL | High | Strong | Strong | Global with China platform depth and CIIC chassis activity |
| BYD Company Limited | High | Strong | Medium | China centered with vehicle and battery integration depth |
| Tesla | High | Strong | Medium | United States centered with structural pack experience |
| Magna International | Medium | Strong | Strong | Global with battery enclosure and body systems footprint |
| BENTELER International | Medium | Strong | Strong | Europe and North America with EV component plants |
| Gestamp Automoción | Medium | Strong | Medium | Europe centered with global body structure supply |
| Hyundai Mobis | Medium | Medium | Strong | South Korea centered with global electrification supply |
Key Developments in the Battery-Integrated Vehicle Floor Module Systems Market
- In December 2024, Contemporary Amperex Technology Co. Limited launched the Bedrock Chassis and cited a 120 km per hour frontal impact test result.
- In June 2024, Contemporary Amperex Technology Co. Limited and BAIC Group agreed to develop next-generation CIIC skateboard chassis work for pure electric vehicle platforms.
- In April 2025, Magna highlighted OptiForm as a one-piece battery enclosure design that can increase available battery space by up to 10%.
- In September 2024, Panasonic Energy finalized preparations for 4680 automotive lithium-ion battery mass production at its Wakayama factory.
Key Players in the Battery-Integrated Vehicle Floor Module Systems Market
- Contemporary Amperex Technology Co. Limited
- BYD Company Limited
- Tesla
- Magna International
- BENTELER International
- Gestamp Automoción
- Hyundai Mobis
- Panasonic Energy
Report Scope and Coverage
| Item | Value |
|---|---|
| Quantitative Units | Revenue in USD billion, CAGR in percent and segment share in percent |
| Market Definition | Battery-integrated vehicle floor module systems for electric vehicle platform structures |
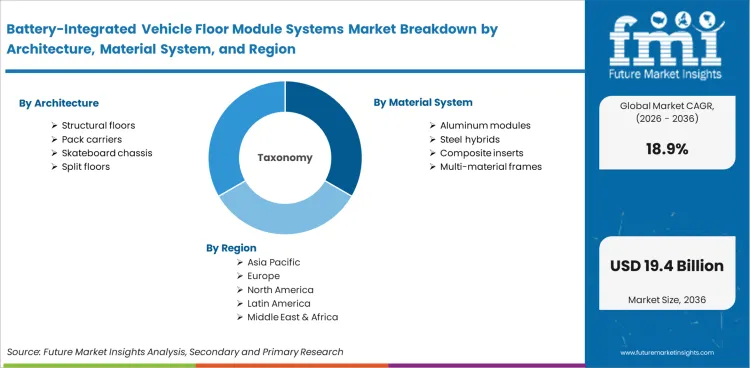
| Module Architecture | Structural floors, pack carriers, skateboard chassis and split floors |
| Material System | Aluminum modules, steel hybrids, composite inserts and multi-material frames |
| Integration Level | Pack-to-floor, cell-to-pack, cell-to-chassis and serviceable floor |
| Vehicle Type | Passenger cars, light vans, robotaxis and heavy vehicles |
| Thermal Safety Package | Liquid plates, crash shields, vent isolation and dry interfaces |
| Sales Model | OEM platform contracts, Tier-one modules, body-shop supply and service spares |
| Regions Covered | North America, Latin America, Europe, East Asia, South Asia, Oceania and Middle East and Africa |
| Countries Covered | United States, China, India, Germany, Japan, South Korea and United Kingdom |
| Key Companies Profiled | CATL, BYD, Tesla, Magna, BENTELER, Gestamp and Hyundai Mobis |
| Forecast Period | 2026 to 2036 |
| Approach | Bottom-up vehicle platform model triangulated with public EV sales, supplier activity and adjacent FMI categories |
Market Breakdown by Segments and Region
By Module Architecture
- Structural floors
- Pack carriers
- Skateboard chassis
- Split floors
By Material System
- Aluminum modules
- Steel hybrids
- Composite inserts
- Multi-material frames
By Integration Level
- Pack-to-floor
- Cell-to-pack
- Cell-to-chassis
- Serviceable floor
By Vehicle Type
- Passenger cars
- Light vans
- Robotaxis
- Heavy vehicles
By Thermal Safety Package
- Liquid plates
- Crash shields
- Vent isolation
- Dry interfaces
By Sales Model
- OEM platform contracts
- Tier-one modules
- Body-shop supply
- Service spares
By Region
- North America
- Latin America
- Europe
- East Asia
- South Asia
- Oceania
- Middle East and Africa
Research Sources and Bibliography
- International Energy Agency. (2026, May). Global EV Outlook 2026: Trends in electric cars.
- Contemporary Amperex Technology Co. Limited. (2024, June). CATL Works with BAIC Group to Develop Skateboard Chassis.
- National Highway Traffic Safety Administration. (2024, December). Federal Motor Vehicle Safety Standards and FMVSS No. 305a electric-powered vehicles.
- National Bureau of Statistics of China. (2026, February). Statistical communiqué of the People’s Republic of China on the 2025 national economic and social development.
- United States Energy Information Administration. (2026, January). Electric vehicle sales fell as hybrid vehicle sales continued to rise in 2025.
- United Kingdom Department for Transport. (2026, April). Vehicle licensing statistics: United Kingdom 2025.
- German Federal Motor Transport Authority. (2026, January). New registrations of passenger cars by selected alternative drive systems in 2025.
- Government of India Press Information Bureau. (2025, April). The Ministry of Heavy Industries has successfully achieved sales of more than one million of EVs in this Financial Year 2024-25.
- Contemporary Amperex Technology Co. Limited. (2024, December). CATL Launches the Bedrock Chassis That Withstands 120 km/h Impact Without Catching Fire or Exploding.
- Magna International. (2025, April). Magna innovations recognized at PACEpilot awards.
- BENTELER International. (2024, December). BENTELER strengthens United States presence with new e-mobility plant.
- Panasonic Energy. (2024, September). Panasonic Energy prepares for mass production of 4680 automotive lithium-ion batteries.
- United States International Trade Administration. (2025, July). South Korea Electric Vehicles EV Market.
- BENTELER International. (2024, June). BENTELER inaugurates energy-efficient paint line at its Schwandorf site.
This Report Answers
- What is the 2026 to 2036 valuation outlook for battery-integrated vehicle floor module systems?
- Which module architecture accounts for the highest share of demand in 2026?
- Which material system is expected to lead buyer selection during the forecast period?
- Which countries offer faster demand expansion for integrated electric vehicle floor modules?
- How do crash validation, sealing proof and thermal routing affect supplier selection?
- Which companies are active in floor-integrated battery structure and body module supply?
Frequently Asked Questions
What is the Battery-Integrated Vehicle Floor Module Systems Market?
It covers vehicle floor modules that combine battery enclosure with crash load path and thermal interface in one platform structure.
How large is the Battery-Integrated Vehicle Floor Module Systems Market in 2026?
The market is projected to reach USD 3.42 billion in 2026 based on electric vehicle platform demand and module content.
What is the forecast value of the Battery-Integrated Vehicle Floor Module Systems Market by 2036?
The market is projected to reach USD 19.36 billion by 2036 as more electric platforms use battery-integrated floors.
Which segment leads the Battery-Integrated Vehicle Floor Module Systems Market?
Structural floors lead module architecture with 42.0% share in 2026 because battery protection is moving into underbody structure.
Which country grows fastest in the Battery-Integrated Vehicle Floor Module Systems Market?
India records the fastest forecast at 22.3% CAGR through 2036 as local electric mobility programs support platform sourcing.
Who are the key companies in the Battery-Integrated Vehicle Floor Module Systems Market?
Key companies include CATL and BYD on the battery side. Magna and BENTELER support body systems with Gestamp and Hyundai Mobis.
Preview the report firsthand - request a free sample
Get SampleGet the brochure for pricing and purchase details.
Get PDFTable of Content
- Executive Summary
- Global Market Outlook
- Demand-side Trends
- Supply-side Trends
- Technology Roadmap Analysis
- Analysis and Recommendations
- Market Overview
- Market Coverage / Taxonomy
- Market Definition / Scope / Limitations
- Research Methodology
- Chapter Orientation
- Analytical Lens and Working Hypotheses
- Market Structure, Signals, and Trend Drivers
- Benchmarking and Cross-market Comparability
- Market Sizing, Forecasting, and Opportunity Mapping
- Research Design and Evidence Framework
- Desk Research Programme (Secondary Evidence)
- Company Annual and Sustainability Reports
- Peer-reviewed Journals and Academic Literature
- Corporate Websites, Product Literature, and Technical Notes
- Earnings Decks and Investor Briefings
- Statutory Filings and Regulatory Disclosures
- Technical White Papers and Standards Notes
- Trade Journals, Industry Magazines, and Analyst Briefs
- Conference Proceedings, Webinars, and Seminar Materials
- Government Statistics Portals and Public Data Releases
- Press Releases and Reputable Media Coverage
- Specialist Newsletters and Curated Briefings
- Sector Databases and Reference Repositories
- FMI Internal Proprietary Databases and Historical Market Datasets
- Subscription Datasets and Paid Sources
- Social Channels, Communities, and Digital Listening Inputs
- Additional Desk Sources
- Expert Input and Fieldwork (Primary Evidence)
- Primary Modes
- Qualitative Interviews and Expert Elicitation
- Quantitative Surveys and Structured Data Capture
- Blended Approach
- Why Primary Evidence is Used
- Field Techniques
- Interviews
- Surveys
- Focus Groups
- Observational and In-context Research
- Social and Community Interactions
- Stakeholder Universe Engaged
- C-suite Leaders
- Board Members
- Presidents and Vice Presidents
- R&D and Innovation Heads
- Technical Specialists
- Domain Subject-matter Experts
- Scientists
- Physicians and Other Healthcare Professionals
- Governance, Ethics, and Data Stewardship
- Research Ethics
- Data Integrity and Handling
- Primary Modes
- Tooling, Models, and Reference Databases
- Desk Research Programme (Secondary Evidence)
- Data Engineering and Model Build
- Data Acquisition and Ingestion
- Cleaning, Normalisation, and Verification
- Synthesis, Triangulation, and Analysis
- Quality Assurance and Audit Trail
- Market Background
- Market Dynamics
- Drivers
- Restraints
- Opportunity
- Trends
- Scenario Forecast
- Demand in Optimistic Scenario
- Demand in Likely Scenario
- Demand in Conservative Scenario
- Opportunity Map Analysis
- Product Life Cycle Analysis
- Supply Chain Analysis
- Investment Feasibility Matrix
- Value Chain Analysis
- PESTLE and Porter’s Analysis
- Regulatory Landscape
- Regional Parent Market Outlook
- Production and Consumption Statistics
- Import and Export Statistics
- Market Dynamics
- Global Market Analysis 2021 to 2025 and Forecast, 2026 to 2036
- Historical Market Size Value (USD Million) Analysis, 2021 to 2025
- Current and Future Market Size Value (USD Million) Projections, 2026 to 2036
- Y-o-Y Growth Trend Analysis
- Absolute $ Opportunity Analysis
- Global Market Pricing Analysis 2021 to 2025 and Forecast 2026 to 2036
- Global Market Analysis 2021 to 2025 and Forecast 2026 to 2036, By Material Type
- Introduction / Key Findings
- Historical Market Size Value (USD Million) Analysis By Material Type , 2021 to 2025
- Current and Future Market Size Value (USD Million) Analysis and Forecast By Material Type , 2026 to 2036
- Recycled polymers
- Bio-based foams
- Natural fibers
- Low-carbon coatings
- Recycled polymers
- Y-o-Y Growth Trend Analysis By Material Type , 2021 to 2025
- Absolute $ Opportunity Analysis By Material Type , 2026 to 2036
- Global Market Analysis 2021 to 2025 and Forecast 2026 to 2036, By Application
- Introduction / Key Findings
- Historical Market Size Value (USD Million) Analysis By Application, 2021 to 2025
- Current and Future Market Size Value (USD Million) Analysis and Forecast By Application, 2026 to 2036
- Seats
- Door panels
- Instrument panels
- Headliners
- Floor systems
- Seats
- Y-o-Y Growth Trend Analysis By Application, 2021 to 2025
- Absolute $ Opportunity Analysis By Application, 2026 to 2036
- Global Market Analysis 2021 to 2025 and Forecast 2026 to 2036, By Vehicles Program
- Introduction / Key Findings
- Historical Market Size Value (USD Million) Analysis By Vehicles Program, 2021 to 2025
- Current and Future Market Size Value (USD Million) Analysis and Forecast By Vehicles Program, 2026 to 2036
- Electric passenger vehicles
- Internal combustion passenger vehicles
- Premium programs
- Commercial vehicles
- Robotaxi platforms
- Electric passenger vehicles
- Y-o-Y Growth Trend Analysis By Vehicles Program, 2021 to 2025
- Absolute $ Opportunity Analysis By Vehicles Program, 2026 to 2036
- Global Market Analysis 2021 to 2025 and Forecast 2026 to 2036, By Certification
- Introduction / Key Findings
- Historical Market Size Value (USD Million) Analysis By Certification, 2021 to 2025
- Current and Future Market Size Value (USD Million) Analysis and Forecast By Certification, 2026 to 2036
- Third-party LCA
- Mass balance
- Recycled proof
- OEM validation
- Third-party LCA
- Y-o-Y Growth Trend Analysis By Certification, 2021 to 2025
- Absolute $ Opportunity Analysis By Certification, 2026 to 2036
- Global Market Analysis 2021 to 2025 and Forecast 2026 to 2036, By Supply
- Introduction / Key Findings
- Historical Market Size Value (USD Million) Analysis By Supply, 2021 to 2025
- Current and Future Market Size Value (USD Million) Analysis and Forecast By Supply, 2026 to 2036
- Tier-one bundled supply
- Direct material supply
- Joint development contracts
- Tier-one bundled supply
- Y-o-Y Growth Trend Analysis By Supply, 2021 to 2025
- Absolute $ Opportunity Analysis By Supply, 2026 to 2036
- Global Market Analysis 2021 to 2025 and Forecast 2026 to 2036, By Processing Route
- Introduction / Key Findings
- Historical Market Size Value (USD Million) Analysis By Processing Route, 2021 to 2025
- Current and Future Market Size Value (USD Million) Analysis and Forecast By Processing Route, 2026 to 2036
- Mechanical recycling
- Chemical recycling
- Bio-based feedstock
- Mono-material design
- Mechanical recycling
- Y-o-Y Growth Trend Analysis By Processing Route, 2021 to 2025
- Absolute $ Opportunity Analysis By Processing Route, 2026 to 2036
- Global Market Analysis 2021 to 2025 and Forecast 2026 to 2036, By Region
- Introduction
- Historical Market Size Value (USD Million) Analysis By Region, 2021 to 2025
- Current Market Size Value (USD Million) Analysis and Forecast By Region, 2026 to 2036
- North America
- Latin America
- Western Europe
- Eastern Europe
- East Asia
- South Asia and Pacific
- Middle East & Africa
- Market Attractiveness Analysis By Region
- North America Market Analysis 2021 to 2025 and Forecast 2026 to 2036, By Country
- Historical Market Size Value (USD Million) Trend Analysis By Market Taxonomy, 2021 to 2025
- Market Size Value (USD Million) Forecast By Market Taxonomy, 2026 to 2036
- By Country
- USA
- Canada
- Mexico
- By Material Type
- By Application
- By Vehicles Program
- By Certification
- By Supply
- By Processing Route
- By Country
- Market Attractiveness Analysis
- By Country
- By Material Type
- By Application
- By Vehicles Program
- By Certification
- By Supply
- By Processing Route
- Key Takeaways
- Latin America Market Analysis 2021 to 2025 and Forecast 2026 to 2036, By Country
- Historical Market Size Value (USD Million) Trend Analysis By Market Taxonomy, 2021 to 2025
- Market Size Value (USD Million) Forecast By Market Taxonomy, 2026 to 2036
- By Country
- Brazil
- Chile
- Rest of Latin America
- By Material Type
- By Application
- By Vehicles Program
- By Certification
- By Supply
- By Processing Route
- By Country
- Market Attractiveness Analysis
- By Country
- By Material Type
- By Application
- By Vehicles Program
- By Certification
- By Supply
- By Processing Route
- Key Takeaways
- Western Europe Market Analysis 2021 to 2025 and Forecast 2026 to 2036, By Country
- Historical Market Size Value (USD Million) Trend Analysis By Market Taxonomy, 2021 to 2025
- Market Size Value (USD Million) Forecast By Market Taxonomy, 2026 to 2036
- By Country
- Germany
- UK
- Italy
- Spain
- France
- Nordic
- BENELUX
- Rest of Western Europe
- By Material Type
- By Application
- By Vehicles Program
- By Certification
- By Supply
- By Processing Route
- By Country
- Market Attractiveness Analysis
- By Country
- By Material Type
- By Application
- By Vehicles Program
- By Certification
- By Supply
- By Processing Route
- Key Takeaways
- Eastern Europe Market Analysis 2021 to 2025 and Forecast 2026 to 2036, By Country
- Historical Market Size Value (USD Million) Trend Analysis By Market Taxonomy, 2021 to 2025
- Market Size Value (USD Million) Forecast By Market Taxonomy, 2026 to 2036
- By Country
- Russia
- Poland
- Hungary
- Balkan & Baltic
- Rest of Eastern Europe
- By Material Type
- By Application
- By Vehicles Program
- By Certification
- By Supply
- By Processing Route
- By Country
- Market Attractiveness Analysis
- By Country
- By Material Type
- By Application
- By Vehicles Program
- By Certification
- By Supply
- By Processing Route
- Key Takeaways
- East Asia Market Analysis 2021 to 2025 and Forecast 2026 to 2036, By Country
- Historical Market Size Value (USD Million) Trend Analysis By Market Taxonomy, 2021 to 2025
- Market Size Value (USD Million) Forecast By Market Taxonomy, 2026 to 2036
- By Country
- China
- Japan
- South Korea
- By Material Type
- By Application
- By Vehicles Program
- By Certification
- By Supply
- By Processing Route
- By Country
- Market Attractiveness Analysis
- By Country
- By Material Type
- By Application
- By Vehicles Program
- By Certification
- By Supply
- By Processing Route
- Key Takeaways
- South Asia and Pacific Market Analysis 2021 to 2025 and Forecast 2026 to 2036, By Country
- Historical Market Size Value (USD Million) Trend Analysis By Market Taxonomy, 2021 to 2025
- Market Size Value (USD Million) Forecast By Market Taxonomy, 2026 to 2036
- By Country
- India
- ASEAN
- Australia & New Zealand
- Rest of South Asia and Pacific
- By Material Type
- By Application
- By Vehicles Program
- By Certification
- By Supply
- By Processing Route
- By Country
- Market Attractiveness Analysis
- By Country
- By Material Type
- By Application
- By Vehicles Program
- By Certification
- By Supply
- By Processing Route
- Key Takeaways
- Middle East & Africa Market Analysis 2021 to 2025 and Forecast 2026 to 2036, By Country
- Historical Market Size Value (USD Million) Trend Analysis By Market Taxonomy, 2021 to 2025
- Market Size Value (USD Million) Forecast By Market Taxonomy, 2026 to 2036
- By Country
- Kingdom of Saudi Arabia
- Other GCC Countries
- Turkiye
- South Africa
- Other African Union
- Rest of Middle East & Africa
- By Material Type
- By Application
- By Vehicles Program
- By Certification
- By Supply
- By Processing Route
- By Country
- Market Attractiveness Analysis
- By Country
- By Material Type
- By Application
- By Vehicles Program
- By Certification
- By Supply
- By Processing Route
- Key Takeaways
- Key Countries Market Analysis
- USA
- Pricing Analysis
- Market Share Analysis, 2025
- By Material Type
- By Application
- By Vehicles Program
- By Certification
- By Supply
- By Processing Route
- Canada
- Pricing Analysis
- Market Share Analysis, 2025
- By Material Type
- By Application
- By Vehicles Program
- By Certification
- By Supply
- By Processing Route
- Mexico
- Pricing Analysis
- Market Share Analysis, 2025
- By Material Type
- By Application
- By Vehicles Program
- By Certification
- By Supply
- By Processing Route
- Brazil
- Pricing Analysis
- Market Share Analysis, 2025
- By Material Type
- By Application
- By Vehicles Program
- By Certification
- By Supply
- By Processing Route
- Chile
- Pricing Analysis
- Market Share Analysis, 2025
- By Material Type
- By Application
- By Vehicles Program
- By Certification
- By Supply
- By Processing Route
- Germany
- Pricing Analysis
- Market Share Analysis, 2025
- By Material Type
- By Application
- By Vehicles Program
- By Certification
- By Supply
- By Processing Route
- UK
- Pricing Analysis
- Market Share Analysis, 2025
- By Material Type
- By Application
- By Vehicles Program
- By Certification
- By Supply
- By Processing Route
- Italy
- Pricing Analysis
- Market Share Analysis, 2025
- By Material Type
- By Application
- By Vehicles Program
- By Certification
- By Supply
- By Processing Route
- Spain
- Pricing Analysis
- Market Share Analysis, 2025
- By Material Type
- By Application
- By Vehicles Program
- By Certification
- By Supply
- By Processing Route
- France
- Pricing Analysis
- Market Share Analysis, 2025
- By Material Type
- By Application
- By Vehicles Program
- By Certification
- By Supply
- By Processing Route
- India
- Pricing Analysis
- Market Share Analysis, 2025
- By Material Type
- By Application
- By Vehicles Program
- By Certification
- By Supply
- By Processing Route
- ASEAN
- Pricing Analysis
- Market Share Analysis, 2025
- By Material Type
- By Application
- By Vehicles Program
- By Certification
- By Supply
- By Processing Route
- Australia & New Zealand
- Pricing Analysis
- Market Share Analysis, 2025
- By Material Type
- By Application
- By Vehicles Program
- By Certification
- By Supply
- By Processing Route
- China
- Pricing Analysis
- Market Share Analysis, 2025
- By Material Type
- By Application
- By Vehicles Program
- By Certification
- By Supply
- By Processing Route
- Japan
- Pricing Analysis
- Market Share Analysis, 2025
- By Material Type
- By Application
- By Vehicles Program
- By Certification
- By Supply
- By Processing Route
- South Korea
- Pricing Analysis
- Market Share Analysis, 2025
- By Material Type
- By Application
- By Vehicles Program
- By Certification
- By Supply
- By Processing Route
- Russia
- Pricing Analysis
- Market Share Analysis, 2025
- By Material Type
- By Application
- By Vehicles Program
- By Certification
- By Supply
- By Processing Route
- Poland
- Pricing Analysis
- Market Share Analysis, 2025
- By Material Type
- By Application
- By Vehicles Program
- By Certification
- By Supply
- By Processing Route
- Hungary
- Pricing Analysis
- Market Share Analysis, 2025
- By Material Type
- By Application
- By Vehicles Program
- By Certification
- By Supply
- By Processing Route
- Kingdom of Saudi Arabia
- Pricing Analysis
- Market Share Analysis, 2025
- By Material Type
- By Application
- By Vehicles Program
- By Certification
- By Supply
- By Processing Route
- Turkiye
- Pricing Analysis
- Market Share Analysis, 2025
- By Material Type
- By Application
- By Vehicles Program
- By Certification
- By Supply
- By Processing Route
- South Africa
- Pricing Analysis
- Market Share Analysis, 2025
- By Material Type
- By Application
- By Vehicles Program
- By Certification
- By Supply
- By Processing Route
- USA
- Market Structure Analysis
- Competition Dashboard
- Competition Benchmarking
- Market Share Analysis of Top Players
- By Regional
- By Material Type
- By Application
- By Vehicles Program
- By Certification
- By Supply
- By Processing Route
- Competition Analysis
- Competition Deep Dive
- FORVIA
- Overview
- Product Portfolio
- Profitability by Market Segments (Product/Age /Sales Channel/Region)
- Sales Footprint
- Strategy Overview
- Marketing Strategy
- Product Strategy
- Channel Strategy
- Yanfeng
- Autoneum
- Adient
- Lear
- Dow
- BASF
- Covestro
- Borealis
- Trinseo
- FORVIA
- Competition Deep Dive
- Assumptions & Acronyms Used


