Reports

- Global Locations -

Headquarters

Future Market Insights, Inc.

Christiana Corporate, 200
Continental Drive, Suite 401,
Newark, Delaware - 19713,
United States

T: +1-845-579-5705

Americas

Future Market Insights, Inc.

616 Corporate Way, Suite 2-9018,
Valley Cottage, NY 10989, United States

T: +1-347-918-3531

MEA

Future Market Insights

1602-6 Jumeirah Bay X2 Tower, Plot No: JLT-PH2-X2A,
Jumeirah Lakes Towers, Dubai,
United Arab Emirates

Europe

Future Market Insights

3rd Floor, 207 Regent Street,
W1B 3HH London
United Kingdom

T: + 44 (0) 20 8123 9659
D: +44 (0) 20 3287 4268

Asia Pacific

Future Market Insights

IndiaLand Global Tech Park, Unit UG-1, Behind Grand HighStreet, Phase 1, Hinjawadi, MH, Pune – 411057, India

Basketball Shoes Market Outlook (2022 to 2032)

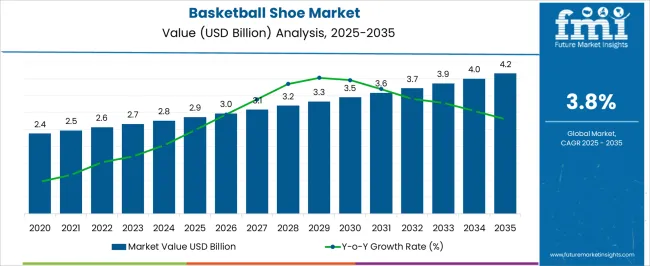
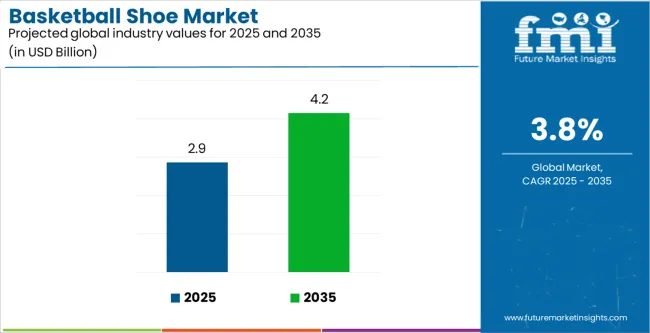
As per newly released data by Future Market Insights (FMI), the Basketball Shoes Market is estimated at USD 2,567 million in 2022 and is projected to reach USD 3,538 million by 2032, at a CAGR of 3.7% from 2022 to 2032.

Attribute Details
Estimated Basketball Shoe Market Size 2022 US$ 2,567 Million
Projected Basketball Shoe Market (2032) Market Size US$ 3,538 Million
Value CAGR (2022 to 2032) 3.7%

Don't pay for what you don't need

Customize your report by selecting specific countries or regions and save 30%!

Key Points Covered in Basketball Shoes Market Survey

  • Market estimates and forecast 2017 to 2032
  • Key drivers and restraints impacting market growth
  • Segment-wise, Country-wise, and Region-wise Analysis
  • Competition Mapping and Benchmarking
  • Brand share and Market Share Analysis
  • Key Product Innovations and Regulatory Climate
  • COVID-19 Impact on the Sneakers Market and How to Navigate
  • Recommendation on Key Winning Strategies

2017 to 2021 Basketball Shoes Market Outlook Compared to 2022 to 2032 Forecast

Basketball players of all skill levels wear shoes. Due to their feel, support, and comfort, basketball shoes are incredibly popular among beginners. As basketball is becoming more and more popular among young people, the need for basketball shoes is growing quickly.

Basketball shoes fall under the genre of sports shoes; they are usually used for playing basketball or other strenuous physical activities. Because they provide flexibility, stability or motion control, traction on the road, torsional stability, and other benefits, they are essential for athletes. Basketball players often leap, star, and stop while running, and practicing various physically challenging activities, so basketball shoes are made to act as shock absorbers, provide ankle stability, and allow players to move laterally. As a result, basketball shoes are thicker than running shoes. Numerous characteristics of basketball shoes contribute to the success of the global basketball shoe market.

Sneha Verghese
Sneha Verghese

Principal Consultant

Talk to Analyst

Find your sweet spots for generating winning opportunities in this market.

How are top companies gaining the interest of the customers?

Top companies in the basketball shoe market are collaborating with legendary players in the game to increase their appeal in the market. Nike recently launched a new series of basketball shoes with signatures of basketball giants including Michael Jordan, LeBron James, and Zion Williamson.

The three varieties of shoes are named Nike LeBron 9 Low 'Liverpool FC', Air Jordan 1 Mid 'Bred Toe', and Jordan Zion 2 'Duke'. The Liverpool FC-inspired Nike LeBron 9 Low pays homage to the legendary soccer team with its New Green, Action Red, and Black color scheme. Fans of any sport in the globe will love this timeless LeBron shoe which will benefit the company to attract basketball fans along with soccer enthusiasts. While other two designs symbolize the prominent events of the game in their distinct fashion which interest basketball fans throughout the world.

What are the trends reshaping the Basketball Shoes Market?

Basketball shoes have very low technical entry barriers, but numerous additional factors, like brand competition, rising raw material prices, fresh design trends, and more discretionary spending among the expanding middle-class population, are influencing the market growth. Smart innovations like connected textiles, the internet of things in footwear, and material developments are also significant factors in the market's expansion.

Basketball shoe manufacturers are increasingly using 3D printing to accommodate the enormous demand for a wide variety of shoe models and mass customization. As people become more cognizant of their health and fitness, there are more people doing sports. The participation of women in sports is also assisting the growth of the sector. Sports participation is increasing among those who want to maintain a healthy body, which will likely propel the global basketball shoe market forward in the next years.

Get the data you need at a Fraction of the cost

Personalize your report by choosing insights you need
and save 40%!

Country-wise Insights

What is the state of the Basketball Shoes Market in China?

“Controversies regarding the manufacturing of shoes rises problems in China’s basketball shoes market”

The debate about slave labour in China worsens the complex undercurrents of conducting business in the basketball-obsessed nation's biggest export market, which is also frequently accused of violating human rights. Following a widespread outcry. Nike, Adidas, and other well-known companies that use athletes as brand ambassadors across sports have stopped selling cotton and other products made in Xinjiang.

However, Chinese businesses, who are particularly interested in NBA players due to the sport's enormous popularity in the nation, have retaliated with a patriotic promise to keep using it. NBA athletes who promote brands are accused of exploiting slave labour due to their combative stand. The NBA and its players' reputations are at odds with this role. If the situation continues to intensify, this will act as a barrier to the growth of the basketball shoe market in China.

How is the Basketball Shoes Market striving in the Philippines?

“Basketball has become a part of the culture in the Philippines”

Most people connect basketball with being a man's sport when they think of it. However, basketball was initially introduced to the Philippines as a female sport during the American colonial era. Unfortunately, women's basketball in the Philippines gradually lost its appeal as a result of ideological discord. The first men's national team was established in 1910, five years after the introduction of the sport. In the 1913 Far Eastern Championship Games, the team took first place.

Basketball has developed into a cultural phenomenon that defies both time and philosophy over the years. Nike joined the basketball shoe market in the Philippines in 1998 and quickly became popular there. This sport served as an outlet for Filipinos to unwind, socialise, and have fun. As a result, the nation has opened its doors to basketball shoe manufacturers from around the world.

How are key players in the US planning to uplift the Basketball Shoes Market?

“Key players are set to bring back the classics from the golden era of basketball”

The iconic basketball sneaker from Reebok's 1980s "BB" footwear line, the BB 4000 II, has made a triumphant return. Reebok is a leading American maker of athletic footwear and apparel. From October 28, 2022, the BB 4000 II was made accessible to everyone online and through a few specific merchants. Intro colourways pay reference to '80s and '90s street culture, the pinnacle of basketball, and famous Reebok 'BB' moments. Additional designs and collaborations are scheduled to debut during FW22 and 2023.

The new BB 4000 II, which carries on the design from 1989 while making minor value additions, offers a highly wearable profile and superior craftsmanship at an affordable price range, suitable for any outfit or fashion. The key design features provide top quality leather layer across the upper, Reebok's side-stripe and cross-check marking, a recognisable split Union Jack tongue symbol paying homage to the brand's 80s past, an EVA rubber midsole, and a durable outsole with classic basketball tooling are all present and sound.

Category-wise Insights

Which type of product will contribute a major share of the basketball shoe market?

“High-top basketball shoes will contribute a major share in the market”

By 2032, it is predicted that high-top basketball shoes would account for a major share of the worldwide basketball shoe market. Basketball high tops are quite popular among professional players due to their comfort and capacity to prevent injuries. High-top basketball shoes are extremely versatile in terms of styling, which has increased demand for them among both professional and recreational players worldwide.

Which closure type is mainly preferred by the consumers?

“Lace-up shoes are mainly preferred by consumers”

Lace-up shoes are the most widely worn type of footwear. They are attached, as their name implies, by a lace that is threaded through lugs or eyelets. This type of shoe is preferred by most consumers as they are durable because of the basic mechanism of tying. While people like to style their laces in different patterns through eyelets. As a result, lace-up shoes are mainly preferred by consumers.

Which sales channel is expected to gain traction in the forecast period?

“Online sales channel will continue to gain traction in the forecast period”

Many have noted that while e-commerce has grown more and more popular with constantly connected consumers, it still cannot fully replace the in-person shopping experience, especially when it comes to footwear. However, online shoe purchases are becoming more and more popular with consumers. The main causes of this transition are that consumers are discovering a wider variety of products online, as well as more convenience and cheaper costs than they would find in retail stores.

Competitive Landscape

To maintain a strong position, manufacturers employ a variety of techniques, including mergers and collaborations, endorsement schemes, the introduction of new products, the expansion of global distribution networks, etc. By heavily spending on Research and Development and offering discounts on their manufactured goods, they concentrate on growing their product portfolio. They will be able to take advantage of major growth prospects during the assessment period if they implement such marketing techniques.

For instance:

Lillard has grown his presence in the basketball world after eight really successful signature sneakers with Adidas. The 32-year-old made an announcement about the Dame Certified, a line of reasonably priced basketball sneakers.

Scope of Report

Attribute Details
Forecast Period 2022 to 2032
Historical Data Available for 2017 to 2021
Market Analysis USD Million for Value
Key Regions Covered North America, Latin America, Europe, East Asia, South Asia, Oceania & Middle East & Africa (MEA)
Key Countries Covered United States, Canada, Brazil, Mexico, Germany, The UK, France, Spain, Italy, Russia, South Africa, Northern Africa GCC Countries, China, Japan, South Korea, India, Thailand, Malaysia, Indonesia, Australia & New Zealand.
Key Segments Covered Product Type, Application, Closure Type, Consumer Orientation, Sales Channel, and Region.
Key Companies Profiled
  • Adidas Group
  • Nike Inc.
  • New Balance
  • ASICS
  • PUMA SE
  • Under Armour, Inc.
  • Li Ning Company Ltd.
  • ECCO
  • China Dongxiang (Group) Co., Ltd.
  • 361 Degrees International Limited.
  • Vans
  • Converse
Report Coverage Market Forecast, Company Share Analysis, Competition Intelligence, DROT Analysis, Market Dynamics and Challenges, and Strategic Growth Initiatives
Customization & Pricing Available upon Request

Basketball Shoes Market by Category

By Product Type, the Basketball Shoe Market is segmented as:

  • High top shoes
  • Mid-top shoes
  • Low top shoes

By Application, the Basketball Shoes Market is segmented as:

  • Sports
  • Lifestyle
  • Competition

By Closure Type, the Basketball Shoe Market is segmented as:

  • Laces
  • Velcro
  • Straps
  • Zippers

By Consumer Orientation, Basketball Shoes Market is segmented as:

  • Men
  • Women

By Sales Channel, Basketball Shoes Market is segmented as:

  • Multi-brand Stores
  • Independent Small Stores
  • Online Retailers
  • Other Sales Channel

By Region, Basketball Shoes Market is segmented as:

  • North America
  • Latin America
  • Europe
  • East Asia
  • South Asia
  • Oceania
  • Middle East & Africa (MEA)

Frequently Asked Questions

What is the current Basketball Shoes market value?

The Basketball Shoes market is anticipated to reach a valuation of ~US$ 2,567 Million in 2022.

At what rate did the Basketball Shoes market grow between 2017 and 2021?

The Basketball Shoes market grew at 2.3% CAGR between 2017 and 2021.

What are the key trends driving Basketball Shoes sales?

The demand for more comfortable and cutting-edge footwear is one of the main drivers driving the growth of the global basketball shoe industry, along with peoples' better lifestyles and rising disposable income.

Who are the leading players in the Basketball Shoes market?

Leading players operating in the Basketball Shoes market are Adidas Group, Nike Inc., New Balance, ASICS, PUMA SE, Under Armour, Inc., Li Ning Company Ltd., ECCO, China Dongxiang (Group) Co., Ltd., 361 Degrees International Limited, Vans, and Converse among others.

What will be the share for North America Basketball Shoes market?

The North America Basketball Shoes market is projected to contribute a share of 24% CAGR over the forecast period.

Table of Content

1. Executive Summary | Basketball Shoes Market

    1.1. Global Market Outlook

    1.2. Summary of Key Findings

    1.3. Summary of Key Statistics

    1.4. FMI Analysis and Recommendations

2. Market Overview

    2.1. Market Taxonomy

    2.2. Market Definition

3. Key Market Trends

    3.1. Key Trends Impacting the Market

        3.1.1. Millennials are Driving Force

        3.1.2. Rapid Emergence of The start-ups In Market

        3.1.3. Increasing Awareness about sustainability

        3.1.4. Globalization Impacting Lifestyles

        3.1.5. Consumers Selecting for At-home Services, Using e-Commerce

        3.1.6. Others

    3.2. Product Innovation Trends

        3.2.1. Manufacturers Increasingly Spending on Research and Development and Stepping Up Eco-friendly material

        3.2.2. Growing Consumer Interest in Multifunctional Products

        3.2.3. Prominent Players are Now Diversifying Into other Profitable Segments

        3.2.4. Evolution in Product Design

    3.3. Future Prospects of Industry

        3.3.1. Factors Fuelling Growth

        3.3.2. Influx of Brands

        3.3.3. Innovative Distribution & Marketing Strategies

4. Market Demand Analysis 2017 to 2021 and Forecast, 2022 to 2032

    4.1. Historical Market Volume (Units) Analysis, 2017 to 2021

    4.2. Current and Future Market Volume (Units) Projections, 2022 to 2032

    4.3. Y-o-Y Growth Trend Analysis

5. Market - Pricing Analysis

    5.1. Regional Pricing Analysis By Product Type

    5.2. Pricing Break-up

        5.2.1. Manufacturer-Level Pricing

        5.2.2. Distributor Level Pricing

    5.3. Average Pricing Analysis Benchmark

6. Market Demand (in Value or in US$ Million) Analysis 2017 to 2021 and Forecast, 2022 to 2032

    6.1. Historical Market Value (US$ Million) Analysis, 2017 to 2021

    6.2. Current and Future Market Value (US$ Million) Projections, 2022 to 2032

        6.2.1. Y-o-Y Growth Trend Analysis

        6.2.2. Absolute $ Opportunity Analysis

7. Market Background

    7.1. Macro-Economic Factors

        7.1.1. Global GDP Growth Outlook

        7.1.2. Global Consumer Spending Outlook

        7.1.3. Global Population and Income Level Growth Outlook

        7.1.4. Global Apparel Industry Growth

        7.1.5. GDP Growth Rate Analysis

        7.1.6. Apparel Industry Contribution to GDP Outlook

        7.1.7. Global E-Commerce Industry Outlook

        7.1.8. Global Household Spending Outlook

        7.1.9. Urbanization Growth Outlook

        7.1.10. Global Male-Female Ratio Outlook

        7.1.11. Per Capita Disposable Income

        7.1.12. The outbreak of the Covid-19 Pandemic

        7.1.13. Economic Instability

        7.1.14. Impact of Online Sales

    7.2. Forecast Factors - Relevance & Impact

        7.2.1. Top Companies Historical Growth

        7.2.2. Global Industry Assessment

        7.2.3. Global Retail Sales Outlook

        7.2.4. Manufacturing Sector Gross Value Added

        7.2.5. Urbanization Growth Outlook

        7.2.6. Consumer Price Index

        7.2.7. Others

    7.3. Purchase Pattern Assessment

        7.3.1. Analysis Of Perception Towards Basketball Shoes

        7.3.2. Analysis Of Preferred Purchase Mode

        7.3.3. Analysis On The Consumption Pattern

        7.3.4. Consumer Insights

        7.3.5. Others (Pointers Will Be Developed During The Course of Study)

    7.4. Industry Value and Supply Chain Analysis

    7.5. Market Dynamics

        7.5.1. Drivers

        7.5.2. Restraints

        7.5.3. Opportunity Analysis

    7.6. PESTLE Analysis of Market

    7.7. Investment Feasibility Matrix

    7.8. Porter’s Five Force

8. Market Analysis 2017 to 2021 and Forecast 2022 to 2032, by Product Type

    8.1. Introduction / Key Findings

    8.2. Historical Market Size (US$ Million) and Volume Analysis By Product Type, 2017 to 2021

    8.3. Current and Future Market Size (US$ Million) and Volume Analysis and Forecast By Product Type, 2022 to 2032

        8.3.1. High-top shoes

        8.3.2. Mid-top shoes

        8.3.3. Low-top shoes

    8.4. Market Attractiveness Analysis By Product Type

9. Market Analysis 2017 to 2021 and Forecast 2022 to 2032, by Application

    9.1. Introduction / Key Findings

    9.2. Historical Market Size (US$ Million) and Volume Analysis By Application, 2017 to 2021

    9.3. Current and Future Market Size (US$ Million) and Volume Analysis and Forecast By Application, 2022 to 2032

        9.3.1. Sports

        9.3.2. Lifestyle

        9.3.3. Competition

    9.4. Market Attractiveness Analysis By Application

10. Market Analysis 2017 to 2021 and Forecast 2022 to 2032, by Closure Type

    10.1. Introduction / Key Findings

    10.2. Historical Market Size (US$ Million) and Volume Analysis By Closure Type, 2017 to 2021

    10.3. Current and Future Market Size (US$ Million) and Volume Analysis and Forecast By Closure Type, 2022 to 2032

        10.3.1. Laces

        10.3.2. Velcro

        10.3.3. Straps

        10.3.4. Zippers

    10.4. Market Attractiveness Analysis By Closure Type

11. Market Analysis 2017 to 2021 and Forecast 2022 to 2032, by Consumer Orientation

    11.1. Introduction / Key Findings

    11.2. Historical Market Size (US$ Million) and Volume Analysis By Consumer Orientation, 2017 to 2021

    11.3. Current and Future Market Size (US$ Million) and Volume Analysis and Forecast By Consumer Orientation, 2022 to 2032

        11.3.1. Men

        11.3.2. Women

    11.4. Market Attractiveness Analysis By Consumer Orientation

12. Market Analysis 2017 to 2021 and Forecast 2022 to 2032, by Sales Channel

    12.1. Introduction / Key Findings

    12.2. Historical Market Size (US$ Million) and Volume Analysis By Sales Channel, 2017 to 2021

    12.3. Current and Future Market Size (US$ Million) and Volume Analysis and Forecast By Sales Channel, 2022 to 2032

        12.3.1. Multi-brand Stores

        12.3.2. Independent Small Stores

        12.3.3. Online Retailers

        12.3.4. Other Sales Channel

    12.4. Market Attractiveness Analysis By Sales Channel

13. Market Analysis 2017 to 2021 and Forecast 2022 to 2032, by Region

    13.1. Introduction

    13.2. Historical Market Size (US$ Million) and Volume Analysis By Region, 2017 to 2021

    13.3. Current Market Size (US$ Million) and Volume Analysis and Forecast By Region, 2022 to 2032

        13.3.1. North America

        13.3.2. Latin America

        13.3.3. Europe

        13.3.4. East Asia

        13.3.5. South Asia

        13.3.6. Oceania

        13.3.7. Middle East & Africa (MEA)

    13.4. Market Attractiveness Analysis By Region

14. North America Market Analysis 2017 to 2021 and Forecast 2022 to 2032

    14.1. Introduction

    14.2. Pricing Analysis

    14.3. Historical Market Size (US$ Million) and Volume Trend Analysis By Market Taxonomy, 2017 to 2021

    14.4. Market Size (US$ Million) and Volume Forecast By Market Taxonomy, 2022 to 2032

        14.4.1. By Country

            14.4.1.1. The US

            14.4.1.2. Canada

        14.4.2. By Product Type

        14.4.3. By Application

        14.4.4. By Closure Type

        14.4.5. By Consumer Orientation

        14.4.6. By Sales Channel

    14.5. Market Attractiveness Analysis

        14.5.1. By Country

        14.5.2. By Product Type

        14.5.3. By Application

        14.5.4. By Closure Type

        14.5.5. By Consumer Orientation

        14.5.6. By Sales Channel

15. Latin America Market Analysis 2017 to 2021 and Forecast 2022 to 2032

    15.1. Introduction

    15.2. Pricing Analysis

    15.3. Historical Market Size (US$ Million) and Volume Trend Analysis By Market Taxonomy, 2017 to 2021

    15.4. Market Size (US$ Million) and Volume Forecast By Market Taxonomy, 2022 to 2032

        15.4.1. By Country

            15.4.1.1. Brazil

            15.4.1.2. Mexico

            15.4.1.3. Rest of Latin America

        15.4.2. By Product Type

        15.4.3. By Application

        15.4.4. By Closure Type

        15.4.5. By Consumer Orientation

        15.4.6. By Sales Channel

    15.5. Market Attractiveness Analysis

        15.5.1. By Country

        15.5.2. By Product Type

        15.5.3. By Application

        15.5.4. By Closure Type

        15.5.5. By Consumer Orientation

        15.5.6. By Sales Channel

16. Europe Market Analysis 2017 to 2021 and Forecast 2022 to 2032

    16.1. Introduction

    16.2. Pricing Analysis

    16.3. Historical Market Size (US$ Million) and Volume Trend Analysis By Market Taxonomy, 2017 to 2021

    16.4. Market Size (US$ Million) and Volume Forecast By Market Taxonomy, 2022 to 2032

        16.4.1. By Country

            16.4.1.1. The UK

            16.4.1.2. Germany

            16.4.1.3. Italy

            16.4.1.4. Spain

            16.4.1.5. France

            16.4.1.6. Russia

            16.4.1.7. Rest of Europe

        16.4.2. By Product Type

        16.4.3. By Application

        16.4.4. By Closure Type

        16.4.5. By Consumer Orientation

        16.4.6. By Sales Channel

    16.5. Market Attractiveness Analysis

        16.5.1. By Country

        16.5.2. By Product Type

        16.5.3. By Application

        16.5.4. By Closure Type

        16.5.5. By Consumer Orientation

        16.5.6. By Sales Channel

17. East Asia Market Analysis 2017 to 2021 and Forecast 2022 to 2032

    17.1. Introduction

    17.2. Pricing Analysis

    17.3. Historical Market Size (US$ Million) and Volume Trend Analysis By Market Taxonomy, 2017 to 2021

    17.4. Market Size (US$ Million) and Volume Forecast By Market Taxonomy, 2022 to 2032

        17.4.1. By Country

            17.4.1.1. China

            17.4.1.2. Japan

            17.4.1.3. South Korea

        17.4.2. By Product Type

        17.4.3. By Application

        17.4.4. By Closure Type

        17.4.5. By Consumer Orientation

        17.4.6. By Sales Channel

    17.5. Market Attractiveness Analysis

        17.5.1. By Country

        17.5.2. By Product Type

        17.5.3. By Application

        17.5.4. By Closure Type

        17.5.5. By Consumer Orientation

        17.5.6. By Sales Channel

18. South Asia Market Analysis 2017 to 2021 and Forecast 2022 to 2032

    18.1. Introduction

    18.2. Pricing Analysis

    18.3. Historical Market Size (US$ Million) and Volume Trend Analysis By Market Taxonomy, 2017 to 2021

    18.4. Market Size (US$ Million) and Volume Forecast By Market Taxonomy, 2022 to 2032

        18.4.1. By Country

            18.4.1.1. India

            18.4.1.2. Thailand

            18.4.1.3. Malaysia

            18.4.1.4. Indonesia

            18.4.1.5. Rest of South Asia

        18.4.2. By Product Type

        18.4.3. By Application

        18.4.4. By Closure Type

        18.4.5. By Consumer Orientation

        18.4.6. By Sales Channel

    18.5. Market Attractiveness Analysis

        18.5.1. By Country

        18.5.2. By Product Type

        18.5.3. By Application

        18.5.4. By Closure Type

        18.5.5. By Consumer Orientation

        18.5.6. By Sales Channel

19. Oceania Market Analysis 2017 to 2021 and Forecast 2022 to 2032

    19.1. Introduction

    19.2. Pricing Analysis

    19.3. Historical Market Size (US$ Million) and Volume Trend Analysis By Market Taxonomy, 2017 to 2021

    19.4. Market Size (US$ Million) and Volume Forecast By Market Taxonomy, 2022 to 2032

        19.4.1. By Country

            19.4.1.1. Australia

            19.4.1.2. New Zealand

        19.4.2. By Product Type

        19.4.3. By Application

        19.4.4. By Closure Type

        19.4.5. By Consumer Orientation

        19.4.6. By Sales Channel

    19.5. Market Attractiveness Analysis

        19.5.1. By Country

        19.5.2. By Product Type

        19.5.3. By Application

        19.5.4. By Closure Type

        19.5.5. By Consumer Orientation

        19.5.6. By Sales Channel

20. MEA Market Analysis 2017 to 2021 and Forecast 2022 to 2032

    20.1. Introduction

    20.2. Pricing Analysis

    20.3. Historical Market Size (US$ Million) and Volume Trend Analysis By Market Taxonomy, 2017 to 2021

    20.4. Market Size (US$ Million) and Volume Forecast By Market Taxonomy, 2022 to 2032

        20.4.1. By Country

            20.4.1.1. GCC Countries

            20.4.1.2. South Africa

            20.4.1.3. Rest of MEA

        20.4.2. By Product Type

        20.4.3. By Application

        20.4.4. By Closure Type

        20.4.5. By Consumer Orientation

        20.4.6. By Sales Channel

    20.5. Market Attractiveness Analysis

        20.5.1. By Country

        20.5.2. By Product Type

        20.5.3. By Application

        20.5.4. By Closure Type

        20.5.5. By Consumer Orientation

        20.5.6. By Sales Channel

21. Key Countries Market Analysis 

    21.1. Introduction

        21.1.1. Market Value Proportion Analysis, By Key Countries

        21.1.2. Global Vs. Country Growth Comparison

    21.2. U.S. Market Analysis

        21.2.1. By Product Type

        21.2.2. By Application

        21.2.3. By Closure Type

        21.2.4. By Consumer Orientation

        21.2.5. By Sales Channel

    21.3. Canada Market Analysis

        21.3.1. By Product Type

        21.3.2. By Application

        21.3.3. By Closure Type

        21.3.4. By Consumer Orientation

        21.3.5. By Sales Channel

    21.4. Mexico Market Analysis

        21.4.1. By Product Type

        21.4.2. By Application

        21.4.3. By Closure Type

        21.4.4. By Consumer Orientation

        21.4.5. By Sales Channel

    21.5. Brazil Market Analysis

        21.5.1. By Product Type

        21.5.2. By Application

        21.5.3. By Closure Type

        21.5.4. By Consumer Orientation

        21.5.5. By Sales Channel

    21.6. Germany Market Analysis

        21.6.1. By Product Type

        21.6.2. By Application

        21.6.3. By Closure Type

        21.6.4. By Consumer Orientation

        21.6.5. By Sales Channel

    21.7. Italy Market Analysis

        21.7.1. By Product Type

        21.7.2. By Application

        21.7.3. By Closure Type

        21.7.4. By Consumer Orientation

        21.7.5. By Sales Channel

    21.8. France Market Analysis

        21.8.1. By Product Type

        21.8.2. By Application

        21.8.3. By Closure Type

        21.8.4. By Consumer Orientation

        21.8.5. By Sales Channel

    21.9. The UK Market Analysis

        21.9.1. By Product Type

        21.9.2. By Application

        21.9.3. By Closure Type

        21.9.4. By Consumer Orientation

        21.9.5. By Sales Channel

    21.10. Spain Market Analysis

        21.10.1. By Product Type

        21.10.2. By Application

        21.10.3. By Closure Type

        21.10.4. By Consumer Orientation

        21.10.5. By Sales Channel

    21.11. Russia Market Analysis

        21.11.1. By Product Type

        21.11.2. By Application

        21.11.3. By Closure Type

        21.11.4. By Consumer Orientation

        21.11.5. By Sales Channel

    21.12. China Market Analysis

        21.12.1. By Product Type

        21.12.2. By Application

        21.12.3. By Closure Type

        21.12.4. By Consumer Orientation

        21.12.5. By Sales Channel

    21.13. Japan Market Analysis

        21.13.1. By Product Type

        21.13.2. By Application

        21.13.3. By Closure Type

        21.13.4. By Consumer Orientation

        21.13.5. By Sales Channel

    21.14. S. Korea Market Analysis

        21.14.1. By Product Type

        21.14.2. By Application

        21.14.3. By Closure Type

        21.14.4. By Consumer Orientation

        21.14.5. By Sales Channel

    21.15. India Market Analysis

        21.15.1. By Product Type

        21.15.2. By Application

        21.15.3. By Closure Type

        21.15.4. By Consumer Orientation

        21.15.5. By Sales Channel

    21.16. ASEAN Market Analysis

        21.16.1. By Product Type

        21.16.2. By Application

        21.16.3. By Closure Type

        21.16.4. By Consumer Orientation

        21.16.5. By Sales Channel

    21.17. Australia and New Zealand Market Analysis

        21.17.1. By Product Type

        21.17.2. By Application

        21.17.3. By Closure Type

        21.17.4. By Consumer Orientation

        21.17.5. By Sales Channel

    21.18. Turkey Market Analysis

        21.18.1. By Product Type

        21.18.2. By Application

        21.18.3. By Closure Type

        21.18.4. By Consumer Orientation

        21.18.5. By Sales Channel

    21.19. South Africa Market Analysis

        21.19.1. By Product Type

        21.19.2. By Application

        21.19.3. By Closure Type

        21.19.4. By Consumer Orientation

        21.19.5. By Sales Channel

22. Market Structure Analysis

    22.1. Market Analysis by Tier of Companies

    22.2. Market Concentration

    22.3. Market Share Analysis of Top Players

    22.4. Market Presence Analysis

        22.4.1. By Regional footprint of Players

        22.4.2. Product foot print by Players

        22.4.3. Channel Foot Print by Players

23. Competition Analysis

    23.1. Competition Dashboard

    23.2. Pricing Analysis by Competition

    23.3. Competition Benchmarking

    23.4. Competition Deep Dive

        23.4.1. Adidas Group

            23.4.1.1. Overview

            23.4.1.2. Product Portfolio

            23.4.1.3. Profitability by Market Segments (Product / Channel / Region)

            23.4.1.4. Distribution Footprint

            23.4.1.5. Strategy Overview

        23.4.2. Nike Inc.

            23.4.2.1. Overview

            23.4.2.2. Product Portfolio

            23.4.2.3. Profitability by Market Segments (Product / Channel / Region)

            23.4.2.4. Distribution Footprint

            23.4.2.5. Strategy Overview

        23.4.3. New Balance

            23.4.3.1. Overview

            23.4.3.2. Product Portfolio

            23.4.3.3. Profitability by Market Segments (Product / Channel / Region)

            23.4.3.4. Distribution Footprint

            23.4.3.5. Strategy Overview

        23.4.4. ASICS

            23.4.4.1. Overview

            23.4.4.2. Product Portfolio

            23.4.4.3. Profitability by Market Segments (Product / Channel / Region)

            23.4.4.4. Distribution Footprint

            23.4.4.5. Strategy Overview

        23.4.5. PUMA SE

            23.4.5.1. Overview

            23.4.5.2. Product Portfolio

            23.4.5.3. Profitability by Market Segments (Product / Channel / Region)

            23.4.5.4. Distribution Footprint

            23.4.5.5. Strategy Overview

        23.4.6. Under Armour, Inc.

            23.4.6.1. Overview

            23.4.6.2. Product Portfolio

            23.4.6.3. Profitability by Market Segments (Product / Channel / Region)

            23.4.6.4. Distribution Footprint

            23.4.6.5. Strategy Overview

        23.4.7. Li Ning Company Ltd.

            23.4.7.1. Overview

            23.4.7.2. Product Portfolio

            23.4.7.3. Profitability by Market Segments (Product / Channel / Region)

            23.4.7.4. Distribution Footprint

            23.4.7.5. Strategy Overview

        23.4.8. ECCO

            23.4.8.1. Overview

            23.4.8.2. Product Portfolio

            23.4.8.3. Profitability by Market Segments (Product / Channel / Region)

            23.4.8.4. Distribution Footprint

            23.4.8.5. Strategy Overview

        23.4.9. China Dongxiang (Group) Co., Ltd.

            23.4.9.1. Overview

            23.4.9.2. Product Portfolio

            23.4.9.3. Profitability by Market Segments (Product / Channel / Region)

            23.4.9.4. Distribution Footprint

            23.4.9.5. Strategy Overview

        23.4.10. 361 Degrees International Limited.

            23.4.10.1. Overview

            23.4.10.2. Product Portfolio

            23.4.10.3. Profitability by Market Segments (Product / Channel / Region)

            23.4.10.4. Distribution Footprint

            23.4.10.5. Strategy Overview

        23.4.11. Vans

            23.4.11.1. Overview

            23.4.11.2. Product Portfolio

            23.4.11.3. Profitability by Market Segments (Product / Channel / Region)

            23.4.11.4. Distribution Footprint

            23.4.11.5. Strategy Overview

        23.4.12. Converse

            23.4.12.1. Overview

            23.4.12.2. Product Portfolio

            23.4.12.3. Profitability by Market Segments (Product / Channel / Region)

            23.4.12.4. Distribution Footprint

            23.4.12.5. Strategy Overview

        23.4.13. Others (As per Request)

            23.4.13.1. Overview

            23.4.13.2. Product Portfolio

            23.4.13.3. Profitability by Market Segments (Product / Channel / Region)

            23.4.13.4. Distribution Footprint

            23.4.13.5. Strategy Overview

24. Assumptions and Acronyms Used

25. Research Methodology

Don't pay for what you don't need

Customize your report by selecting specific countries or regions and save 30%!

List of Tables

Table 1: Global Market Value (US$ Million) Forecast, By Product Type, 2017 to 2032

Table 2: Global Market Volume (Million Units) Forecast, By Product Type, 2017 to 2032

Table 3: Global Market Value (US$ Million) Forecast, By Application, 2017 to   2032

Table 4: Global Market Volume (Million Units) Forecast, By Application, 2017 to 2032

Table 5: Global Market Value (US$ Million) Forecast, By Consumer Orientation, 2017 to 2032

Table 6: Global Market Volume (Million Units) Forecast, By Consumer Orientation, 2017 to 2032

Table 7: Global Market Value (US$ Million) Forecast, By Closure Type, 2017 to 2032

Table 8: Global Market Volume (Million Units) Forecast, By Closure Type, 2017 to 2032

Table 9: Global Market Value (US$ Million) Forecast, By Sales Channel, 2017 to 2032

Table 10: Global Market Volume (Million Units) Forecast, By Sales Channel, 2017 to 2032

Table 11: Global Market Value (US$ Million) Forecast, By Region, 2017 to 2032

Table 12: Global Market Volume (Million Units) Forecast, By Region, 2017 to 2032

Table 13: North America Market Value (US$ Million) Forecast, By Country, 2017 to 2032

Table 14: North America Market Volume (Million Units) Forecast, By Country, 2017 to 2032

Table 15: North America Market Value (US$ Million) Forecast, By Product Type, 2017 to 2032

Table 16: North America Market Volume (Million Units) Forecast, By Product Type, 2017 to 2032

Table 17: North America Market Value (US$ Million) Forecast, By Application, 2017 to 2032

Table 18: North America Market Volume (Million Units) Forecast, By Application, 2017 to 2032

Table 19: North America Market Value (US$ Million) Forecast, By Consumer Orientation, 2017 to 2032

Table 20: North America Market Volume (Million Units) Forecast, By Consumer Orientation, 2017 to 2032

Table 21: North America Market Value (US$ Million) Forecast, By Closure Type, 2017 to 2032

Table 22: North America Market Volume (Million Units) Forecast, By Closure Type, 2017 to 2032

Table 23: North America Market Value (US$ Million) Forecast, By Sales Channel, 2017 to 2032

Table 24: North America Market Volume (Million Units) Forecast, By Sales Channel, 2017 to 2032

Table 25: Latin America Market Value (US$ Million) Forecast, By Country, 2017 to 2032

Table 26: Latin America Market Volume (Million Units) Forecast, By Country, 2017 to 2032

Table 27: Latin America Market Value (US$ Million) Forecast, By Product Type, 2017 to 2032

Table 28: Latin America Market Volume (Million Units) Forecast, By Product Type, 2017 to 2032

Table 29: Latin America Market Value (US$ Million) Forecast, By Application, 2017 to 2032

Table 30: Latin America Market Volume (Million Units) Forecast, By Application, 2017 to 2032

Table 31: Latin America Market Value (US$ Million) Forecast, By Consumer Orientation, 2017 to 2032

Table 32: Latin America Market Volume (Million Units) Forecast, By Consumer Orientation, 2017 to 2032

Table 33: Latin America Market Value (US$ Million) Forecast, By Closure Type, 2017 to 2032

Table 34: Latin America Market Volume (Million Units) Forecast, By Closure Type, 2017 to 2032

Table 35: Latin America Market Value (US$ Million) Forecast, By Sales Channel, 2017 to 2032

Table 36: Latin America Market Volume (Million Units) Forecast, By Sales Channel, 2017 to 2032

Table 37: Europe Market Value (US$ Million) Forecast, By Country, 2017 to 2032

Table 38: Europe Market Volume (Million Units) Forecast, By Country, 2017 to 2032

Table 39: Europe Market Value (US$ Million) Forecast, By Product Type, 2017 to 2032

Table 40: Europe Market Volume (Million Units) Forecast, By Product Type, 2017 to 2032

Table 41: Europe Market Value (US$ Million) Forecast, By Application, 2017 to 2032

Table 42: Europe Market Volume (Million Units) Forecast, By Application, 2017 to 2032

Table 43: Europe Market Value (US$ Million) Forecast, By Consumer Orientation, 2017 to 2032

Table 44: Europe Market Volume (Million Units) Forecast, By Consumer Orientation, 2017 to 2032

Table 45: Europe Market Value (US$ Million) Forecast, By Closure Type, 2017 to 2032

Table 46: Europe Market Volume (Million Units) Forecast, By Closure Type, 2017 to 2032

Table 47: Europe Market Value (US$ Million) Forecast, By Sales Channel, 2017 to 2032

Table 48: Europe Market Volume (Million Units) Forecast, By Sales Channel, 2017 to 2032

Table 49: East Asia Market Value (US$ Million) Forecast, By Country, 2017 to 2032

Table 50: East Asia Market Volume (Million Units) Forecast, By Country, 2017 to 2032

Table 51: East Asia Market Value (US$ Million) Forecast, By Product Type, 2017 to 2032

Table 52: East Asia Market Volume (Million Units) Forecast, By Product Type, 2017 to 2032

Table 53: East Asia Market Value (US$ Million) Forecast, By Application, 2017 to 2032

Table 54: East Asia Market Volume (Million Units) Forecast, By Application, 2017 to 2032

Table 55: East Asia Market Value (US$ Million) Forecast, By Consumer Orientation, 2017 to 2032

Table 56: East Asia Market Volume (Million Units) Forecast, By Consumer Orientation, 2017 to 2032

Table 57: East Asia Market Value (US$ Million) Forecast, By Closure Type, 2017 to 2032

Table 58: East Asia Market Volume (Million Units) Forecast, By Closure Type, 2017 to 2032

Table 59: East Asia Market Value (US$ Million) Forecast, By Sales Channel, 2017 to 2032

Table 60: East Asia Market Volume (Million Units) Forecast, By Sales Channel, 2017 to 2032

Table 61: South Asia Market Value (US$ Million) Forecast, By Country, 2017 to 2032

Table 62: South Asia Market Volume (Million Units) Forecast, By Country, 2017 to 2032

Table 63: South Asia Market Value (US$ Million) Forecast, By Product Type, 2017 to 2032

Table 64: South Asia Market Volume (Million Units) Forecast, By Product Type, 2017 to 2032

Table 65: South Asia Market Value (US$ Million) Forecast, By Application, 2017 to 2032

Table 66: South Asia Market Volume (Million Units) Forecast, By Application, 2017 to 2032

Table 67: South Asia Market Value (US$ Million) Forecast, By Consumer Orientation, 2017 to 2032

Table 68: South Asia Market Volume (Million Units) Forecast, By Consumer Orientation, 2017 to 2032

Table 69: South Asia Market Value (US$ Million) Forecast, By Closure Type, 2017 to 2032

Table 70: South Asia Market Volume (Million Units) Forecast, By Closure Type, 2017 to 2032

Table 71: South Asia Market Value (US$ Million) Forecast, By Sales Channel, 2017 to 2032

Table 72: South Asia Market Volume (Million Units) Forecast, By Sales Channel, 2017 to 2032

Table 73: Oceania Market Value (US$ Million) Forecast, By Country, 2017 to 2032

Table 74: Oceania Market Volume (Million Units) Forecast, By Country, 2017 to 2032

Table 75: Oceania Market Value (US$ Million) Forecast, By Product Type, 2017 to 2032

Table 76: Oceania Market Volume (Million Units) Forecast, By Product Type, 2017 to 2032

Table 77: Oceania Market Value (US$ Million) Forecast, By Application, 2017 to 2032

Table 78: Oceania Market Volume (Million Units) Forecast, By Application, 2017 to 2032

Table 79: Oceania Market Value (US$ Million) Forecast, By Consumer Orientation, 2017 to 2032

Table 80: Oceania Market Volume (Million Units) Forecast, By Consumer Orientation, 2017 to 2032

Table 81: Oceania Market Value (US$ Million) Forecast, By Closure Type, 2017 to 2032

Table 82: Oceania Market Volume (Million Units) Forecast, By Closure Type, 2017 to 2032

Table 83: Oceania Market Value (US$ Million) Forecast, By Sales Channel, 2017 to 2032

Table 84: Oceania Market Volume (Million Units) Forecast, By Sales Channel, 2017 to 2032

Table 85: MEA Market Value (US$ Million) Forecast, By Country, 2017 to 2032

Table 86: MEA Market Volume (Million Units) Forecast, By Country, 2017 to 2032

Table 87: MEA Market Value (US$ Million) Forecast, By Product Type, 2017 to 2032

Table 88: MEA Market Volume (Million Units) Forecast, By Product Type, 2017 to 2032

Table 89: MEA Market Value (US$ Million) Forecast, By Application, 2017 to 2032

Table 90: MEA Market Volume (Million Units) Forecast, By Application, 2017 to 2032

Table 91: MEA Market Value (US$ Million) Forecast, By Consumer Orientation, 2017 to 2032

Table 92: MEA Market Volume (Million Units) Forecast, By Consumer Orientation, 2017 to 2032

Table 93: MEA Market Value (US$ Million) Forecast, By Closure Type, 2017 to 2032

Table 94: MEA Market Volume (Million Units) Forecast, By Closure Type, 2017 to 2032

Table 95: MEA Market Value (US$ Million) Forecast, By Sales Channel, 2017 to 2032

Table 96: MEA Market Volume (Million Units) Forecast, By Sales Channel, 2017 to 2032
Sneha Verghese
Sneha Verghese

Principal Consultant

Talk to Analyst

Find your sweet spots for generating winning opportunities in this market.

List of Charts

Figure 01: Global Market Value (US$ Million) and Volume (Million Units) Analysis, 2017 to 2021

Figure 02: Global Market Value (US$ Million) and Volume (Million Units) Forecast, 2022 to 2032

Figure 03: Global Market Value (US$ Million) Analysis, 2017 to 2021

Figure 04: Global Market Value (US$ Million) Forecast, 2022 to 2032

Figure 05: Global Market Absolute $ Opportunity Value (US$ Million), 2022 to 2032

Figure 06: Global Market Value (US$ Million) Analysis By Product Type, 2017 to 2032

Figure 07: Global Market Volume (Million Units) Analysis By Product Type, 2017 to 2032

Figure 08: Global Market Y-o-Y Growth (%) Projections, By Product Type, 2022 to 2032

Figure 09: Global Market Attractiveness By Product Type, 2022 to 2032

Figure 10: Global Market Value (US$ Million) Analysis By Application, 2017 to 2032

Figure 11: Global Market Volume (Million Units) Analysis By Application, 2017 to 2032

Figure 12: Global Market Y-o-Y Growth (%) Projections, By Application, 2022 to 2032

Figure 13: Global Market Attractiveness By Application, 2022 to 2032

Figure 14: Global Market Value (US$ Million) Analysis By Closure Type, 2017 to 2032

Figure 15: Global Market Volume (Million Units) Analysis By Closure Type, 2017 to 2032

Figure 16: Global Market Y-o-Y Growth (%) Projections, By Closure Type, 2022 to 2032

Figure 17: Global Market Attractiveness By Closure Type, 2022 to 2032

Figure 18: Global Market Value (US$ Million) Analysis By Consumer Orientation, 2017 to 2032

Figure 19: Global Market Volume (Million Units) Analysis By Consumer Orientation, 2017 to 2032

Figure 20: Global Market Y-o-Y Growth (%) Projections, By Consumer Orientation, 2022 to 2032

Figure 21: Global Market Attractiveness By Consumer Orientation, 2022 to 2032

Figure 22: Global Market Value (US$ Million) Analysis By Sales Channel, 2017 to 2032

Figure 23: Global Market Volume (Million Units) Analysis By Sales Channel, 2017 to 2032

Figure 24: Global Market Y-o-Y Growth (%) Projections, By Sales Channel, 2022 to 2032

Figure 25: Global Market Attractiveness By Sales Channel, 2022 to 2032

Figure 26: Global Market Value (US$ Million) Analysis By Region, 2017 to 2032

Figure 27: Global Market Volume (Million Units) Analysis By Region, 2017 to 2032

Figure 28: Global Market Y-o-Y Growth (%) Projections, By Region, 2022 to 2032

Figure 29: Global Market Attractiveness By Region, 2022 to 2032

Figure 30: North America Market Value (US$ Million) Analysis By Country, 2017 to 2032

Figure 31: North America Market Volume (Million Units) Analysis By Country, 2017 to 2032

Figure 32: North America Market Y-o-Y Growth (%) Projections, By Country, 2022 to 2032

Figure 33: North America Market Attractiveness By Country, 2022 to 2032

Figure 34: North America Market Value (US$ Million) Analysis By Product Type, 2017 to 2032

Figure 35: North America Market Volume (Million Units) Analysis By Product Type, 2017 to 2032

Figure 36: North America Market Y-o-Y Growth (%) Projections, By Product Type, 2022 to 2032

Figure 37: North America Market Attractiveness By Product Type, 2022 to 2032

Figure 38: North America Market Value (US$ Million) Analysis By Application, 2017 to 2032

Figure 39: North America Market Volume (Million Units) Analysis By Application, 2017 to 2032

Figure 40: North America Market Y-o-Y Growth (%) Projections, By Application, 2022 to 2032

Figure 42: North America Market Value (US$ Million) Analysis By Closure Type, 2017 to 2032

Figure 43: North America Market Volume (Million Units) Analysis By Closure Type, 2017 to 2032

Figure 44: North America Market Y-o-Y Growth (%) Projections, By Closure Type, 2022 to 2032

Figure 45: North America Market Attractiveness By Closure Type, 2022 to 2032

Figure 46: North America Market Value (US$ Million) Analysis By Consumer Orientation, 2017 to 2032

Figure 47: North America Market Volume (Million Units) Analysis By Consumer Orientation, 2017 to 2032

Figure 48: North America Market Y-o-Y Growth (%) Projections, By Consumer Orientation, 2022 to 2032

Figure 49: North America Market Attractiveness By Consumer Orientation, 2022 to 2032

Figure 50: North America Market Value (US$ Million) Analysis By Sales Channel, 2017 to 2032

Figure 51: North America Market Volume (Million Units) Analysis By Sales Channel, 2017 to 2032

Figure 52: North America Market Y-o-Y Growth (%) Projections, By Sales Channel, 2022 to 2032

Figure 53: North America Market Attractiveness By Sales Channel, 2022 to 2032

Figure 54: Latin America Market Value (US$ Million) Analysis By Country, 2017 to 2032

Figure 55: Latin America Market Volume (Million Units) Analysis By Country, 2017 to 2032

Figure 56: Latin America Market Y-o-Y Growth (%) Projections, By Country, 2022 to 2032

Figure 57: Latin America Market Attractiveness By Country, 2022 to 2032

Figure 58: Latin America Market Value (US$ Million) Analysis By Product Type, 2017 to 2032

Figure 59: Latin America Market Volume (Million Units) Analysis By Product Type, 2017 to 2032

Figure 60: Latin America Market Y-o-Y Growth (%) Projections, By Product Type, 2022 to 2032

Figure 61: Latin America Market Attractiveness By Product Type, 2022 to 2032

Figure 62: Latin America Market Value (US$ Million) Analysis By Application, 2017 to 2032

Figure 63: Latin America Market Volume (Million Units) Analysis By Application, 2017 to 2032

Figure 64: Latin America Market Y-o-Y Growth (%) Projections, By Application, 2022 to 2032

Figure 65: Latin America Market Attractiveness By Application, 2022 to 2032

Figure 66: Latin America Market Value (US$ Million) Analysis By Consumer Orientation, 2017 to 2032

Figure 67: Latin America Market Volume (Million Units) Analysis By Consumer Orientation, 2017 to 2032

Figure 68: Latin America Market Y-o-Y Growth (%) Projections, By Consumer Orientation, 2022 to 2032

Figure 69: Latin America Market Attractiveness By Consumer Orientation, 2022 to 2032

Figure 70: Latin America Market Value (US$ Million) Analysis By Closure Type, 2017 to 2032

Figure 71: Latin America Market Volume (Million Units) Analysis By Closure Type, 2017 to 2032

Figure 72: Latin America Market Y-o-Y Growth (%) Projections, By Closure Type, 2022 to 2032

Figure 73: Latin America Market Attractiveness By Closure Type, 2022 to 2032

Figure 74: Latin America Market Value (US$ Million) Analysis By Sales Channel, 2017 to 2032

Figure 75: Latin America Market Volume (Million Units) Analysis By Sales Channel, 2017 to 2032

Figure 76: Latin America Market Y-o-Y Growth (%) Projections, By Sales Channel, 2022 to 2032

Figure 77: Latin America Market Attractiveness By Sales Channel, 2022 to 2032

Figure 78: Europe Market Value (US$ Million) Analysis By Country, 2017 to 2032

Figure 79: Europe Market Volume (Million Units) Analysis By Country, 2017 to 2032

Figure 80: Europe Market Y-o-Y Growth (%) Projections, By Country, 2022 to 2032

Figure 81: Europe Market Attractiveness By Country, 2022 to 2032

Figure 82: Europe Market Value (US$ Million) Analysis By Product Type, 2017 to 2032

Figure 83: Europe Market Volume (Million Units) Analysis By Product Type, 2017 to 2032

Figure 84: Europe Market Y-o-Y Growth (%) Projections, By Product Type, 2022 to 2032

Figure 85: Europe Market Attractiveness By Product Type, 2022 to 2032

Figure 86: Europe Market Value (US$ Million) Analysis By Application, 2017 to 2032

Figure 87: Europe Market Volume (Million Units) Analysis By Application, 2017 to 2032

Figure 88: Europe Market Y-o-Y Growth (%) Projections, By Application, 2022 to 2032

Figure 89: Europe Market Attractiveness By Application, 2022 to 2032

Figure 90: Europe Market Value (US$ Million) Analysis By Consumer Orientation, 2017 to 2032

Figure 91: Europe Market Volume (Million Units) Analysis By Consumer Orientation, 2017 to 2032

Figure 92: Europe Market Y-o-Y Growth (%) Projections, By Consumer Orientation, 2022 to 2032

Figure 93: Europe Market Attractiveness By Consumer Orientation, 2022 to 2032

Figure 94: Europe Market Value (US$ Million) Analysis By Closure Type, 2017 to 2032

Figure 95: Europe Market Volume (Million Units) Analysis By Closure Type, 2017 to 2032

Figure 96: Europea Market Y-o-Y Growth (%) Projections, By Closure Type, 2022 to 2032

Figure 97: Europe Market Attractiveness By Closure Type, 2022 to 2032

Figure 98: Europe Market Value (US$ Million) Analysis By Sales Channel, 2017 to 2032

Figure 99: Europe Market Volume (Million Units) Analysis By Sales Channel, 2017 to 2032

Figure 100: Europe Market Y-o-Y Growth (%) Projections, By Sales Channel, 2022 to 2032

Figure 101: Europe Market Attractiveness By Sales Channel, 2022 to 2032

Figure 102: East Asia Market Value (US$ Million) Analysis By Country, 2017 to 2032

Figure 103: East Asia Market Volume (Million Units) Analysis By Country, 2017 to 2032

Figure 104: East Asia Market Y-o-Y Growth (%) Projections, By Country, 2022 to 2032

Figure 105: East Asia Market Attractiveness By Country, 2022 to 2032

Figure 106: East Asia Market Value (US$ Million) Analysis By Product Type, 2017 to 2032

Figure 107: East Asia Market Volume (Million Units) Analysis By Product Type, 2017 to 2032

Figure 108: East Asia Market Y-o-Y Growth (%) Projections, By Product Type, 2022 to 2032

Figure 109: East Asia Market Attractiveness By Product Type, 2022 to 2032

Figure 110: East Asia Market Value (US$ Million) Analysis By Application, 2017 to 2032

Figure 111: East Asia Market Volume (Million Units) Analysis By Application, 2017 to 2032

Figure 112: East Asia Market Y-o-Y Growth (%) Projections, By Application, 2022 to 2032

Figure 113: East Asia Market Attractiveness By Application, 2022 to 2032

Figure 114: East Asia Market Value (US$ Million) Analysis By Consumer Orientation, 2017 to 2032

Figure 115: East Asia Market Volume (Million Units) Analysis By Consumer Orientation, 2017 to 2032

Figure 116: East Asia Market Y-o-Y Growth (%) Projections, By Consumer Orientation, 2022 to 2032

Figure 117: East Asia Market Attractiveness By Consumer Orientation, 2022 to 2032

Figure 118: East Asia Market Value (US$ Million) Analysis By Closure Type, 2017 to 2032

Figure 119: East Asia Market Volume (Million Units) Analysis By Closure Type, 2017 to 2032

Figure 120: East Asia Market Y-o-Y Growth (%) Projections, By Closure Type, 2022 to 2032

Figure 121: East Asia Market Attractiveness By Closure Type, 2022 to 2032

Figure 122: East Asia Market Value (US$ Million) Analysis By Sales Channel, 2017 to 2032

Figure 123: East Asia Market Volume (Million Units) Analysis By Sales Channel, 2017 to 2032

Figure 124: East Asia Market Y-o-Y Growth (%) Projections, By Sales Channel, 2022 to 2032

Figure 125: East Asia Market Attractiveness By Sales Channel, 2022 to 2032

Figure 126: South Asia Market Value (US$ Million) Analysis By Country, 2017 to 2032

Figure 127: South Asia Market Volume (Million Units) Analysis By Country, 2017 to 2032

Figure 128: South Asia Market Y-o-Y Growth (%) Projections, By Country, 2022 to 2032

Figure 129: South Asia Market Attractiveness By Country, 2022 to 2032

Figure 130: South Asia Market Value (US$ Million) Analysis By Product Type, 2017 to 2032

Figure 131: South Asia Market Volume (Million Units) Analysis By Product Type, 2017 to 2032

Figure 132: South Asia Market Y-o-Y Growth (%) Projections, By Product Type, 2022 to 2032

Figure 133: South Asia Market Attractiveness By Product Type, 2022 to 2032

Figure 134: South Asia Market Value (US$ Million) Analysis By Application, 2017 to 2032

Figure 135: South Asia Market Volume (Million Units) Analysis By Application, 2017 to 2032

Figure 136: South Asia Market Y-o-Y Growth (%) Projections, By Application, 2022 to 2032

Figure 137: South Asia Market Attractiveness By Application, 2022 to 2032

Figure 138: South Asia Market Value (US$ Million) Analysis By Consumer Orientation, 2017 to 2032

Figure 139: South Asia Market Volume (Million Units) Analysis By Consumer Orientation, 2017 to 2032

Figure 140: South Asia Market Y-o-Y Growth (%) Projections, By Consumer Orientation, 2022 to 2032

Figure 141: South Asia Market Attractiveness By Consumer Orientation, 2022 to 2032

Figure 142: South Asia Market Value (US$ Million) Analysis By Closure Type, 2017 to 2032

Figure 143: South Asia Market Volume (Million Units) Analysis By Closure Type, 2017 to 2032

Figure 144: South Asia Market Y-o-Y Growth (%) Projections, By Closure Type, 2022 to 2032

Figure 145: South Asia Market Attractiveness By Closure Type, 2022 to 2032

Figure 146: South Asia Market Value (US$ Million) Analysis By Sales Channel, 2017 to 2032

Figure 147: South Asia Market Volume (Million Units) Analysis By Sales Channel, 2017 to 2032

Figure 148: South Asia Market Y-o-Y Growth (%) Projections, By Sales Channel, 2022 to 2032

Figure 149: South Asia Market Attractiveness By Sales Channel, 2022 to 2032

Figure 150: Oceania Market Value (US$ Million) Analysis By Country, 2017 to 2032

Figure 151: Oceania Market Volume (Million Units) Analysis By Country, 2017 to 2032

Figure 152: Oceania Market Y-o-Y Growth (%) Projections, By Country, 2022 to 2032

Figure 153: Oceania Market Attractiveness By Country, 2022 to 2032

Figure 154: Oceania Market Value (US$ Million) Analysis By Product Type, 2017 to 2032

Figure 155: Oceania Market Volume (Million Units) Analysis By Product Type, 2017 to 2032

Figure 156: Oceania Market Y-o-Y Growth (%) Projections, By Product Type, 2022 to 2032

Figure 157: Oceania Market Attractiveness By Product Type, 2022 to 2032

Figure 158: Oceania Market Value (US$ Million) Analysis By Application, 2017 to 2032

Figure 159: Oceania Market Volume (Million Units) Analysis By Application, 2017 to 2032

Figure 160: Oceania Market Y-o-Y Growth (%) Projections, By Application, 2022 to 2032

Figure 161: Oceania Market Attractiveness By Application, 2022 to 2032

Figure 162: Oceania Market Value (US$ Million) Analysis By Consumer Orientation, 2017 to 2032

Figure 163: Oceania Market Volume (Million Units) Analysis By Consumer Orientation, 2017 to 2032

Figure 164: Oceania Market Y-o-Y Growth (%) Projections, By Consumer Orientation, 2022 to 2032

Figure 165: Oceania Market Attractiveness By Consumer Orientation, 2022 to 2032

Figure 166: Oceania Market Value (US$ Million) Analysis By Closure Type, 2017 to 2032

Figure 167: Oceania Market Volume (Million Units) Analysis By Closure Type, 2017 to 2032

Figure 168: Oceania Market Y-o-Y Growth (%) Projections, By Closure Type, 2022 to 2032

Figure 169: Oceania Market Attractiveness By Closure Type, 2022 to 2032

Figure 170: Oceania Market Value (US$ Million) Analysis By Sales Channel, 2017 to 2032

Figure 171: Oceania Market Volume (Million Units) Analysis By Sales Channel, 2017 to 2032

Figure 172: Oceania Market Y-o-Y Growth (%) Projections, By Sales Channel, 2022 to 2032

Figure 173: Oceania Market Attractiveness By Sales Channel, 2022 to 2032

Figure 174: MEA Market Value (US$ Million) Analysis By Country, 2017 to 2032

Figure 175: MEA Market Volume (Million Units) Analysis By Country, 2017 to 2032

Figure 176: MEA Market Y-o-Y Growth (%) Projections, By Country, 2022 to 2032

Figure 177: MEA Market Attractiveness By Country, 2022 to 2032

Figure 178: MEA Market Value (US$ Million) Analysis By Product Type, 2017 to 2032

Figure 179: MEA Market Volume (Million Units) Analysis By Product Type, 2017 to 2032

Figure 180: MEA Market Y-o-Y Growth (%) Projections, By Product Type, 2022 to 2032

Figure 181: MEA Market Attractiveness By Product Type, 2022 to 2032

Figure 182: MEA Market Value (US$ Million) Analysis By Application, 2017 to 2032

Figure 183: MEA Market Volume (Million Units) Analysis By Application, 2017 to 2032

Figure 184: MEA Market Y-o-Y Growth (%) Projections, By Application, 2022 to 2032

Figure 185: MEA Market Attractiveness By Application, 2022 to 2032

Figure 186: MEA Market Value (US$ Million) Analysis By Consumer Orientation, 2017 to 2032

Figure 187: MEA Market Volume (Million Units) Analysis By Consumer Orientation, 2017 to 2032

Figure 188: MEA Market Y-o-Y Growth (%) Projections, By Consumer Orientation, 2022 to 2032

Figure 189: MEA Market Attractiveness By Consumer Orientation, 2022 to 2032

Figure 190: MEA Market Value (US$ Million) Analysis By Closure Type, 2017 to 2032

Figure 191: MEA Market Volume (Million Units) Analysis By Closure Type, 2017 to 2032

Figure 192: MEA Market Y-o-Y Growth (%) Projections, By Closure Type, 2022 to 2032

Figure 193: MEA Market Attractiveness By Closure Type, 2022 to 2032

Figure 194: MEA Market Value (US$ Million) Analysis By Sales Channel, 2017 to 2032

Figure 195: MEA Market Volume (Million Units) Analysis By Sales Channel, 2017 to 2032

Figure 196: MEA Market Y-o-Y Growth (%) Projections, By Sales Channel, 2022 to 2032

Figure 197: MEA Market Attractiveness By Sales Channel, 2022 to 2032

Explore Consumer Product Insights

View Reports