Reports

- Global Locations -

Headquarters

Future Market Insights, Inc.

Christiana Corporate, 200
Continental Drive, Suite 401,
Newark, Delaware - 19713,
United States

T: +1-845-579-5705

Americas

Future Market Insights, Inc.

616 Corporate Way, Suite 2-9018,
Valley Cottage, NY 10989, United States

T: +1-347-918-3531

MEA

Future Market Insights

1602-6 Jumeirah Bay X2 Tower, Plot No: JLT-PH2-X2A,
Jumeirah Lakes Towers, Dubai,
United Arab Emirates

Europe

Future Market Insights

3rd Floor, 207 Regent Street,
W1B 3HH London
United Kingdom

T: + 44 (0) 20 8123 9659
D: +44 (0) 20 3287 4268

Asia Pacific

Future Market Insights

IndiaLand Global Tech Park, Unit UG-1, Behind Grand HighStreet, Phase 1, Hinjawadi, MH, Pune – 411057, India

Batters and Coatings Market Outlook (2022 to 2032)

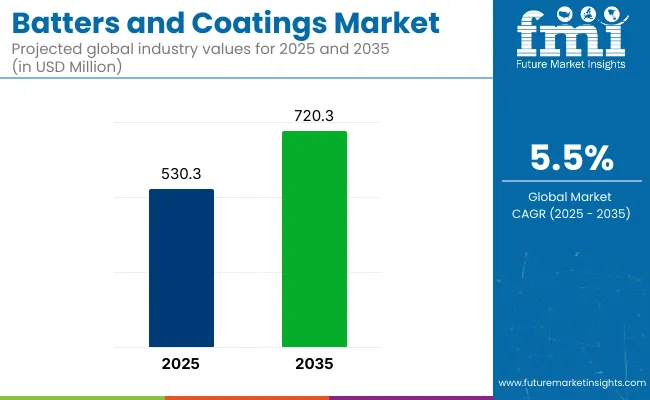
During the projected period (2022 to 2032), the batters and coatings market is expected to grow at a CAGR of 5.2%. The global batters and coatings market is projected to reach a valuation of US$ 670.1 Million by 2032 from US$ 403.6 Million in 2022.

The batters and coatings market is growing rapidly as consumers seek out new and innovative products. This growth is mainly driven by health-conscious consumers who are looking for healthier alternatives to traditional products.

The industry is expected to continue to grow at a rapid pace as health-conscious consumers increasingly demand nutritious products. The industry is highly competitive, with many companies vying for a share of the market. In order to succeed, these companies must offer innovative products that appeal to health-conscious consumers.

A batter is a liquid or semi-liquid mixture used to coat food before frying. It typically consists of flour, eggs, milk or water, and seasonings. The flour provides a crispy outer layer when fried, while the egg helps the batter adhere to the food.

A coating is similar to a batter, but it is usually thicker and dryer. Coatings are typically made from bread crumbs, cornmeal, or flour. They can be seasoned with salt, pepper, and other spices. Coatings are usually applied after the food has been cooked to give it a crunchy texture.

Increasing the use of both batters and coatings in a wide variety of foods such as chicken, fish, vegetables, and tofu is likely to drive the market. They can also be bought pre-made at the store or made at home with a simple recipe.

Battered products are becoming immensely popular nowadays across the globe owing to the increasing consumption of processed foods. Batters and coatings are also extensively utilized in deep-fried products to improve their appearance, texture, and flavor.

Coatings are set to be mainly preferred by the food service industry globally to support browning and lower dehydration in the final product, thereby providing food items with an appealing appearance and enhancing their crisp textures.

The surging consumption of ready-to-cook meals with hectic lifestyles is likely to push the global market in the forecast period. Many companies are nowadays utilizing batters and coatings for preserving their food items in a frozen state. Increasing demand for indulgent food items that have high nutritional value is also projected to augment the development of new products such as low salt, low fat, and clean label batters and coatings in the evaluation period.

Attributes Key Insights
Batters and Coatings Market Estimated Size (2022E) US$ 403.6 Million
Projected Market Valuation (2032F) US$ 670.1 Million
Value-based CAGR (2022 to 2032) 5.2%

Don't pay for what you don't need

Customize your report by selecting specific countries or regions and save 30%!

2017 to 2021 Global Batters and Coatings Market Outlook Compared to 2022 to 2032 Demand Forecast

The future of the global batters and coatings market looks promising with opportunities in the processed food and bakery industries. The market is expected to grow at a CAGR of 5.2% from 2022 to 2032. Processed food and bakery industries are the major end users of batters & coatings.

Demand for batters and coatings is mainly being driven by growth in terms of processed food consumption, which is attributed to the changing lifestyle and eating habits of consumers. Increasing disposable income and a rising working population are also fueling the demand for processed foods. Moreover, the rising number of women in the workforce is one of the key factors driving growth in the batters and coatings market.

Batters and Coatings Market

Country-wise Insights

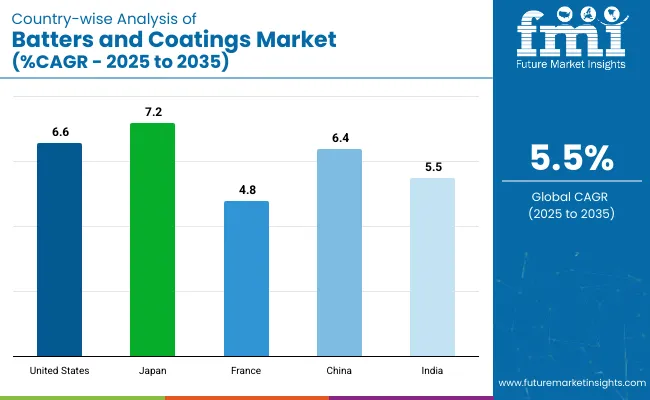
Why are Sales of Batters and Coatings Skyrocketing in the USA?

High Demand for Coating Batters to Surge in the USA with Rising Need for Convenient Food Options

The batters and coatings market in the USA is constantly changing and evolving. There is a large number of new players in the USA market who are constantly offering innovative products and solutions. Rising demand for healthy and convenient food options in the country is projected to aid growth in the next ten years.

Consumers are becoming more health-conscious and thus they are looking for products that would meet their specific needs. This has resulted in the emergence of a large number of new entrants into the USA market who are offering healthier alternatives to traditional batters and coatings. Besides, the increasing popularity of plant-based proteins is another vital factor that would push the market. Consumers are looking for more protein options, and plant-based proteins offer a number of benefits.

How are India-based Batters and Coatings Manufacturers Progressing?

Launch of Dosa and Idli Mix Packets in India to Propel Sales by the End of 2032

The Indian batters and coatings market is growing at a steady pace with the entry of a large number of local players and the launch of innovative products. The market is highly competitive with various players offering different products. These products are available in different packaging and sizes.

These products are also available in various formulations to meet the specific needs of customers. Key players in the Indian market are constantly striving to improve their product offerings to attract more customers. In December 2021, for instance, MTR Foods forayed into the fresh idli and dosa batter category with the introduction of MTR Minute Fresh.

Why are Batters and Coatings Providers Eyeing the China Market?

Pancake and Waffle Mix Companies to Invest in Promotional Activities in China, Boosting Batters and Coatings Market

China's batters and coatings market is expected to grow significantly in the next ten years, as per FMI. Increasing demand for processed food products in the country is projected to drive the market. Key players are mainly targeting the emerging market of China for selling their batters and coatings market.

Demand for processed food has increased due to the changing lifestyle of Chinese consumers. They are nowadays more inclined towards convenience foods that require less time to prepare. This has further created a lucrative opportunity for key players to introduce their products in the Chinese market.

To tap into this opportunity, market players are focusing on developing innovative products that can meet the specific needs of Chinese consumers. They are also investing heavily in marketing and promotional activities to create awareness about their products in the Chinese market.

Why is Japan Showcasing High Sales in the Batters and Coatings Market?

Rising Number of Restaurants in Japan to Fuel the Demand for Food Coatings by 2032

Japan is considered to be one of the largest markets for batters and coatings, and it is also the fastest-growing market. The country has a long tradition of eating rice, which is the main ingredient in many popular dishes. As a result, there is a high demand for products that can be used to prepare rice dishes.

There are several factors that have contributed to growth in the batters and coatings market in Japan. The country has experienced a boom in the food service industry. This has further led to an increasing number of restaurants and other food businesses that require batters and coatings for those items that are included in their menus. Also, there has been a shift in terms of consumer preferences toward healthy and convenience foods. This has created a high demand for products that are low in fat and calories but still provide a delicious taste.

Nandini Roy Choudhury

Principal Consultant

Talk to Analyst

Find your sweet spots for generating winning opportunities in this market.

Category-wise Insights

Which is the Most Preferred Batter Type?

Sales of Tempura Batter to Surge by 2032 Amid High Demand in Developed Countries

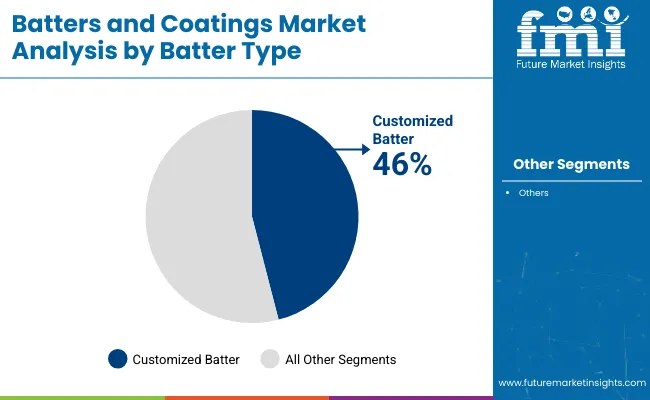
Based on batter type, the tempura segment is set to remain at the forefront in the global batters and coatings market throughout the forecast period. Tempura is a Japanese dish made by coating vegetables or seafood in a light batter and frying them. It is often served with dipping sauces. Tempura can be made at home, but there are also many pre-made mixes and products available.

However, making tempura from scratch can be more difficult. The batter needs to be light and airy, and the frying process must be carefully monitored to ensure that the food doesn't become overcooked or greasy. Overall, tempura is a delicious and relatively easy dish to make. Rapid globalization is expected to drive the demand for tempura batter in developed countries such as the USA and the UK in the next ten years.

Competitive Landscape

The global market for batters and coatings is highly fragmented and competitive due to the presence of several local and regional players. Key players are adopting a wide range of marketing strategies such as partnerships, expansions, mergers & acquisitions, and collaborations to compete with their rivals.

Some of the leading companies operating in the batters and coatings market are General Mills (USA), Pinnacle Foods, Inc., Pinnacle Foods (USA), Conagra Brands (USA), Kroger (USA), Archer Daniels Midland Company, Associated British Foods plc (UK), Unilever plc (UK), Ingredion Incorporated, Kerry Group plc, AAK AB, Premier Foods plc (UK), MTR Foods Pvt., CSM Bakery Solutions, ITC Limited, Britannia Industries Limited, Parle Products Private Limited, Nestle India Limited. Aashirvaad Atta, Ltd., and Kellogg Company.

For instance,

  • In April 2022, iD Fresh Food, a Bengaluru-based consumer brand, announced that it is planning to start an idly-dosa batter factory in Hyderabad to capitalize on the high demand for healthy food items. The company is also thinking of setting up another plant in New Delhi.

Get the data you need at a Fraction of the cost

Personalize your report by choosing insights you need
and save 40%!

How Pinnacle Foods, Inc., Kellogg Company, and Conagra Brands, Inc. are Changing the Way We Consume Batters & Coatings!

Batters and coatings are gaining immense popularity nowadays as applying these to different food items can have benefits beyond taste and texture. To make the food taste good and have a crispy texture, coatings, and batters are used extensively worldwide. Similarly, food companies use batters to change texture as a protein delivery system, or for preservation. Let’s take a look at the leading players offering batters and coatings.

Conagra Brands, Inc. is a consumer packaged goods holding corporation based in Chicago, Illinois. Conagra manufactures and distributes goods under a wide variety of brand names in supermarkets, restaurants, and food service companies.

Conagra manufactures a wide range of culinary goods such as cooking oil, frozen meals, hot chocolate, hot dogs, peanut butter, and many more. Act II, Hunt's, Healthy Choice, Marie Callender's, Udi's Gluten-Free, Orville Redenbacher's, Slim Jim, Reddi-Wip, Egg Beaters, Pam, Angie's Boom Chicka Pop, Earth Balance, Glutino, Hebrew National, Duke's, Chef Boyardee, Home Menu, and Bertolli ready meals are some of Conagra's key brands.

In June 2021, Conagra Brands stated that it will accelerate its transition to 100% cage-free eggs, converting 100% of its egg consumption to cage-free by the end of the fiscal year 2024, one year sooner than its original promise to directly source 100% cage-free eggs by 2025.

Additionally, in January 2021, inspired by bakeries, social media, and baking influencers, Duncan Hines, a Conagra Brands, Inc. company, announced the launch of a new line of exciting, colorful, and absolutely out-of-this-world baking kits suitable for making at-home with your family.

On the other hand, Pinnacle Foods, Inc. located in Parsippany, New Jersey, is a packaged meals firm that specializes in shelf-stable and frozen foods. On October 26, 2018, the firm was acquired by Conagra Brands. Pinnacle Foods Inc. produces, markets, and distributes packaged foods. Supermarkets, grocery wholesalers & distributors, mass merchandisers, convenience stores, dollar stores, pharmacy stores, warehouse clubs, as well as military channels and foodservice outlets, sell the company's products.

The company is divided into three divisions: Birds Eye Frozen Division, Duncan Hines Grocery Division, and Specialty Foods Division. The Specialty Foods Division oversees all savory snack activities.

The Kellogg Company, also known as Kellogg's, is an American global food manufacturing company based in Battle Creek, Michigan. Kellogg's manufactures cereal and convenience foods such as crackers & toaster pastries and sells them under various well-known brands such as Corn Flakes, Rice Krispies, Frosted Flakes, Pringles, Eggo, and Cheez-It.

In February 2021, Kellogg Company announced its collaboration with Future Food-Tech to create an Innovation Challenge, which will allow emerging talents in the sector to shine. Kellogg prioritizes well-being, and via this challenge, the business is looking for proposals on novel plant-based solutions that would enhance digestive wellness.

Scope of the Batters and Coatings Market Report

Attribute Details
Estimated Market Size (2022) US$ 403.6 Million
Projected Market Valuation (2032) US$ 670.1 Million
Value-based CAGR (2022 to 2032) 5.2%
Forecast Period 2022 to 2032
Historical Data Available for 2017 to 2021
Market Analysis Value (US$ Million)
Key Regions Covered
  • North America
  • Latin America
  • Europe
  • Asia Pacific
  • Oceania
  • Middle East and Africa
Key Countries Covered
  • United States of America
  • Canada
  • Mexico
  • Germany
  • United Kingdom
  • France
  • Italy
  • Spain
  • China
  • Japan
  • India
  • South Korea
  • Australia
  • Brazil
  • Argentina
  • South Africa
  • UAE
Key Segments Covered
  • Distribution Channel
  • Batter Type
  • Coating Type
  • Form
  • ApplicationApplication
  • Region
Key Companies Profiled
  • Grote company
  • Hobart
  • Berkel
  • Vollrath
  • Bizerba
  • KWS
  • Nemco Food Equipment Ltd.
  • Beswood
  • Estella
  • Doyon Equipment Inc
  • Edlund
  • Vevor
  • Garde
  • Omcan
  • LEM Products
Report Coverage Market Forecast, Company Share Analysis, Competitive Landscape, Drivers, Restraints, Opportunities and Threats Analysis, Market Dynamics and Challenges, and Strategic Growth Initiatives

Batters and Coatings Market Outlook by Category

By Distribution Channel:

  • Offline
  • Online

By Application:

  • Meat
  • Fish
  • Bakery Products
  • Seafood
  • Cereal
  • Snack Vegetable
  • Dairy

By Batter Type:

  • Adhesion
  • Tempura
  • Beer
  • Thick
  • Wheat Flour
  • Corn Flour
  • Customized

By Form:

  • Dry
  • Liquid

By Coating Type:

  • Bread Crumbs
  • Cracker Meal
  • Spices and Herbs
  • Others

By Region:

  • North America
  • Latin America
  • Europe
  • East Asia
  • South Asia
  • Oceania
  • Middle East and Africa

Frequently Asked Questions

How big is the batters and coatings market?

The batters and coatings market size is set to be valued at US$ 403.6 Million by the end of 2022.

At what rate is the batters and coatings market expected to rise?

The batters and coatings market is expected to rise at a CAGR of 5.2% from 2022 to 2032.

What is the North America batters and coatings market outlook?

The North America batters and coatings market is expected to register a 33.6% CAGR between 2022 and 2032.

Which are the major countries driving demand in the batters and coatings market?

The USA, China, Canada, Germany, and Mexico are the major countries driving demand in the batters and coatings market.

At what rate will the China batters and coatings market grow?

The China batters and coatings market is projected to grow at a CAGR of around 4.4% over the next ten years.

At what rate will the Germany batters and coatings market grow?

The Germany batters and coatings market is projected to grow at a CAGR of around 28.9% over the next ten years.

At what rate will the Europe batters and coatings market grow?

The Europe batters and coatings market is expected to grow at 4.4% CAGR between 2022 and 2032.

Who are the top 5 players operating in the batters and coatings market?

Pinnacle Foods, Inc., General Mills, Inc., Kellogg Company, Conagra Brands, Inc., and CSM Bakery Solutions are expected to be the top players in the batters and coatings market.

What is the demand outlook forecast for the batters and coatings market?

The global batters and coatings market is projected to surpass US$ 670.1 Million by the end of 2032.

Table of Content

1. Executive Summary | Batters and Coatings Market

    1.1. Global Market Outlook

    1.2. Demand-side Trends

    1.3. Supply-side Trends

    1.4. Technology Roadmap Analysis

    1.5. Analysis and Recommendations

2. Market Overview

    2.1. Market Coverage / Taxonomy

    2.2. Market Definition / Scope / Limitations

3. Market Background

    3.1. Market Dynamics

        3.1.1. Drivers

        3.1.2. Restraints

        3.1.3. Opportunity

        3.1.4. Trends

    3.2. Scenario Forecast

        3.2.1. Demand in Optimistic Scenario

        3.2.2. Demand in Likely Scenario

        3.2.3. Demand in Conservative Scenario

    3.3. Product launches & Recent Developments

    3.4. Product Life Cycle Analysis

    3.5. Value Chain Analysis

        3.5.1. Supply Side Participants and their Roles

            3.5.1.1. Producers

            3.5.1.2. Mid-Level Participants (Traders/ Agents/ Brokers)

            3.5.1.3. Wholesalers and Distributors

        3.5.2. % of Operating Margin Analysis

        3.5.3. List of Raw Material Suppliers

        3.5.4. List of Existing and Potential Buyers

    3.6. Global Batters & Coatings Market - Pricing Analysis

        3.6.1. Price Point Assessment by Region

        3.6.2. Price Point Assessment by Product Type

        3.6.3. Price Forecast till 2032

        3.6.4. Factors affecting pricing

    3.7. Forecast Factors - Relevance & Impact

    3.8. PESTLE and Porter’s Analysis

    3.9. Regulatory Landscape

        3.9.1. Packaging & Labelling Regulations

        3.9.2. Certifications and Certifying Agency Overview

        3.9.3. Import/Export Policies

    3.10. Regional Parent Market Outlook

    3.11. Production and Consumption Statistics

    3.12. Import and Export Statistics

    3.13. Consumers Survey Analysis

    3.14. Macro-Economic Factors

    3.15. Product Claims & Nutritional Information scanned by Buyers

4. Global Batters & Coatings Market Analysis 2017 to 2021 and Forecast, 2022 to 2032

    4.1. Historical Market Size Value (US$ Million) & Volume (MT) Analysis, 2017 to 2021

    4.2. Current and Future Market Size Value (US$ Million) & Volume (MT) Projections, 2022 to 2032

        4.2.1. Y-o-Y Growth Trend Analysis

        4.2.2. Absolute $ Opportunity Analysis

5. Global Batters & Coatings Market Analysis 2017 to 2021 and Forecast 2022 to 2032, By Batter Type

    5.1. Introduction / Key Findings

    5.2. Historical Market Size Value (US$ Million) & Volume (MT) Analysis By Batter type, 2017 to 2021

    5.3. Current and Future Market Size Value (US$ Million) & Volume (MT) Analysis and Forecast By Batter type, 2022 to 2032

        5.3.1. Adhesion

        5.3.2. Tempura

        5.3.3. Beer

        5.3.4. Thick

        5.3.5. Wheat Flour

        5.3.6. Corn Flour

        5.3.7. Customized

    5.4. Y-o-Y Growth Trend Analysis By Batter type, 2017 to 2021

    5.5. Absolute $ Opportunity Analysis By Batter type, 2022 to 2032

6. Global Batters & Coatings Market Analysis 2017 to 2021 and Forecast 2022 to 2032, By Application

    6.1. Introduction / Key Findings

    6.2. Historical Market Size Value (US$ Million) & Volume (MT) Analysis By Application, 2017 to 2021

    6.3. Current and Future Market Size Value (US$ Million) & Volume (MT) Analysis and Forecast By Application, 2022 to 2032

        6.3.1. Meat

        6.3.2. Fish

        6.3.3. Bakery Products

        6.3.4. Seafood

        6.3.5. Cereal

        6.3.6. Snack Vegetable

        6.3.7. Dairy

    6.4. Y-o-Y Growth Trend Analysis By Application, 2017 to 2021

    6.5. Absolute $ Opportunity Analysis By Application, 2022 to 2032

7. Global Batters & Coatings Market Analysis 2017 to 2021 and Forecast 2022 to 2032, By Form

    7.1. Introduction / Key Findings

    7.2. Historical Market Size Value (US$ Million) & Volume (MT) Analysis By Form, 2017 to 2021

    7.3. Current and Future Market Size Value (US$ Million) & Volume (MT) Analysis and Forecast By Form, 2022 to 2032

        7.3.1. Dry

        7.3.2. Liquid

    7.4. Y-o-Y Growth Trend Analysis By Form, 2017 to 2021

    7.5. Absolute $ Opportunity Analysis By Form, 2022 to 2032

8. Global Batters & Coatings Market Analysis 2017 to 2021 and Forecast 2022 to 2032, By Distribution Channel

    8.1. Introduction / Key Findings

    8.2. Historical Market Size Value (US$ Million) & Volume (MT) Analysis By Distribution Channel, 2017 to 2021

    8.3. Current and Future Market Size Value (US$ Million) & Volume (MT) Analysis and Forecast By Distribution Channel, 2022 to 2032

        8.3.1. Offline

        8.3.2. Online

    8.4. Y-o-Y Growth Trend Analysis By Distribution Channel, 2017 to 2021

    8.5. Absolute $ Opportunity Analysis By Distribution Channel, 2022 to 2032

9. Global Batters & Coatings Market Analysis 2017 to 2021 and Forecast 2022 to 2032, By Coating Type

    9.1. Introduction / Key Findings

    9.2. Historical Market Size Value (US$ Million) & Volume (MT) Analysis By Coating type, 2017 to 2021

    9.3. Current and Future Market Size Value (US$ Million) & Volume (MT) Analysis and Forecast By Coating type, 2022 to 2032

        9.3.1. Bread Crumbs

        9.3.2. Cracker Meal

        9.3.3. Spices and Herbs

        9.3.4. Others

    9.4. Y-o-Y Growth Trend Analysis By Coating type, 2017 to 2021

    9.5. Absolute $ Opportunity Analysis By Coating type, 2022 to 2032

10. Global Batters & Coatings Market Analysis 2017 to 2021 and Forecast 2022 to 2032, By Region

    10.1. Introduction

    10.2. Historical Market Size Value (US$ Million) & Volume (MT) Analysis By Region, 2017 to 2021

    10.3. Current Market Size Value (US$ Million) & Volume (MT) Analysis and Forecast By Region, 2022 to 2032

        10.3.1. North America

        10.3.2. Latin America

        10.3.3. Europe

        10.3.4. East Asia

        10.3.5. South Asia

        10.3.6. Oceania

        10.3.7. Middle East and Africa

    10.4. Market Attractiveness Analysis By Region

11. North America Batters & Coatings Market Analysis 2017 to 2021 and Forecast 2022 to 2032, By Country

    11.1. Historical Market Size Value (US$ Million) & Volume (MT) Trend Analysis By Market Taxonomy, 2017 to 2021

    11.2. Market Size Value (US$ Million) & Volume (MT) Forecast By Market Taxonomy, 2022 to 2032

        11.2.1. By Country

            11.2.1.1. United States of America

            11.2.1.2. Canada

        11.2.2. By Batter type

        11.2.3. By Application

        11.2.4. By Form

        11.2.5. By Distribution Channel

        11.2.6. By Coating type

    11.3. Market Attractiveness Analysis

        11.3.1. By Country

        11.3.2. By Batter type

        11.3.3. By Application

        11.3.4. By Form

        11.3.5. By Distribution Channel

        11.3.6. By Coating type

    11.4. Key Takeaways

12. Latin America Batters & Coatings Market Analysis 2017 to 2021 and Forecast 2022 to 2032, By Country

    12.1. Historical Market Size Value (US$ Million) & Volume (MT) Trend Analysis By Market Taxonomy, 2017 to 2021

    12.2. Market Size Value (US$ Million) & Volume (MT) Forecast By Market Taxonomy, 2022 to 2032

        12.2.1. By Country

            12.2.1.1. Brazil

            12.2.1.2. Mexico

            12.2.1.3. Argentina

            12.2.1.4. Chile

            12.2.1.5. Peru

            12.2.1.6. Rest of Latin America

        12.2.2. By Batter type

        12.2.3. By Application

        12.2.4. By Form

        12.2.5. By Distribution Channel

        12.2.6. By Coating type

    12.3. Market Attractiveness Analysis

        12.3.1. By Country

        12.3.2. By Batter type

        12.3.3. By Application

        12.3.4. By Form

        12.3.5. By Distribution Channel

        12.3.6. By Coating type

    12.4. Key Takeaways

13. Europe Batters & Coatings Market Analysis 2017 to 2021 and Forecast 2022 to 2032, By Country

    13.1. Historical Market Size Value (US$ Million) & Volume (MT) Trend Analysis By Market Taxonomy, 2017 to 2021

    13.2. Market Size Value (US$ Million) & Volume (MT) Forecast By Market Taxonomy, 2022 to 2032

        13.2.1. By Country

            13.2.1.1. Germany

            13.2.1.2. Italy

            13.2.1.3. France

            13.2.1.4. United Kingdom

            13.2.1.5. Spain

            13.2.1.6. Russia

            13.2.1.7. BENELUX

            13.2.1.8. Poland

            13.2.1.9. Nordic Countries

            13.2.1.10. Rest of Europe

        13.2.2. By Batter type

        13.2.3. By Application

        13.2.4. By Form

        13.2.5. By Distribution Channel

        13.2.6. By Coating type

    13.3. Market Attractiveness Analysis

        13.3.1. By Country

        13.3.2. By Batter type

        13.3.3. By Application

        13.3.4. By Form

        13.3.5. By Distribution Channel

        13.3.6. By Coating type

    13.4. Key Takeaways

14. East Asia Batters & Coatings Market Analysis 2017 to 2021 and Forecast 2022 to 2032, By Country

    14.1. Historical Market Size Value (US$ Million) & Volume (MT) Trend Analysis By Market Taxonomy, 2017 to 2021

    14.2. Market Size Value (US$ Million) & Volume (MT) Forecast By Market Taxonomy, 2022 to 2032

        14.2.1. By Country

            14.2.1.1. China

            14.2.1.2. Japan

            14.2.1.3. South Korea

        14.2.2. By Batter type

        14.2.3. By Application

        14.2.4. By Form

        14.2.5. By Distribution Channel

        14.2.6. By Coating type

    14.3. Market Attractiveness Analysis

        14.3.1. By Country

        14.3.2. By Batter type

        14.3.3. By Application

        14.3.4. By Form

        14.3.5. By Distribution Channel

        14.3.6. By Coating type

    14.4. Key Takeaways

15. South Asia Batters & Coatings Market Analysis 2017 to 2021 and Forecast 2022 to 2032, By Country

    15.1. Historical Market Size Value (US$ Million) & Volume (MT) Trend Analysis By Market Taxonomy, 2017 to 2021

    15.2. Market Size Value (US$ Million) & Volume (MT) Forecast By Market Taxonomy, 2022 to 2032

        15.2.1. By Country

            15.2.1.1. India

            15.2.1.2. Thailand

            15.2.1.3. Malaysia

            15.2.1.4. Indonesia

            15.2.1.5. Singapore

            15.2.1.6. Rest of South Asia

        15.2.2. By Batter type

        15.2.3. By Application

        15.2.4. By Form

        15.2.5. By Distribution Channel

        15.2.6. By Coating type

    15.3. Market Attractiveness Analysis

        15.3.1. By Country

        15.3.2. By Batter type

        15.3.3. By Application

        15.3.4. By Form

        15.3.5. By Distribution Channel

        15.3.6. By Coating type

    15.4. Key Takeaways

16. Oceania Batters & Coatings Market Analysis 2017 to 2021 and Forecast 2022 to 2032, By Country

    16.1. Historical Market Size Value (US$ Million) & Volume (MT) Trend Analysis By Market Taxonomy, 2017 to 2021

    16.2. Market Size Value (US$ Million) & Volume (MT) Forecast By Market Taxonomy, 2022 to 2032

        16.2.1. By Country

            16.2.1.1. Australia

            16.2.1.2. New Zealand

        16.2.2. By Batter type

        16.2.3. By Application

        16.2.4. By Form

        16.2.5. By Distribution Channel

        16.2.6. By Coating type

    16.3. Market Attractiveness Analysis

        16.3.1. By Country

        16.3.2. By Batter type

        16.3.3. By Application

        16.3.4. By Form

        16.3.5. By Distribution Channel

        16.3.6. By Coating type

    16.4. Key Takeaways

17. Middle East and Africa Batters & Coatings Market Analysis 2017 to 2021 and Forecast 2022 to 2032, By Country

    17.1. Historical Market Size Value (US$ Million) & Volume (MT) Trend Analysis By Market Taxonomy, 2017 to 2021

    17.2. Market Size Value (US$ Million) & Volume (MT) Forecast By Market Taxonomy, 2022 to 2032

        17.2.1. By Country

            17.2.1.1. GCC Countries

            17.2.1.2. South Africa

            17.2.1.3. Central Africa

            17.2.1.4. North Africa

        17.2.2. By Batter type

        17.2.3. By Application

        17.2.4. By Form

        17.2.5. By Distribution Channel

        17.2.6. By Coating type

    17.3. Market Attractiveness Analysis

        17.3.1. By Country

        17.3.2. By Batter type

        17.3.3. By Application

        17.3.4. By Form

        17.3.5. By Distribution Channel

        17.3.6. By Coating type

    17.4. Key Takeaways

18. Key Countries Batters & Coatings Market Analysis

    18.1. United States of America

        18.1.1. Pricing Analysis

        18.1.2. Market Share Analysis, 2021

            18.1.2.1. By Batter type

            18.1.2.2. By Application

            18.1.2.3. By Form

            18.1.2.4. By Distribution Channel

            18.1.2.5. By Coating type

    18.2. Canada

        18.2.1. Pricing Analysis

        18.2.2. Market Share Analysis, 2021

            18.2.2.1. By Batter type

            18.2.2.2. By Application

            18.2.2.3. By Form

            18.2.2.4. By Distribution Channel

            18.2.2.5. By Coating type

    18.3. Brazil

        18.3.1. Pricing Analysis

        18.3.2. Market Share Analysis, 2021

            18.3.2.1. By Batter type

            18.3.2.2. By Application

            18.3.2.3. By Form

            18.3.2.4. By Distribution Channel

            18.3.2.5. By Coating type

    18.4. Mexico

        18.4.1. Pricing Analysis

        18.4.2. Market Share Analysis, 2021

            18.4.2.1. By Batter type

            18.4.2.2. By Application

            18.4.2.3. By Form

            18.4.2.4. By Distribution Channel

            18.4.2.5. By Coating type

    18.5. Argentina

        18.5.1. Pricing Analysis

        18.5.2. Market Share Analysis, 2021

            18.5.2.1. By Batter type

            18.5.2.2. By Application

            18.5.2.3. By Form

            18.5.2.4. By Distribution Channel

            18.5.2.5. By Coating type

    18.6. Chile

        18.6.1. Pricing Analysis

        18.6.2. Market Share Analysis, 2021

            18.6.2.1. By Batter type

            18.6.2.2. By Application

            18.6.2.3. By Form

            18.6.2.4. By Distribution Channel

            18.6.2.5. By Coating type

    18.7. Peru

        18.7.1. Pricing Analysis

        18.7.2. Market Share Analysis, 2021

            18.7.2.1. By Batter type

            18.7.2.2. By Application

            18.7.2.3. By Form

            18.7.2.4. By Distribution Channel

            18.7.2.5. By Coating type

    18.8. Germany

        18.8.1. Pricing Analysis

        18.8.2. Market Share Analysis, 2021

            18.8.2.1. By Batter type

            18.8.2.2. By Application

            18.8.2.3. By Form

            18.8.2.4. By Distribution Channel

            18.8.2.5. By Coating type

    18.9. Italy

        18.9.1. Pricing Analysis

        18.9.2. Market Share Analysis, 2021

            18.9.2.1. By Batter type

            18.9.2.2. By Application

            18.9.2.3. By Form

            18.9.2.4. By Distribution Channel

            18.9.2.5. By Coating type

    18.10. France

        18.10.1. Pricing Analysis

        18.10.2. Market Share Analysis, 2021

            18.10.2.1. By Batter type

            18.10.2.2. By Application

            18.10.2.3. By Form

            18.10.2.4. By Distribution Channel

            18.10.2.5. By Coating type

    18.11. Spain

        18.11.1. Pricing Analysis

        18.11.2. Market Share Analysis, 2021

            18.11.2.1. By Batter type

            18.11.2.2. By Application

            18.11.2.3. By Form

            18.11.2.4. By Distribution Channel

            18.11.2.5. By Coating type

    18.12. United Kingdom

        18.12.1. Pricing Analysis

        18.12.2. Market Share Analysis, 2021

            18.12.2.1. By Batter type

            18.12.2.2. By Application

            18.12.2.3. By Form

            18.12.2.4. By Distribution Channel

            18.12.2.5. By Coating type

    18.13. Russia

        18.13.1. Pricing Analysis

        18.13.2. Market Share Analysis, 2021

            18.13.2.1. By Batter type

            18.13.2.2. By Application

            18.13.2.3. By Form

            18.13.2.4. By Distribution Channel

            18.13.2.5. By Coating type

    18.14. Poland

        18.14.1. Pricing Analysis

        18.14.2. Market Share Analysis, 2021

            18.14.2.1. By Batter type

            18.14.2.2. By Application

            18.14.2.3. By Form

            18.14.2.4. By Distribution Channel

            18.14.2.5. By Coating type

    18.15. BENELUX

        18.15.1. Pricing Analysis

        18.15.2. Market Share Analysis, 2021

            18.15.2.1. By Batter type

            18.15.2.2. By Application

            18.15.2.3. By Form

            18.15.2.4. By Distribution Channel

            18.15.2.5. By Coating type

    18.16. Nordic Countries

        18.16.1. Pricing Analysis

        18.16.2. Market Share Analysis, 2021

            18.16.2.1. By Batter type

            18.16.2.2. By Application

            18.16.2.3. By Form

            18.16.2.4. By Distribution Channel

            18.16.2.5. By Coating type

    18.17. China

        18.17.1. Pricing Analysis

        18.17.2. Market Share Analysis, 2021

            18.17.2.1. By Batter type

            18.17.2.2. By Application

            18.17.2.3. By Form

            18.17.2.4. By Distribution Channel

            18.17.2.5. By Coating type

    18.18. Japan

        18.18.1. Pricing Analysis

        18.18.2. Market Share Analysis, 2021

            18.18.2.1. By Batter type

            18.18.2.2. By Application

            18.18.2.3. By Form

            18.18.2.4. By Distribution Channel

            18.18.2.5. By Coating type

    18.19. South Korea

        18.19.1. Pricing Analysis

        18.19.2. Market Share Analysis, 2021

            18.19.2.1. By Batter type

            18.19.2.2. By Application

            18.19.2.3. By Form

            18.19.2.4. By Distribution Channel

            18.19.2.5. By Coating type

    18.20. India

        18.20.1. Pricing Analysis

        18.20.2. Market Share Analysis, 2021

            18.20.2.1. By Batter type

            18.20.2.2. By Application

            18.20.2.3. By Form

            18.20.2.4. By Distribution Channel

            18.20.2.5. By Coating type

    18.21. Thailand

        18.21.1. Pricing Analysis

        18.21.2. Market Share Analysis, 2021

            18.21.2.1. By Batter type

            18.21.2.2. By Application

            18.21.2.3. By Form

            18.21.2.4. By Distribution Channel

            18.21.2.5. By Coating type

    18.22. Indonesia

        18.22.1. Pricing Analysis

        18.22.2. Market Share Analysis, 2021

            18.22.2.1. By Batter type

            18.22.2.2. By Application

            18.22.2.3. By Form

            18.22.2.4. By Distribution Channel

            18.22.2.5. By Coating type

    18.23. Malaysia

        18.23.1. Pricing Analysis

        18.23.2. Market Share Analysis, 2021

            18.23.2.1. By Batter type

            18.23.2.2. By Application

            18.23.2.3. By Form

            18.23.2.4. By Distribution Channel

            18.23.2.5. By Coating type

    18.24. Singapore

        18.24.1. Pricing Analysis

        18.24.2. Market Share Analysis, 2021

            18.24.2.1. By Batter type

            18.24.2.2. By Application

            18.24.2.3. By Form

            18.24.2.4. By Distribution Channel

            18.24.2.5. By Coating type

    18.25. Australia

        18.25.1. Pricing Analysis

        18.25.2. Market Share Analysis, 2021

            18.25.2.1. By Batter type

            18.25.2.2. By Application

            18.25.2.3. By Form

            18.25.2.4. By Distribution Channel

            18.25.2.5. By Coating type

    18.26. New Zealand

        18.26.1. Pricing Analysis

        18.26.2. Market Share Analysis, 2021

            18.26.2.1. By Batter type

            18.26.2.2. By Application

            18.26.2.3. By Form

            18.26.2.4. By Distribution Channel

            18.26.2.5. By Coating type

    18.27. GCC Countries

        18.27.1. Pricing Analysis

        18.27.2. Market Share Analysis, 2021

            18.27.2.1. By Batter type

            18.27.2.2. By Application

            18.27.2.3. By Form

            18.27.2.4. By Distribution Channel

            18.27.2.5. By Coating type

    18.28. South Africa

        18.28.1. Pricing Analysis

        18.28.2. Market Share Analysis, 2021

            18.28.2.1. By Batter type

            18.28.2.2. By Application

            18.28.2.3. By Form

            18.28.2.4. By Distribution Channel

            18.28.2.5. By Coating type

    18.29. North Africa

        18.29.1. Pricing Analysis

        18.29.2. Market Share Analysis, 2021

            18.29.2.1. By Batter type

            18.29.2.2. By Application

            18.29.2.3. By Form

            18.29.2.4. By Distribution Channel

            18.29.2.5. By Coating type

    18.30. Central Africa

        18.30.1. Pricing Analysis

        18.30.2. Market Share Analysis, 2021

            18.30.2.1. By Batter type

            18.30.2.2. By Application

            18.30.2.3. By Form

            18.30.2.4. By Distribution Channel

            18.30.2.5. By Coating type

19. Market Structure Analysis

    19.1. Competition Dashboard

    19.2. Competition Benchmarking

    19.3. Market Share Analysis of Top Players

        19.3.1. By Regional

        19.3.2. By Batter type

        19.3.3. By Application

        19.3.4. By Form

        19.3.5. By Distribution Channel

        19.3.6. By Coating type

20. Competition Analysis

    20.1. Competition Deep Dive

        20.1.1. Grote company

            20.1.1.1. Overview

            20.1.1.2. Product Portfolio

            20.1.1.3. Profitability by Market Segments (Form/Batter Type/Coating Type/Distribution Channel /Application/Region)

            20.1.1.4. Sales Footprint

            20.1.1.5. Strategy Overview

                20.1.1.5.1. Marketing Strategy

                20.1.1.5.2. Product Strategy

                20.1.1.5.3. Channel Strategy

        20.1.2. Hobart

            20.1.2.1. Overview

            20.1.2.2. Product Portfolio

            20.1.2.3. Profitability by Market Segments (Form/Batter Type/Coating Type/Distribution Channel /Application/Region)

            20.1.2.4. Sales Footprint

            20.1.2.5. Strategy Overview

                20.1.2.5.1. Marketing Strategy

                20.1.2.5.2. Product Strategy

                20.1.2.5.3. Channel Strategy

        20.1.3. Berkel

            20.1.3.1. Overview

            20.1.3.2. Product Portfolio

            20.1.3.3. Profitability by Market Segments (Form/Batter Type/Coating Type/Distribution Channel /Application/Region)

            20.1.3.4. Sales Footprint

            20.1.3.5. Strategy Overview

                20.1.3.5.1. Marketing Strategy

                20.1.3.5.2. Product Strategy

                20.1.3.5.3. Channel Strategy

        20.1.4. Vollrath

            20.1.4.1. Overview

            20.1.4.2. Product Portfolio

            20.1.4.3. Profitability by Market Segments (Form/Batter Type/Coating Type/Distribution Channel /Application/Region)

            20.1.4.4. Sales Footprint

            20.1.4.5. Strategy Overview

                20.1.4.5.1. Marketing Strategy

                20.1.4.5.2. Product Strategy

                20.1.4.5.3. Channel Strategy

        20.1.5. Bizerba

            20.1.5.1. Overview

            20.1.5.2. Product Portfolio

            20.1.5.3. Profitability by Market Segments (Form/Batter Type/Coating Type/Distribution Channel /Application/Region)

            20.1.5.4. Sales Footprint

            20.1.5.5. Strategy Overview

                20.1.5.5.1. Marketing Strategy

                20.1.5.5.2. Product Strategy

                20.1.5.5.3. Channel Strategy

        20.1.6. KWS

            20.1.6.1. Overview

            20.1.6.2. Product Portfolio

            20.1.6.3. Profitability by Market Segments (Form/Batter Type/Coating Type/Distribution Channel /Application/Region)

            20.1.6.4. Sales Footprint

            20.1.6.5. Strategy Overview

                20.1.6.5.1. Marketing Strategy

                20.1.6.5.2. Product Strategy

                20.1.6.5.3. Channel Strategy

        20.1.7. Nemco Food Equipment Ltd.

            20.1.7.1. Overview

            20.1.7.2. Product Portfolio

            20.1.7.3. Profitability by Market Segments (Form/Batter Type/Coating Type/Distribution Channel /Application/Region)

            20.1.7.4. Sales Footprint

            20.1.7.5. Strategy Overview

                20.1.7.5.1. Marketing Strategy

                20.1.7.5.2. Product Strategy

                20.1.7.5.3. Channel Strategy

        20.1.8. Beswood

            20.1.8.1. Overview

            20.1.8.2. Product Portfolio

            20.1.8.3. Profitability by Market Segments (Form/Batter Type/Coating Type/Distribution Channel /Application/Region)

            20.1.8.4. Sales Footprint

            20.1.8.5. Strategy Overview

                20.1.8.5.1. Marketing Strategy

                20.1.8.5.2. Product Strategy

                20.1.8.5.3. Channel Strategy

        20.1.9. Estella

            20.1.9.1. Overview

            20.1.9.2. Product Portfolio

            20.1.9.3. Profitability by Market Segments (Form/Batter Type/Coating Type/Distribution Channel /Application/Region)

            20.1.9.4. Sales Footprint

            20.1.9.5. Strategy Overview

                20.1.9.5.1. Marketing Strategy

                20.1.9.5.2. Product Strategy

                20.1.9.5.3. Channel Strategy

        20.1.10. Doyon Equipment Inc

            20.1.10.1. Overview

            20.1.10.2. Product Portfolio

            20.1.10.3. Profitability by Market Segments (Form/Batter Type/Coating Type/Distribution Channel /Application/Region)

            20.1.10.4. Sales Footprint

            20.1.10.5. Strategy Overview

                20.1.10.5.1. Marketing Strategy

                20.1.10.5.2. Product Strategy

                20.1.10.5.3. Channel Strategy

        20.1.11. Edlund

            20.1.11.1. Overview

            20.1.11.2. Product Portfolio

            20.1.11.3. Profitability by Market Segments (Form/Batter Type/Coating Type/Distribution Channel /Application/Region)

            20.1.11.4. Sales Footprint

            20.1.11.5. Strategy Overview

                20.1.11.5.1. Marketing Strategy

                20.1.11.5.2. Product Strategy

                20.1.11.5.3. Channel Strategy

        20.1.12. Vevor

            20.1.12.1. Overview

            20.1.12.2. Product Portfolio

            20.1.12.3. Profitability by Market Segments (Form/Batter Type/Coating Type/Distribution Channel /Application/Region)

            20.1.12.4. Sales Footprint

            20.1.12.5. Strategy Overview

                20.1.12.5.1. Marketing Strategy

                20.1.12.5.2. Product Strategy

                20.1.12.5.3. Channel Strategy

        20.1.13. Garde

            20.1.13.1. Overview

            20.1.13.2. Product Portfolio

            20.1.13.3. Profitability by Market Segments (Form/Batter Type/Coating Type/Distribution Channel /Application/Region)

            20.1.13.4. Sales Footprint

            20.1.13.5. Strategy Overview

                20.1.13.5.1. Marketing Strategy

                20.1.13.5.2. Product Strategy

                20.1.13.5.3. Channel Strategy

        20.1.14. Omcan

            20.1.14.1. Overview

            20.1.14.2. Product Portfolio

            20.1.14.3. Profitability by Market Segments (Form/Batter Type/Coating Type/Distribution Channel /Application/Region)

            20.1.14.4. Sales Footprint

            20.1.14.5. Strategy Overview

                20.1.14.5.1. Marketing Strategy

                20.1.14.5.2. Product Strategy

                20.1.14.5.3. Channel Strategy

        20.1.15. LEM Products

            20.1.15.1. Overview

            20.1.15.2. Product Portfolio

            20.1.15.3. Profitability by Market Segments (Form/Batter Type/Coating Type/Distribution Channel /Application/Region)

            20.1.15.4. Sales Footprint

            20.1.15.5. Strategy Overview

                20.1.15.5.1. Marketing Strategy

                20.1.15.5.2. Product Strategy

                20.1.15.5.3. Channel Strategy

21. Assumptions & Acronyms Used

22. Research Methodology

List of Tables

Table 1: Global Value (US$ Million) Forecast by Region, 2017 to 2032

Table 2: Global Volume (MT) Forecast by Region, 2017 to 2032

Table 3: Global Value (US$ Million) Forecast by Batter type, 2017 to 2032

Table 4: Global Volume (MT) Forecast by Batter type, 2017 to 2032

Table 5: Global Value (US$ Million) Forecast by Application, 2017 to 2032

Table 6: Global Volume (MT) Forecast by Application, 2017 to 2032

Table 7: Global Value (US$ Million) Forecast by Form, 2017 to 2032

Table 8: Global Volume (MT) Forecast by Form, 2017 to 2032

Table 9: Global Value (US$ Million) Forecast by Mode of operation, 2017 to 2032

Table 10: Global Volume (MT) Forecast by Mode of operation, 2017 to 2032

Table 11: Global Value (US$ Million) Forecast by Coating type, 2017 to 2032

Table 12: Global Volume (MT) Forecast by Coating type, 2017 to 2032

Table 13: North America Value (US$ Million) Forecast by Country, 2017 to 2032

Table 14: North America Volume (MT) Forecast by Country, 2017 to 2032

Table 15: North America Value (US$ Million) Forecast by Batter type, 2017 to 2032

Table 16: North America Volume (MT) Forecast by Batter type, 2017 to 2032

Table 17: North America Value (US$ Million) Forecast by Application, 2017 to 2032

Table 18: North America Volume (MT) Forecast by Application, 2017 to 2032

Table 19: North America Value (US$ Million) Forecast by Form, 2017 to 2032

Table 20: North America Volume (MT) Forecast by Form, 2017 to 2032

Table 21: North America Value (US$ Million) Forecast by Mode of operation, 2017 to 2032

Table 22: North America Volume (MT) Forecast by Mode of operation, 2017 to 2032

Table 23: North America Value (US$ Million) Forecast by Coating type, 2017 to 2032

Table 24: North America Volume (MT) Forecast by Coating type, 2017 to 2032

Table 25: Latin America Value (US$ Million) Forecast by Country, 2017 to 2032

Table 26: Latin America Volume (MT) Forecast by Country, 2017 to 2032

Table 27: Latin America Value (US$ Million) Forecast by Batter type, 2017 to 2032

Table 28: Latin America Volume (MT) Forecast by Batter type, 2017 to 2032

Table 29: Latin America Value (US$ Million) Forecast by Application, 2017 to 2032

Table 30: Latin America Volume (MT) Forecast by Application, 2017 to 2032

Table 31: Latin America Value (US$ Million) Forecast by Form, 2017 to 2032

Table 32: Latin America Volume (MT) Forecast by Form, 2017 to 2032

Table 33: Latin America Value (US$ Million) Forecast by Mode of operation, 2017 to 2032

Table 34: Latin America Volume (MT) Forecast by Mode of operation, 2017 to 2032

Table 35: Latin America Value (US$ Million) Forecast by Coating type, 2017 to 2032

Table 36: Latin America Volume (MT) Forecast by Coating type, 2017 to 2032

Table 37: Europe Value (US$ Million) Forecast by Country, 2017 to 2032

Table 38: Europe Volume (MT) Forecast by Country, 2017 to 2032

Table 39: Europe Value (US$ Million) Forecast by Batter type, 2017 to 2032

Table 40: Europe Volume (MT) Forecast by Batter type, 2017 to 2032

Table 41: Europe Value (US$ Million) Forecast by Application, 2017 to 2032

Table 42: Europe Volume (MT) Forecast by Application, 2017 to 2032

Table 43: Europe Value (US$ Million) Forecast by Form, 2017 to 2032

Table 44: Europe Volume (MT) Forecast by Form, 2017 to 2032

Table 45: Europe Value (US$ Million) Forecast by Mode of operation, 2017 to 2032

Table 46: Europe Volume (MT) Forecast by Mode of operation, 2017 to 2032

Table 47: Europe Value (US$ Million) Forecast by Coating type, 2017 to 2032

Table 48: Europe Volume (MT) Forecast by Coating type, 2017 to 2032

Table 49: East Asia Value (US$ Million) Forecast by Country, 2017 to 2032

Table 50: East Asia Volume (MT) Forecast by Country, 2017 to 2032

Table 51: East Asia Value (US$ Million) Forecast by Batter type, 2017 to 2032

Table 52: East Asia Volume (MT) Forecast by Batter type, 2017 to 2032

Table 53: East Asia Value (US$ Million) Forecast by Application, 2017 to 2032

Table 54: East Asia Volume (MT) Forecast by Application, 2017 to 2032

Table 55: East Asia Value (US$ Million) Forecast by Form, 2017 to 2032

Table 56: East Asia Volume (MT) Forecast by Form, 2017 to 2032

Table 57: East Asia Value (US$ Million) Forecast by Mode of operation, 2017 to 2032

Table 58: East Asia Volume (MT) Forecast by Mode of operation, 2017 to 2032

Table 59: East Asia Value (US$ Million) Forecast by Coating type, 2017 to 2032

Table 60: East Asia Volume (MT) Forecast by Coating type, 2017 to 2032

Table 61: South Asia Value (US$ Million) Forecast by Country, 2017 to 2032

Table 62: South Asia Volume (MT) Forecast by Country, 2017 to 2032

Table 63: South Asia Value (US$ Million) Forecast by Batter type, 2017 to 2032

Table 64: South Asia Volume (MT) Forecast by Batter type, 2017 to 2032

Table 65: South Asia Value (US$ Million) Forecast by Application, 2017 to 2032

Table 66: South Asia Volume (MT) Forecast by Application, 2017 to 2032

Table 67: South Asia Value (US$ Million) Forecast by Form, 2017 to 2032

Table 68: South Asia Volume (MT) Forecast by Form, 2017 to 2032

Table 69: South Asia Value (US$ Million) Forecast by Mode of operation, 2017 to 2032

Table 70: South Asia Volume (MT) Forecast by Mode of operation, 2017 to 2032

Table 71: South Asia Value (US$ Million) Forecast by Coating type, 2017 to 2032

Table 72: South Asia Volume (MT) Forecast by Coating type, 2017 to 2032

Table 73: Oceania Value (US$ Million) Forecast by Country, 2017 to 2032

Table 74: Oceania Volume (MT) Forecast by Country, 2017 to 2032

Table 75: Oceania Value (US$ Million) Forecast by Batter type, 2017 to 2032

Table 76: Oceania Volume (MT) Forecast by Batter type, 2017 to 2032

Table 77: Oceania Value (US$ Million) Forecast by Application, 2017 to 2032

Table 78: Oceania Volume (MT) Forecast by Application, 2017 to 2032

Table 79: Oceania Value (US$ Million) Forecast by Form, 2017 to 2032

Table 80: Oceania Volume (MT) Forecast by Form, 2017 to 2032

Table 81: Oceania Value (US$ Million) Forecast by Mode of operation, 2017 to 2032

Table 82: Oceania Volume (MT) Forecast by Mode of operation, 2017 to 2032

Table 83: Oceania Value (US$ Million) Forecast by Coating type, 2017 to 2032

Table 84: Oceania Volume (MT) Forecast by Coating type, 2017 to 2032

Table 85: Middle East and Africa Value (US$ Million) Forecast by Country, 2017 to 2032

Table 86: Middle East and Africa Volume (MT) Forecast by Country, 2017 to 2032

Table 87: Middle East and Africa Value (US$ Million) Forecast by Batter type, 2017 to 2032

Table 88: Middle East and Africa Volume (MT) Forecast by Batter type, 2017 to 2032

Table 89: Middle East and Africa Value (US$ Million) Forecast by Application, 2017 to 2032

Table 90: Middle East and Africa Volume (MT) Forecast by Application, 2017 to 2032

Table 91: Middle East and Africa Value (US$ Million) Forecast by Form, 2017 to 2032

Table 92: Middle East and Africa Volume (MT) Forecast by Form, 2017 to 2032

Table 93: Middle East and Africa Value (US$ Million) Forecast by Mode of operation, 2017 to 2032

Table 94: Middle East and Africa Volume (MT) Forecast by Mode of operation, 2017 to 2032

Table 95: Middle East and Africa Value (US$ Million) Forecast by Coating type, 2017 to 2032

Table 96: Middle East and Africa Volume (MT) Forecast by Coating type, 2017 to 2032

List of Charts

Figure 1: Global Value (US$ Million) by Batter type, 2022 to 2032

Figure 2: Global Value (US$ Million) by Application, 2022 to 2032

Figure 3: Global Value (US$ Million) by Form, 2022 to 2032

Figure 4: Global Value (US$ Million) by Mode of operation, 2022 to 2032

Figure 5: Global Value (US$ Million) by Coating type, 2022 to 2032

Figure 6: Global Value (US$ Million) by Region, 2022 to 2032

Figure 7: Global Value (US$ Million) Analysis by Region, 2017 to 2032

Figure 8: Global Volume (MT) Analysis by Region, 2017 to 2032

Figure 9: Global Value Share (%) and BPS Analysis by Region, 2022 to 2032

Figure 10: Global Y-o-Y Growth (%) Projections by Region, 2022 to 2032

Figure 11: Global Value (US$ Million) Analysis by Batter type, 2017 to 2032

Figure 12: Global Volume (MT) Analysis by Batter type, 2017 to 2032

Figure 13: Global Value Share (%) and BPS Analysis by Batter type, 2022 to 2032

Figure 14: Global Y-o-Y Growth (%) Projections by Batter type, 2022 to 2032

Figure 15: Global Value (US$ Million) Analysis by Application, 2017 to 2032

Figure 16: Global Volume (MT) Analysis by Application, 2017 to 2032

Figure 17: Global Value Share (%) and BPS Analysis by Application, 2022 to 2032

Figure 18: Global Y-o-Y Growth (%) Projections by Application, 2022 to 2032

Figure 19: Global Value (US$ Million) Analysis by Form, 2017 to 2032

Figure 20: Global Volume (MT) Analysis by Form, 2017 to 2032

Figure 21: Global Value Share (%) and BPS Analysis by Form, 2022 to 2032

Figure 22: Global Y-o-Y Growth (%) Projections by Form, 2022 to 2032

Figure 23: Global Value (US$ Million) Analysis by Mode of operation, 2017 to 2032

Figure 24: Global Volume (MT) Analysis by Mode of operation, 2017 to 2032

Figure 25: Global Value Share (%) and BPS Analysis by Mode of operation, 2022 to 2032

Figure 26: Global Y-o-Y Growth (%) Projections by Mode of operation, 2022 to 2032

Figure 27: Global Value (US$ Million) Analysis by Coating type, 2017 to 2032

Figure 28: Global Volume (MT) Analysis by Coating type, 2017 to 2032

Figure 29: Global Value Share (%) and BPS Analysis by Coating type, 2022 to 2032

Figure 30: Global Y-o-Y Growth (%) Projections by Coating type, 2022 to 2032

Figure 31: Global Attractiveness by Batter type, 2022 to 2032

Figure 32: Global Attractiveness by Application, 2022 to 2032

Figure 33: Global Attractiveness by Form, 2022 to 2032

Figure 34: Global Attractiveness by Mode of operation, 2022 to 2032

Figure 35: Global Attractiveness by Coating type, 2022 to 2032

Figure 36: Global Attractiveness by Region, 2022 to 2032

Figure 37: North America Value (US$ Million) by Batter type, 2022 to 2032

Figure 38: North America Value (US$ Million) by Application, 2022 to 2032

Figure 39: North America Value (US$ Million) by Form, 2022 to 2032

Figure 40: North America Value (US$ Million) by Mode of operation, 2022 to 2032

Figure 41: North America Value (US$ Million) by Coating type, 2022 to 2032

Figure 42: North America Value (US$ Million) by Country, 2022 to 2032

Figure 43: North America Value (US$ Million) Analysis by Country, 2017 to 2032

Figure 44: North America Volume (MT) Analysis by Country, 2017 to 2032

Figure 45: North America Value Share (%) and BPS Analysis by Country, 2022 to 2032

Figure 46: North America Y-o-Y Growth (%) Projections by Country, 2022 to 2032

Figure 47: North America Value (US$ Million) Analysis by Batter type, 2017 to 2032

Figure 48: North America Volume (MT) Analysis by Batter type, 2017 to 2032

Figure 49: North America Value Share (%) and BPS Analysis by Batter type, 2022 to 2032

Figure 50: North America Y-o-Y Growth (%) Projections by Batter type, 2022 to 2032

Figure 51: North America Value (US$ Million) Analysis by Application, 2017 to 2032

Figure 52: North America Volume (MT) Analysis by Application, 2017 to 2032

Figure 53: North America Value Share (%) and BPS Analysis by Application, 2022 to 2032

Figure 54: North America Y-o-Y Growth (%) Projections by Application, 2022 to 2032

Figure 55: North America Value (US$ Million) Analysis by Form, 2017 to 2032

Figure 56: North America Volume (MT) Analysis by Form, 2017 to 2032

Figure 57: North America Value Share (%) and BPS Analysis by Form, 2022 to 2032

Figure 58: North America Y-o-Y Growth (%) Projections by Form, 2022 to 2032

Figure 59: North America Value (US$ Million) Analysis by Mode of operation, 2017 to 2032

Figure 60: North America Volume (MT) Analysis by Mode of operation, 2017 to 2032

Figure 61: North America Value Share (%) and BPS Analysis by Mode of operation, 2022 to 2032

Figure 62: North America Y-o-Y Growth (%) Projections by Mode of operation, 2022 to 2032

Figure 63: North America Value (US$ Million) Analysis by Coating type, 2017 to 2032

Figure 64: North America Volume (MT) Analysis by Coating type, 2017 to 2032

Figure 65: North America Value Share (%) and BPS Analysis by Coating type, 2022 to 2032

Figure 66: North America Y-o-Y Growth (%) Projections by Coating type, 2022 to 2032

Figure 67: North America Attractiveness by Batter type, 2022 to 2032

Figure 68: North America Attractiveness by Application, 2022 to 2032

Figure 69: North America Attractiveness by Form, 2022 to 2032

Figure 70: North America Attractiveness by Mode of operation, 2022 to 2032

Figure 71: North America Attractiveness by Coating type, 2022 to 2032

Figure 72: North America Attractiveness by Country, 2022 to 2032

Figure 73: Latin America Value (US$ Million) by Batter type, 2022 to 2032

Figure 74: Latin America Value (US$ Million) by Application, 2022 to 2032

Figure 75: Latin America Value (US$ Million) by Form, 2022 to 2032

Figure 76: Latin America Value (US$ Million) by Mode of operation, 2022 to 2032

Figure 77: Latin America Value (US$ Million) by Coating type, 2022 to 2032

Figure 78: Latin America Value (US$ Million) by Country, 2022 to 2032

Figure 79: Latin America Value (US$ Million) Analysis by Country, 2017 to 2032

Figure 80: Latin America Volume (MT) Analysis by Country, 2017 to 2032

Figure 81: Latin America Value Share (%) and BPS Analysis by Country, 2022 to 2032

Figure 82: Latin America Y-o-Y Growth (%) Projections by Country, 2022 to 2032

Figure 83: Latin America Value (US$ Million) Analysis by Batter type, 2017 to 2032

Figure 84: Latin America Volume (MT) Analysis by Batter type, 2017 to 2032

Figure 85: Latin America Value Share (%) and BPS Analysis by Batter type, 2022 to 2032

Figure 86: Latin America Y-o-Y Growth (%) Projections by Batter type, 2022 to 2032

Figure 87: Latin America Value (US$ Million) Analysis by Application, 2017 to 2032

Figure 88: Latin America Volume (MT) Analysis by Application, 2017 to 2032

Figure 89: Latin America Value Share (%) and BPS Analysis by Application, 2022 to 2032

Figure 90: Latin America Y-o-Y Growth (%) Projections by Application, 2022 to 2032

Figure 91: Latin America Value (US$ Million) Analysis by Form, 2017 to 2032

Figure 92: Latin America Volume (MT) Analysis by Form, 2017 to 2032

Figure 93: Latin America Value Share (%) and BPS Analysis by Form, 2022 to 2032

Figure 94: Latin America Y-o-Y Growth (%) Projections by Form, 2022 to 2032

Figure 95: Latin America Value (US$ Million) Analysis by Mode of operation, 2017 to 2032

Figure 96: Latin America Volume (MT) Analysis by Mode of operation, 2017 to 2032

Figure 97: Latin America Value Share (%) and BPS Analysis by Mode of operation, 2022 to 2032

Figure 98: Latin America Y-o-Y Growth (%) Projections by Mode of operation, 2022 to 2032

Figure 99: Latin America Value (US$ Million) Analysis by Coating type, 2017 to 2032

Figure 100: Latin America Volume (MT) Analysis by Coating type, 2017 to 2032

Figure 101: Latin America Value Share (%) and BPS Analysis by Coating type, 2022 to 2032

Figure 102: Latin America Y-o-Y Growth (%) Projections by Coating type, 2022 to 2032

Figure 103: Latin America Attractiveness by Batter type, 2022 to 2032

Figure 104: Latin America Attractiveness by Application, 2022 to 2032

Figure 105: Latin America Attractiveness by Form, 2022 to 2032

Figure 106: Latin America Attractiveness by Mode of operation, 2022 to 2032

Figure 107: Latin America Attractiveness by Coating type, 2022 to 2032

Figure 108: Latin America Attractiveness by Country, 2022 to 2032

Figure 109: Europe Value (US$ Million) by Batter type, 2022 to 2032

Figure 110: Europe Value (US$ Million) by Application, 2022 to 2032

Figure 111: Europe Value (US$ Million) by Form, 2022 to 2032

Figure 112: Europe Value (US$ Million) by Mode of operation, 2022 to 2032

Figure 113: Europe Value (US$ Million) by Coating type, 2022 to 2032

Figure 114: Europe Value (US$ Million) by Country, 2022 to 2032

Figure 115: Europe Value (US$ Million) Analysis by Country, 2017 to 2032

Figure 116: Europe Volume (MT) Analysis by Country, 2017 to 2032

Figure 117: Europe Value Share (%) and BPS Analysis by Country, 2022 to 2032

Figure 118: Europe Y-o-Y Growth (%) Projections by Country, 2022 to 2032

Figure 119: Europe Value (US$ Million) Analysis by Batter type, 2017 to 2032

Figure 120: Europe Volume (MT) Analysis by Batter type, 2017 to 2032

Figure 121: Europe Value Share (%) and BPS Analysis by Batter type, 2022 to 2032

Figure 122: Europe Y-o-Y Growth (%) Projections by Batter type, 2022 to 2032

Figure 123: Europe Value (US$ Million) Analysis by Application, 2017 to 2032

Figure 124: Europe Volume (MT) Analysis by Application, 2017 to 2032

Figure 125: Europe Value Share (%) and BPS Analysis by Application, 2022 to 2032

Figure 126: Europe Y-o-Y Growth (%) Projections by Application, 2022 to 2032

Figure 127: Europe Value (US$ Million) Analysis by Form, 2017 to 2032

Figure 128: Europe Volume (MT) Analysis by Form, 2017 to 2032

Figure 129: Europe Value Share (%) and BPS Analysis by Form, 2022 to 2032

Figure 130: Europe Y-o-Y Growth (%) Projections by Form, 2022 to 2032

Figure 131: Europe Value (US$ Million) Analysis by Mode of operation, 2017 to 2032

Figure 132: Europe Volume (MT) Analysis by Mode of operation, 2017 to 2032

Figure 133: Europe Value Share (%) and BPS Analysis by Mode of operation, 2022 to 2032

Figure 134: Europe Y-o-Y Growth (%) Projections by Mode of operation, 2022 to 2032

Figure 135: Europe Value (US$ Million) Analysis by Coating type, 2017 to 2032

Figure 136: Europe Volume (MT) Analysis by Coating type, 2017 to 2032

Figure 137: Europe Value Share (%) and BPS Analysis by Coating type, 2022 to 2032

Figure 138: Europe Y-o-Y Growth (%) Projections by Coating type, 2022 to 2032

Figure 139: Europe Attractiveness by Batter type, 2022 to 2032

Figure 140: Europe Attractiveness by Application, 2022 to 2032

Figure 141: Europe Attractiveness by Form, 2022 to 2032

Figure 142: Europe Attractiveness by Mode of operation, 2022 to 2032

Figure 143: Europe Attractiveness by Coating type, 2022 to 2032

Figure 144: Europe Attractiveness by Country, 2022 to 2032

Figure 145: East Asia Value (US$ Million) by Batter type, 2022 to 2032

Figure 146: East Asia Value (US$ Million) by Application, 2022 to 2032

Figure 147: East Asia Value (US$ Million) by Form, 2022 to 2032

Figure 148: East Asia Value (US$ Million) by Mode of operation, 2022 to 2032

Figure 149: East Asia Value (US$ Million) by Coating type, 2022 to 2032

Figure 150: East Asia Value (US$ Million) by Country, 2022 to 2032

Figure 151: East Asia Value (US$ Million) Analysis by Country, 2017 to 2032

Figure 152: East Asia Volume (MT) Analysis by Country, 2017 to 2032

Figure 153: East Asia Value Share (%) and BPS Analysis by Country, 2022 to 2032

Figure 154: East Asia Y-o-Y Growth (%) Projections by Country, 2022 to 2032

Figure 155: East Asia Value (US$ Million) Analysis by Batter type, 2017 to 2032

Figure 156: East Asia Volume (MT) Analysis by Batter type, 2017 to 2032

Figure 157: East Asia Value Share (%) and BPS Analysis by Batter type, 2022 to 2032

Figure 158: East Asia Y-o-Y Growth (%) Projections by Batter type, 2022 to 2032

Figure 159: East Asia Value (US$ Million) Analysis by Application, 2017 to 2032

Figure 160: East Asia Volume (MT) Analysis by Application, 2017 to 2032

Figure 161: East Asia Value Share (%) and BPS Analysis by Application, 2022 to 2032

Figure 162: East Asia Y-o-Y Growth (%) Projections by Application, 2022 to 2032

Figure 163: East Asia Value (US$ Million) Analysis by Form, 2017 to 2032

Figure 164: East Asia Volume (MT) Analysis by Form, 2017 to 2032

Figure 165: East Asia Value Share (%) and BPS Analysis by Form, 2022 to 2032

Figure 166: East Asia Y-o-Y Growth (%) Projections by Form, 2022 to 2032

Figure 167: East Asia Value (US$ Million) Analysis by Mode of operation, 2017 to 2032

Figure 168: East Asia Volume (MT) Analysis by Mode of operation, 2017 to 2032

Figure 169: East Asia Value Share (%) and BPS Analysis by Mode of operation, 2022 to 2032

Figure 170: East Asia Y-o-Y Growth (%) Projections by Mode of operation, 2022 to 2032

Figure 171: East Asia Value (US$ Million) Analysis by Coating type, 2017 to 2032

Figure 172: East Asia Volume (MT) Analysis by Coating type, 2017 to 2032

Figure 173: East Asia Value Share (%) and BPS Analysis by Coating type, 2022 to 2032

Figure 174: East Asia Y-o-Y Growth (%) Projections by Coating type, 2022 to 2032

Figure 175: East Asia Attractiveness by Batter type, 2022 to 2032

Figure 176: East Asia Attractiveness by Application, 2022 to 2032

Figure 177: East Asia Attractiveness by Form, 2022 to 2032

Figure 178: East Asia Attractiveness by Mode of operation, 2022 to 2032

Figure 179: East Asia Attractiveness by Coating type, 2022 to 2032

Figure 180: East Asia Attractiveness by Country, 2022 to 2032

Figure 181: South Asia Value (US$ Million) by Batter type, 2022 to 2032

Figure 182: South Asia Value (US$ Million) by Application, 2022 to 2032

Figure 183: South Asia Value (US$ Million) by Form, 2022 to 2032

Figure 184: South Asia Value (US$ Million) by Mode of operation, 2022 to 2032

Figure 185: South Asia Value (US$ Million) by Coating type, 2022 to 2032

Figure 186: South Asia Value (US$ Million) by Country, 2022 to 2032

Figure 187: South Asia Value (US$ Million) Analysis by Country, 2017 to 2032

Figure 188: South Asia Volume (MT) Analysis by Country, 2017 to 2032

Figure 189: South Asia Value Share (%) and BPS Analysis by Country, 2022 to 2032

Figure 190: South Asia Y-o-Y Growth (%) Projections by Country, 2022 to 2032

Figure 191: South Asia Value (US$ Million) Analysis by Batter type, 2017 to 2032

Figure 192: South Asia Volume (MT) Analysis by Batter type, 2017 to 2032

Figure 193: South Asia Value Share (%) and BPS Analysis by Batter type, 2022 to 2032

Figure 194: South Asia Y-o-Y Growth (%) Projections by Batter type, 2022 to 2032

Figure 195: South Asia Value (US$ Million) Analysis by Application, 2017 to 2032

Figure 196: South Asia Volume (MT) Analysis by Application, 2017 to 2032

Figure 197: South Asia Value Share (%) and BPS Analysis by Application, 2022 to 2032

Figure 198: South Asia Y-o-Y Growth (%) Projections by Application, 2022 to 2032

Figure 199: South Asia Value (US$ Million) Analysis by Form, 2017 to 2032

Figure 200: South Asia Volume (MT) Analysis by Form, 2017 to 2032

Figure 201: South Asia Value Share (%) and BPS Analysis by Form, 2022 to 2032

Figure 202: South Asia Y-o-Y Growth (%) Projections by Form, 2022 to 2032

Figure 203: South Asia Value (US$ Million) Analysis by Mode of operation, 2017 to 2032

Figure 204: South Asia Volume (MT) Analysis by Mode of operation, 2017 to 2032

Figure 205: South Asia Value Share (%) and BPS Analysis by Mode of operation, 2022 to 2032

Figure 206: South Asia Y-o-Y Growth (%) Projections by Mode of operation, 2022 to 2032

Figure 207: South Asia Value (US$ Million) Analysis by Coating type, 2017 to 2032

Figure 208: South Asia Volume (MT) Analysis by Coating type, 2017 to 2032

Figure 209: South Asia Value Share (%) and BPS Analysis by Coating type, 2022 to 2032

Figure 210: South Asia Y-o-Y Growth (%) Projections by Coating type, 2022 to 2032

Figure 211: South Asia Attractiveness by Batter type, 2022 to 2032

Figure 212: South Asia Attractiveness by Application, 2022 to 2032

Figure 213: South Asia Attractiveness by Form, 2022 to 2032

Figure 214: South Asia Attractiveness by Mode of operation, 2022 to 2032

Figure 215: South Asia Attractiveness by Coating type, 2022 to 2032

Figure 216: South Asia Attractiveness by Country, 2022 to 2032

Figure 217: Oceania Value (US$ Million) by Batter type, 2022 to 2032

Figure 218: Oceania Value (US$ Million) by Application, 2022 to 2032

Figure 219: Oceania Value (US$ Million) by Form, 2022 to 2032

Figure 220: Oceania Value (US$ Million) by Mode of operation, 2022 to 2032

Figure 221: Oceania Value (US$ Million) by Coating type, 2022 to 2032

Figure 222: Oceania Value (US$ Million) by Country, 2022 to 2032

Figure 223: Oceania Value (US$ Million) Analysis by Country, 2017 to 2032

Figure 224: Oceania Volume (MT) Analysis by Country, 2017 to 2032

Figure 225: Oceania Value Share (%) and BPS Analysis by Country, 2022 to 2032

Figure 226: Oceania Y-o-Y Growth (%) Projections by Country, 2022 to 2032

Figure 227: Oceania Value (US$ Million) Analysis by Batter type, 2017 to 2032

Figure 228: Oceania Volume (MT) Analysis by Batter type, 2017 to 2032

Figure 229: Oceania Value Share (%) and BPS Analysis by Batter type, 2022 to 2032

Figure 230: Oceania Y-o-Y Growth (%) Projections by Batter type, 2022 to 2032

Figure 231: Oceania Value (US$ Million) Analysis by Application, 2017 to 2032

Figure 232: Oceania Volume (MT) Analysis by Application, 2017 to 2032

Figure 233: Oceania Value Share (%) and BPS Analysis by Application, 2022 to 2032

Figure 234: Oceania Y-o-Y Growth (%) Projections by Application, 2022 to 2032

Figure 235: Oceania Value (US$ Million) Analysis by Form, 2017 to 2032

Figure 236: Oceania Volume (MT) Analysis by Form, 2017 to 2032

Figure 237: Oceania Value Share (%) and BPS Analysis by Form, 2022 to 2032

Figure 238: Oceania Y-o-Y Growth (%) Projections by Form, 2022 to 2032

Figure 239: Oceania Value (US$ Million) Analysis by Mode of operation, 2017 to 2032

Figure 240: Oceania Volume (MT) Analysis by Mode of operation, 2017 to 2032

Figure 241: Oceania Value Share (%) and BPS Analysis by Mode of operation, 2022 to 2032

Figure 242: Oceania Y-o-Y Growth (%) Projections by Mode of operation, 2022 to 2032

Figure 243: Oceania Value (US$ Million) Analysis by Coating type, 2017 to 2032

Figure 244: Oceania Volume (MT) Analysis by Coating type, 2017 to 2032

Figure 245: Oceania Value Share (%) and BPS Analysis by Coating type, 2022 to 2032

Figure 246: Oceania Y-o-Y Growth (%) Projections by Coating type, 2022 to 2032

Figure 247: Oceania Attractiveness by Batter type, 2022 to 2032

Figure 248: Oceania Attractiveness by Application, 2022 to 2032

Figure 249: Oceania Attractiveness by Form, 2022 to 2032

Figure 250: Oceania Attractiveness by Mode of operation, 2022 to 2032

Figure 251: Oceania Attractiveness by Coating type, 2022 to 2032

Figure 252: Oceania Attractiveness by Country, 2022 to 2032

Figure 253: Middle East and Africa Value (US$ Million) by Batter type, 2022 to 2032

Figure 254: Middle East and Africa Value (US$ Million) by Application, 2022 to 2032

Figure 255: Middle East and Africa Value (US$ Million) by Form, 2022 to 2032

Figure 256: Middle East and Africa Value (US$ Million) by Mode of operation, 2022 to 2032

Figure 257: Middle East and Africa Value (US$ Million) by Coating type, 2022 to 2032

Figure 258: Middle East and Africa Value (US$ Million) by Country, 2022 to 2032

Figure 259: Middle East and Africa Value (US$ Million) Analysis by Country, 2017 to 2032

Figure 260: Middle East and Africa Volume (MT) Analysis by Country, 2017 to 2032

Figure 261: Middle East and Africa Value Share (%) and BPS Analysis by Country, 2022 to 2032

Figure 262: Middle East and Africa Y-o-Y Growth (%) Projections by Country, 2022 to 2032

Figure 263: Middle East and Africa Value (US$ Million) Analysis by Batter type, 2017 to 2032

Figure 264: Middle East and Africa Volume (MT) Analysis by Batter type, 2017 to 2032

Figure 265: Middle East and Africa Value Share (%) and BPS Analysis by Batter type, 2022 to 2032

Figure 266: Middle East and Africa Y-o-Y Growth (%) Projections by Batter type, 2022 to 2032

Figure 267: Middle East and Africa Value (US$ Million) Analysis by Application, 2017 to 2032

Figure 268: Middle East and Africa Volume (MT) Analysis by Application, 2017 to 2032

Figure 269: Middle East and Africa Value Share (%) and BPS Analysis by Application, 2022 to 2032

Figure 270: Middle East and Africa Y-o-Y Growth (%) Projections by Application, 2022 to 2032

Figure 271: Middle East and Africa Value (US$ Million) Analysis by Form, 2017 to 2032

Figure 272: Middle East and Africa Volume (MT) Analysis by Form, 2017 to 2032

Figure 273: Middle East and Africa Value Share (%) and BPS Analysis by Form, 2022 to 2032

Figure 274: Middle East and Africa Y-o-Y Growth (%) Projections by Form, 2022 to 2032

Figure 275: Middle East and Africa Value (US$ Million) Analysis by Mode of operation, 2017 to 2032

Figure 276: Middle East and Africa Volume (MT) Analysis by Mode of operation, 2017 to 2032

Figure 277: Middle East and Africa Value Share (%) and BPS Analysis by Mode of operation, 2022 to 2032

Figure 278: Middle East and Africa Y-o-Y Growth (%) Projections by Mode of operation, 2022 to 2032

Figure 279: Middle East and Africa Value (US$ Million) Analysis by Coating type, 2017 to 2032

Figure 280: Middle East and Africa Volume (MT) Analysis by Coating type, 2017 to 2032

Figure 281: Middle East and Africa Value Share (%) and BPS Analysis by Coating type, 2022 to 2032

Figure 282: Middle East and Africa Y-o-Y Growth (%) Projections by Coating type, 2022 to 2032

Figure 283: Middle East and Africa Attractiveness by Batter type, 2022 to 2032

Figure 284: Middle East and Africa Attractiveness by Application, 2022 to 2032

Figure 285: Middle East and Africa Attractiveness by Form, 2022 to 2032

Figure 286: Middle East and Africa Attractiveness by Mode of operation, 2022 to 2032

Figure 287: Middle East and Africa Attractiveness by Coating type, 2022 to 2032

Figure 288: Middle East and Africa Attractiveness by Country, 2022 to 2032

Recommendations

Food and Beverage

Food Additive Market

Published : January 2024

Chemicals & Materials

Coating Additives Market

Published : August 2023

Food and Beverage

Food Preservatives Market

Published : February 2023

Food and Beverage

Food Enzymes Market

Published : July 2022

Explore Food and Beverage Insights

View Reports

Batters and Coatings Market